Abstract
Background and aims: Both bile salts and glutathione participate in the generation of canalicular bile flow. In this work, we have investigated the effect of different bile salts on hepatic glutathione metabolism.
Methods: Using the isolated and perfused rat liver, we studied hepatic glutathione content, and metabolism and catabolism of this compound in livers perfused with taurocholate, ursodeoxycholate, or deoxycholate.
Results: We found that in livers perfused with ursodeoxycholate, levels of glutathione and the activity of methionine adenosyltransferase (an enzyme involved in glutathione biosynthesis) were significantly higher than in livers perfused with other bile salts. In ursodeoxycholate perfused livers, methionine adenosyltransferase showed a predominant tetrameric conformation which is the isoform with highest activity at physiological concentrations of substrate. In contrast, the dimeric form prevailed in livers perfused with taurocholate or deoxycholate. The hepatic activities of γ-glutamylcysteine synthetase and γ-glutamyltranspeptidase, enzymes involved, respectively, in biosynthetic and catabolic pathways of glutathione, were not modified by bile salts.
Conclusions: Ursodeoxycholate specifically enhanced methionine adenosyltransferase activity and hepatic glutathione levels. As glutathione is a defensive substance against oxidative cell damage, our observations provide an additional explanation for the known hepatoprotective effects of ursodeoxycholate.
Keywords: oxidative stress, bile metabolism, S-adenosylmethionine metabolism
Glutathione is a tripeptide involved in a diversity of hepatocellular metabolic pathways. It has been shown that glutathione is the main promoter of the bile salt independent fraction of canalicular flow.1 In addition, glutathione is the principal intracellular defence of the liver against oxidative stress.2 The biosynthetic pathway of this compound has two main characteristics: the availability of cysteine and synthesis of glutathione from this amino acid.3 Cysteine can be obtained from the diet, from methionine (through the transsulphuration pathway), or as a subproduct of glutathione catabolism.4
In the conversion of cysteine to glutathione, the limiting enzyme is γ-glutamylcysteine synthetase (γ-GCS) which is controlled by negative feedback from its end product glutathione5 whereas the formation of cysteine involves several reactions in the named methionine cycle. This cycle begins with incorporation of an ATP molecule to methionine to form S-adenosylmethionine (AdoMet) in an irreversible reaction catalysed by the enzyme methionine adenosyltransferase (MAT).6 In mammals, AdoMet is mainly used in transmethylation reactions7 that produce S-adenosylhomocysteine. This metabolite is converted to homocysteine which either rapidly enters the transsulphuration pathway to yield glutathione or it is used for resynthesis of methionine.8
It has been shown that in the liver there is a close relationship between glutathione content and MAT activity,9–11 suggesting that this enzyme plays an important role in hepatic glutathione metabolism. In the liver, MAT can be found in two isoforms, MAT I and MAT III, which are the tetramer and dimer forms, respectively, of the same polypeptide subunit.12 These two isoforms have different kinetic properties and total MAT activity in the liver depends critically on the relative content of each.12
In the present study, we have investigated the effect of bile salts on hepatic glutathione metabolism in the isolated and perfused rat liver. Our data show that in contrast with other bile salts, ursodeoxycholic acid (UDC) specifically increases liver glutathione content by stimulating hepatic MAT activity. This paper provides evidence for a novel mechanism which contributes towards explaining the known hepatoprotective actions of UDC.
MATERIAL AND METHODS
Bile salts, ATP, methionine, glutathione reductase, bovine serum albumin, L-∝-aminobutyrate, pyruvate kinase, lactate dehydrogenase, and NADH were obtained from Sigma Chemical Co. (St Louis, Missouri, USA). [2-3H]ATP (25.5 Ci/mmol) was purchased from Amersham (Little Chalfont, UK). NYTRAN membranes were from Schleicher and Schuell (Keene, New Hampshire, USA). All other chemicals were of analytical reagent grade and were purchased from Merck (Darmstadt, Germany).
Livers from male Wistar rats (245–260 g body weight) were isolated and perfused in a recirculating anterograde way. The technique for liver isolation has been previously described.13 Briefly, after abdominal laparotomy the liver was exposed, and both the bile duct and portal vein were cannulated. The liver was perfused in situ with oxygenated Krebs-Ringer bicarbonate buffer to eliminate all blood components and the thoracic vena cava was then cannulated. After transferring the liver to an acrylic platform, it was placed in a thermostat controlled and humidified acrylic chamber, and perfused at 30 ml/min with 250 ml of Krebs-Ringer bicarbonate buffer containing: 116 mM NaCl, 4.7 mM KCl, 1.2 mM KH2PO4, 1 mM MgSO4, 1.25 mM CaCl2, 25 mM NaHCO3, 5 mM glucose, 0.2 mM pyruvate, 2 mM lactate, and 1% bovine serum albumin. Immediately after the beginning of perfusion, a continuous infusion of different bile salts was initiated and maintained during the 120 minutes of the experiments. The perfusion medium was continuously gassed with 95% O2/5% CO2, pH was automatically maintained at 7.35–7.40 with an automatic autoburette (Radiometer, Copenhagen, Denmark), and perfusion pressure was monitored (Letica pressure transducer, Barcelona, Spain). Animals were treated humanely and study protocols were approved by the ethics committee of animal experimentation of our institution.
We established three experimental groups in which 40 μmol/h of taurocholate (TC, n=5), ursodeoxycholate (UDC, n=6), or deoxycholate (DC, n=4) were infused for 120 minutes. The dose of 40 μmol/h was chosen on the basis of the studies of Gores et al in which they found that this rate was suitable to maintain bile flow in the isolated rat liver.14 To test the effect of higher doses of TC, UDC, or DC, the study was repeated with 60 μmol/h of these bile salts in three additional groups of animals (n=4 for each group). All bile produced in 10 minute intervals from minute 0 onwards was collected in preweighed polypropylene tubes containing 70 μl of 3% metaphosphoric acid to reduce spontaneous oxidation of glutathione in bile,15 and samples of hepatic effluent were obtained every 30 minutes. At the end of the experiments, several fragments of each liver were rapidly frozen and stored at −80°C until use.
The viability of the livers during the experiments was assessed by measuring aspartate aminotransferase (AST) and lactate dehydrogenase (LDH) in the effluent perfusate. Bile flow was calculated by gravimetry (assuming a bile density of 1), and total bile salts in bile and in the perfusate were quantified by the 3α-hydroxysteroid dehydrogenase method. Total glutathione in bile, hepatic effluent, and hepatic tissue was measured by the method of Tietze,16 with minor modifications. Perfusate levels of AST and LDH, and γ-glutamyltranspeptidase (γ-GT) activity in the livers were measured by conventional enzymatic methods, using a Cobas Fara analyser (Roche Diagnostics, Basel, Switzerland).
The hepatic biosynthetic pathway of glutathione was evaluated by measuring the activities of γ-GCS and MAT. For determination of hepatic γ-GCS activity, the liver tissue was homogenised (1:5) in 0.2 M Tris HCl buffer, pH 8.0, using an Ultraturrax tissue tearer (IKA Labortechnik, Staufen, Germany) at 22 000 rpm for 30 seconds on ice. Enzyme activity was measured following the method described by Seelig and Meister.17 Briefly, 50 μl of tissue homogenate were added to a 1 ml incubation mixture containing 0.1 M Tris HCl buffer, 150 mM KCl, 5 mM Na2ATP, 2 mM phosphoenolpyruvate, 10 mM l-glutamate, 10 mM L-∝-aminobutyrate, 20 mM MgCl2, 2 mM Na2-EDTA, 0.2 mM NADH, 17 μg of pyruvate kinase, and 17 μg of LDH, and the decrease in absorbance at 340 nm was followed. A control assay was performed by omission of L-∝-aminobutyrate in the presence of tissue sample. Enzyme activity was expressed as nmol NADH/min/mg protein. Protein was determined by the pyrogallol red-molybdate method18 using a Cobas Mira analyser (Roche Diagnostics, Basel, Switzerland).
Liver samples (about 1 g) used for determination of MAT activity were homogenised with a Potter-Elvehjem apparatus in four volumes of ice cold 10 mM Tris HCl (pH 7.5) containing 0.3 M sucrose with 0.1% β-mercaptoethanol, 1 mM benzamidine, and 0.1 mM phenylmethylsulphonyl fluoride. The homogenate was centrifuged at 12 500 g for 20 minutes at 4°C, and the supernatant was centrifuged again at 105 000 g for 60 minutes at 4°C.19 The supernatant was used to quantify MAT activity as described previously.19 Also, a possible direct effect of bile salts on MAT activity was tested by using purified MAT III20 in the presence of 30 or 500 μM of TC, UDC, or DC.
For northern blot analysis, total liver RNA was isolated by the guanidinium thiocyanate method.21 Aliquots (20 μg) of total RNA were denatured at 65°C for five minutes in 5% formaldehyde, 50% formamide, 8% glycerol, and then size fractionated by electrophoresis (20 mA, 15 hours) in a 0.9% agarose gel under denaturing conditions. RNAs were then blotted and fixed to NYTRAN membranes. Prehybridisation and hybridisation were carried out as described previously.22 MAT mRNA levels were measured using a 2.2 kb EcoRI cDNA fragment of rat liver MAT.23 mRNA levels of inducible nitric oxide synthase (iNOS) were determined using a 0.8 kb EcoRI/HindIII fragment from the macrophage iNOS cDNA.24 Mn superoxide dismutase (MnSOD) mRNA levels were determined using a 0.8 kb EcoRI/HindIII fragment from rat liver cDNA (generous gift of Dr D Massaro, Georgetown University, Washington DC, USA). Equal loading of the RNA gels was assessed by hybridisation with a probe specific for β-actin.25
For determination of MAT protein levels, liver samples were homogenised in four volumes of ice cold 10 mM Tris/HCl (pH 7.5) containing 0.3 M sucrose, 0.1% β-mercaptoethanol, and protease inhibitors, as above. The homogenate was centrifuged for one hour at 100 000 g. Protein concentration was measured in the supernatants by the method of Bradford,26 and equal amounts of protein (30 μg) were subjected to 10% sodium dodecyl sulphate-polyacrylamide gel electrophoresis (SDS-PAGE). Proteins were electrophoretically transferred to nitrocellulose membranes in a buffer containing 25 mM Tris, 192 mM glycine, and 20 % (vol/vol) methanol. Membranes were blocked overnight with 1% low fat dry milk in Tris buffered saline containing 0.05% Tween 20. Immunodetection of MAT was performed using a rabbit anti-MAT antiserum27 and a horseradish peroxidase conjugated secondary antibody. Blots were developed by enhanced chemiluminescence according to the manufacturer's instructions (Dupont, Boston, Massachusetts, USA).
In order to evaluate the relative content of MAT I and MAT III, 200 mg of liver tissue were homogenised in 1 ml of the same buffer described above for determination of levels of MAT protein. Homogenates were centrifuged at 100 000 g for one hour and the supernatants (1 ml) were loaded onto 5 ml disposable polypropylene columns containing 1 ml bed volume of phenyl-Sepharose CL-4B equilibrated in buffer A (10 mM HEPES/Na (pH 7.5) with 1 mM EDTA and 10 mM MgSO4). MAT I and MAT III were eluted from the phenyl-Sepharose column as previously described.27 Briefly, MAT I was recovered in the flow through fraction (total volume of 4 ml) and after washing the column with 8 ml buffer A, MAT III was eluted with 4 ml of buffer A containing 50% dimethyl sulphoxide. Aliquots of the MAT I eluate (0.5 ml) were lyophilised and resuspended in 100 μl of 1× SDS-PAGE loading buffer. In parallel, 50 μl of the dimethyl sulphoxide fraction (MAT III) (total volume 4 ml) were diluted with 50 μl of the 2× loading buffer. Then, 40 μl of each preparation were analysed by SDS-PAGE and anti-MAT antibody immunoblotting, as described above.
Statistical comparisons between experimental groups were performed by the Mann-Whitney, Wilcoxon, and Kruskal-Wallis non-parametric tests.28 Values are expressed as mean (SEM).
RESULTS
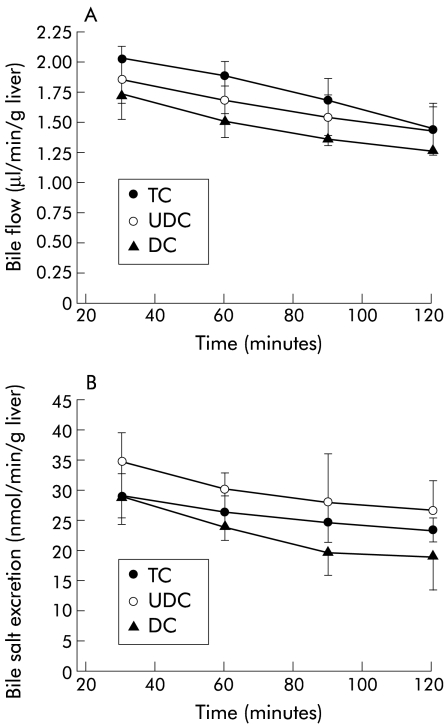
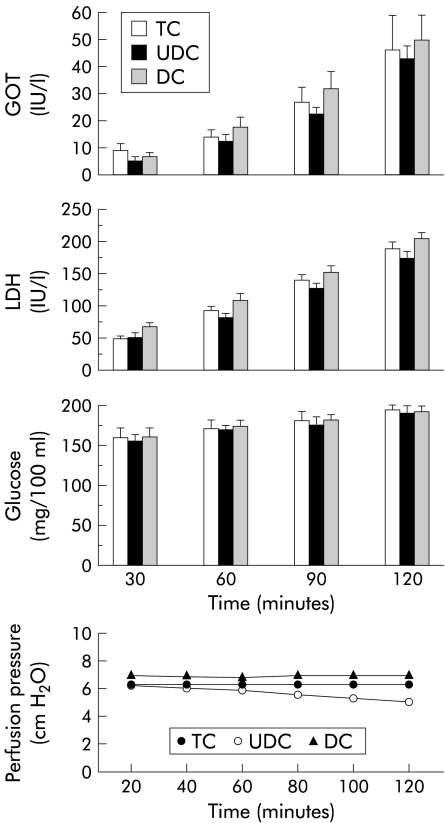
As observed in fig 1 ▶, bile flow and biliary bile salt excretion during the experimental period were similar in livers perfused with 40 μmol/h of TC, UDC, or DC and concentrations of bile salts in the perfusate were also comparable in the three groups (TC 12.72 (4.03); UDC 14.39 (2.91); and DC 17.72 (3.27) μM; NS). Likewise, liver viability, assessed by release into the effluent of AST, LDH, and glucose, was not significantly different between the groups (fig 2 ▶). Levels of oxygen uptake were also similar in all groups (TC 2.12 (0.09); UDC 2.24 (0.03); and DC 1.96 (0.08) μmol/min/g liver; NS), and were adequate to maintain sufficient oxygen consumption.29 Finally, perfusion pressure at the beginning of perfusion was similar in all groups, and was maintained without significant changes during the experimental period (fig 2 ▶).
Figure 1.
Bile flow (A) and biliary bile salt excretion (B) over the course of the experiments in livers continuously infused with 40 μmol/h of taurocholate (TC; n=5), ursodeoxycholic acid (UDC; n=6), or deoxycholic acid (DC; n=4). Values are mean (SEM).
Figure 2.
Aspartate aminotransferase (GOT), lactate dehydrogenase (LDH), and glucose levels, and variation in perfusion pressure during the experimental period (120 minutes) in livers continuously infused with 40 μmol/h of taurocholate (TC; n=5), ursodeoxycholic acid (UDC; n=6), or deoxycholic acid (DC; n=4). Values are mean (SEM).
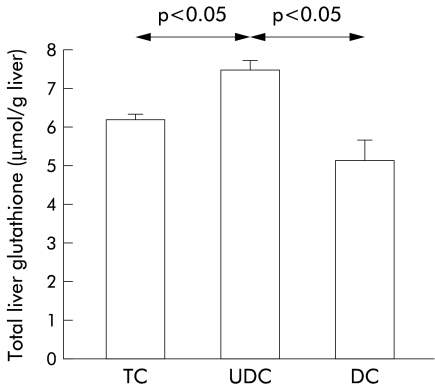
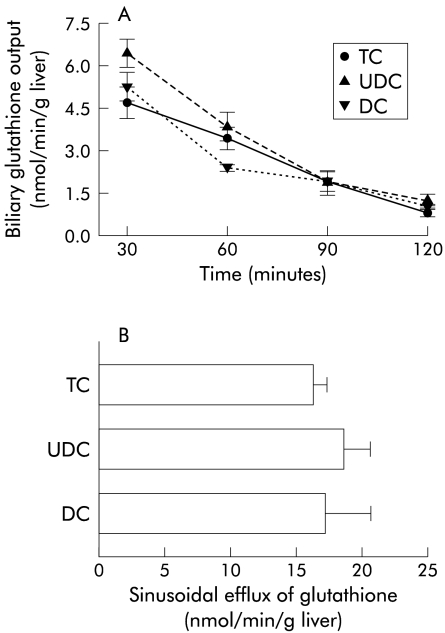
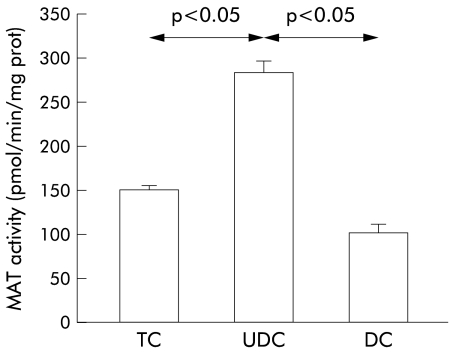
However, when we measured levels of glutathione in hepatic tissues collected at the end of the experiments, we observed a significant increase in glutathione content in livers perfused with UDC compared with TC or DC perfused livers (fig 3 ▶). As shown in fig 4 ▶, higher values of glutathione in UDC perfused livers were not due to differences in biliary excretion (fig 4A ▶) or in the sinusoidal efflux of this compound (fig 4B ▶). In addition, hepatic catabolism of glutathione, as estimated by γ-GT activity, was similar in the three experimental groups (36.1 (11.0), 37.5 (2.7), and 31.1 (8.3) mU/g liver, respectively, in TC, UDC, and DC groups; NS). To gain insight into the mechanisms responsible for the increased values of glutathione in livers perfused with UDC, we analysed the activity of the two main enzymes involved in glutathione synthesis, γ-GCS5 and MAT,8 in tissue samples collected at the end of the experiments. We observed no significant differences in hepatic γ-GCS activity among the groups (30.5 (5.5), 27.8 (5.0), and 21.9 (7.3) nmol/mg prot/min, in TC, UDC, and DC groups, respectively; NS) while MAT activity was significantly increased in livers perfused with UDC compared with the other groups (p<0.05) (fig 5 ▶). This increase in MAT activity was more pronounced when the livers were perfused with 60 μmol/h of bile salts. In parallel, UDC perfused livers showed a higher hepatic content of glutathione with respect to the other groups (see table 1 ▶).
Figure 3.
Hepatic content of total glutathione at the end of the experimental period (120 minutes) in livers continuously infused with 40 μmol/h of taurocholate (TC; n=5), ursodeoxycholic acid (UDC; n=6), or deoxycholic acid (DC; n=4). Values are mean (SEM). Statistically significant differences are indicated.
Figure 4.
(A) Biliary excretion of glutathione during the experimental period in livers perfused with 40 μmol/h of taurocholate (TC; n=5), ursodeoxycholate (UDC; n=6), or deoxycholate (DC; n=4). Values are mean (SEM) of biliary excretion of glutathione in the previous 30 minutes. (B) Sinusoidal efflux of glutathione. Bars represent mean (SEM) glutathione release to the hepatic effluent during the experimental period (120 minutes) in the same groups as before.
Figure 5.
Hepatic activity of methionine adenosyltransferase (MAT) at the end of the experimental period (120 minutes) in livers perfused with 40 μmol/h of taurocholate (TC; n=5), ursodeoxycholate (UDC; n=6), or deoxycholate (DC; n=4). Values are mean (SEM). Statistically significant differences are indicated.
Table 1.
Effect of bile salt infusion on liver methionine adenosyltransferase (MAT) activity and liver glutathione content
| Bile salt infused | |||
| TC | UDC | DC | |
| MAT activity† | |||
| Infusion rate | |||
| 40 μmol/h | 150.7 (5.1) | 284.9 (13.3)* | 103.8 (9.5) |
| 60 μmol/h | 162.6 (15.8) | 328.4 (81.1)* | 109.8 (21.9) |
| Glutathione content‡ | |||
| Infusion rate | |||
| 40 μmol/h | 6.22 (0.15) | 7.53 (0.24)* | 5.21 (0.53) |
| 60 μmol/h | 6.49 (1.3) | 10.02 (1.0)* | 5.52 (0.8) |
†Values are expressed as pmol/min/mg protein.
‡Values are expressed as μmol/g liver.
Livers were infused for 120 minutes with 40 or 60 μmol/h of taurocholate (TC; n=5), ursodeoxycholate (UDC; n=6), or deoxycholate (DC; n=4).
*p<0.05 compared with the other groups with the same infusion rate.
To test whether the observed rise in MAT activity was a consequence of increased MAT gene expression, levels of MAT mRNA and MAT protein were measured in all experimental groups. As shown in fig 6 ▶, no significant changes were observed between these groups with respect to both MAT mRNA and MAT protein levels, as determined by northern and western blots, respectively.
Figure 6.
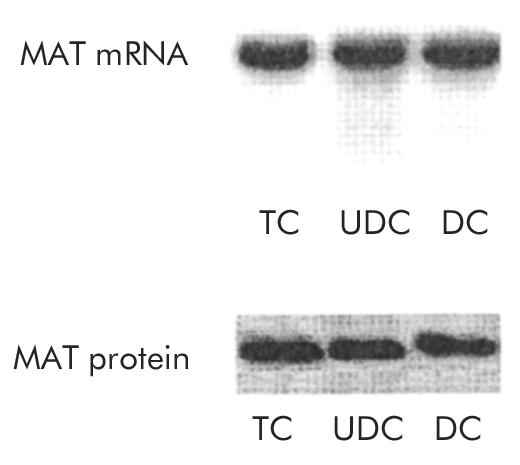
mRNA expression and protein levels of methionine adenosyltransferase (MAT) in livers perfused for 120 minutes with 40 μmol/h of taurocholate (TC; n=5), ursodeoxycholate (UDC; n=6), or deoxycholate (DC; n=4). Representative northern and western blots, respectively, are shown.
As both MAT activity and glutathione levels were affected by reactive nitrogen and oxygen species,30,31 we determined mRNA levels of iNOS and MnSOD, two enzymes implicated in the generation and metabolism of NO and O2−, respectively, as markers of oxidative and nitrosative stress in the different groups of livers. No significant changes were found in levels of these transcripts in the three experimental groups (data not shown), suggesting that variations in liver glutathione content and MAT activity induced by UDC are not due to an effect on oxygen or nitrogen free radical production.
Also, we investigated whether UDC could exert a direct effect on the activity of purified MAT in vitro. To verify this, the effect of increasing concentrations of TC, UDC, or DC was tested and compared with samples in which no bile salts were added. As can be seen in table 2 ▶, when the bile salt concentration increases, MAT activity decreases, independently of the bile salt used, although this effect was more evident in the samples in which DC was used. Nevertheless, at concentrations similar to those found in hepatocytes (that is, in the range 30–60 μM),32 no statistically significant differences were found between groups.
Table 2.
Effect of bile salts on methionine adenosyltransferase (MAT) activity in vitro
| Bile salt tested | |||
| TC | UDC | DC | |
| Bile salt concn | |||
| 30 μM | 119.8 (11.0) | 115.6 (7.9) | 101.6 (2.3) |
| 500 μM | 102.1 (6.7) | 94.5 (1.5) | 95.2 (2.7) |
| 2 mM | 95.2 (6.4) | 79.5 (5.5) | 60.9 (12.7) |
| 6.6 mM | 79.2 (7.6) | 61.7 (2.4) | 34.6 (8.1)* |
| 10 mM | 73.4 (5.9) | 50.5 (5.2) | 36.1 (7.9)* |
MAT activity was measured in vitro in the presence of increasing concentrations of the three bile salts studied (taurocholate (TC), ursodeoxycholate (UDC), or deoxycholate (DC); n=4–6 measurements at every point).
Results are expressed as percentage with respect to those obtained in samples in which no bile salts were added.
*p<0.05 with respect to corresponding values in the TC group.
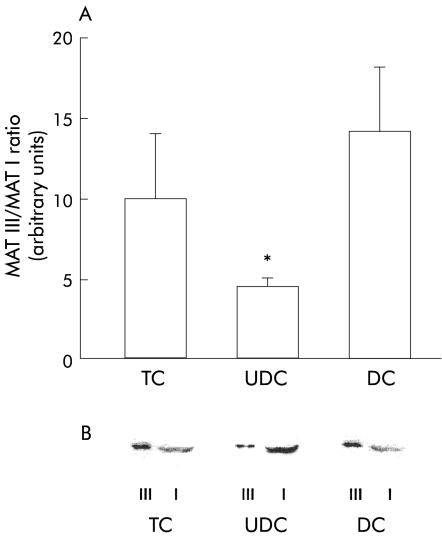
To analyse the mechanisms underlying the enhanced MAT activity in livers which received UDC infusion, we quantified the relative proportions of MAT I and MAT III in the three groups of livers by immunoblotting after separation of the two MAT isoenzymes using phenyl-Sepharose CL-4B chromatography.27 As shown in fig 7A ▶, the relative proportions of MAT I and MAT III were similar in TC and DC perfused livers. In contrast, in livers perfused with UDC, we observed an increase in the tetrameric isoform (MAT I) and a reduction in the dimeric isoform (MAT III), resulting in a marked decrease in the MAT III/MAT I ratio (4.5 (0.5) in the UDC group v 10 (4) and 14 (4) arbitrary units in TC and DC perfused livers, respectively; p<0.05). A representative immunoblot of MAT isoforms obtained from the cytosolic fraction of livers corresponding to the three experimental groups is shown in fig 7B ▶.
Figure 7.
Methionine adenosyltransferase (MAT) III and MAT I isoenzymes obtained from the hepatic tissue of livers continuously infused with taurocholic acid (TC; n=5), ursodeoxycholic acid (UDC; n=6), or deoxycholic acid (DC; n=4). The isoenzymes were separated by phenyl-Sepharose chromatography and analysed by immunoblotting. (A) MAT III/MAT I ratio for the different experimental groups, obtained by scanning densitometry of the autoradiograms. Values are mean (SEM); *p<0.05 with respect to the other groups. (B) Representative immunoblots of MAT III (III) and MAT I (I).
DISCUSSION
Our data demonstrate that UDC specifically influences the metabolism of glutathione in the liver. We found that hepatic glutathione levels were higher in livers perfused with UDC than in those which received TC or DC. As biliary excretion of glutathione and release of glutathione to the perfusate were similar in UDC, TC, and DC groups, the increased stores of this compound in livers treated with UDC should be due to differences in glutathione synthesis or catabolism. Our data indicate that changes in glutathione catabolism are unlikely to contribute to this effect as the activity of γ-GT, the enzyme which mediates catabolism of glutathione at the canalicular level,33 did not differ between groups. In contrast with this finding, other authors have reported that bile salts affect γ-GT activity; however, these data were generated with millimolar concentrations of bile salts in an in vitro model, and no information regarding the effect of UDC was reported.34,35
The biosynthetic pathway of glutathione in the liver involves several enzymes. The most important are γ-GCS, which is the rate limiting enzyme in the conversion of cysteine to glutathione,5 and MAT, whose activity, as previously shown, is closely related to glutathione concentration. Our results showed that the activity of γ-GCS was similar in all groups. Concerning MAT, in the liver there are two different conformations of the enzyme, the tetrameric (MAT I) and dimeric (MAT III) forms, the former being the most active at physiological concentrations of substrates.20 UDC favours the adoption of the tetrameric conformation and increases the MAT I/MAT III ratio. This effect of UDC could therefore explain the higher levels of glutathione observed in UDC perfused livers. In addition, it has been shown that high glutathione concentrations increases MAT activity.31,36 Thus increased synthesis of glutathione by enhanced MAT activity could in turn stimulate this enzyme. Enhanced MAT activity occurred in the absence of changes in MAT protein or MAT mRNA levels, and without variations in oxidative or nitrosative status (as estimated by MnSOD and iNOS mRNA values) in the three experimental groups studied. Therefore, it seems that UDC might elevate hepatic glutathione stores by favouring the tetrameric conformation of MAT, and both effects would enhance MAT activity. In agreement with our results, Mitsuyoshi et al have recently reported that UDC increases levels of glutathione in hepatocytes in vitro.37 These authors however did not analyse in their model the activity of MAT, an enzyme which, as we have shown, appears to be importantly influenced by UDC in vivo.
Other mechanisms have been postulated to explain the beneficial effect of UDC, including protection of bile ducts against injury induced by hydrophobic bile salts38 and stimulation of biliary secretion of toxic compounds.39 Although these mechanisms cannot be excluded it should be mentioned that we did not find stimulation of biliary secretion of bile salts or glutathione in livers perfused with UDC, suggesting that activation of biliary secretory processes is not a relevant effect of UDC in our model.
Glutathione is an essential factor in the cell defence against oxidative insults,2 and substrates for glutathione biosynthesis, such as AdoMet, have been shown to exert a protective effect against cholestasis and various forms of liver damage.40–45 As UDC stimulates the activity of MAT and enhances glutathione stores in the liver, our data reveal a new mechanism to account for the known hepatoprotective actions of this bile salt. The explanation for this unique effect of UDC could be related to the physicochemical and pharmacological properties of this bile salt that make it more hydrophilic than other bile salts tested in our experiments.39
In summary, our results showed that UDC augments the concentration of glutathione in the liver by enhancing MAT activity. This effect is an additional mechanism to explain the ability of UDC to defend the liver against cholestatic damage and toxic insults.
Acknowledgments
We thank Dr D Massaro (Georgetown University, Washington DC, USA) for the generous gift of a 0.8 kb EcoRI/HindIII fragment from rat liver cDNA used to determine mRNA levels of Mn superoxide dismutase, and Drs M García, A González, and JI Monreal for their technical help. We also acknowledge the economic support of the Plan Nacional de Investigación y Desarrollo (ref SAF 98/0132), Europharma, and Knoll Laboratories.
Abbreviations
AdoMet, S-adenosylmethionine
DC, deoxycholate
γ-GCS, γ-glutamylcysteine synthetase
γ-GT, γ-glutamyltranspeptidase
iNOS, inducible nitric oxide synthase
MAT, methionine adenosyltransferase
MnSOD, Mn superoxide dismutase
TC, taurocholate
UDC, ursodeoxycholate
AST, aspartate aminotransferase
LDH, lactate dehydrogenase
SDS-PAGE, sodium dodecyl sulphate-polyacrylamide gel electrophoresis
REFERENCES
- 1.Ballatori N, Truong AT. Glutathione as a primary osmotic driving force in hepatic bile formation. Am J Physiol 1992;263:G617–24. [DOI] [PubMed] [Google Scholar]
- 2.Jakoby WB. Detoxication: deconjugation and hydrolysis. In: Arias IM, Boyer JL, Fausto N, et al, eds. The liver: biology and pathobiology. New York: Raven Press, 1994;429–42.
- 3.DeLeve LD, Kaplowitz N. Glutathione metabolism and its role in hepatotoxicity. Pharmacol Ther 1991;52:287–305. [DOI] [PubMed] [Google Scholar]
- 4.Wang W, Ballatori N. Endogenous glutathione conjugates: occurrence and biological functions. Pharmacol Rev 1998;50:335–56. [PubMed] [Google Scholar]
- 5.Richman PG, Meister A. Regulation of gamma-glutamylcysteine synthetase by nonallosteric feedback inhibition by glutathione. J Biol Chem 1975;250:1422–6. [PubMed] [Google Scholar]
- 6.Cantoni GL. S-Adenosylmethionine: A new intermediate formed enzymatically from L-methionine and adenosine-triphosphate. J Biol Chem 1953;204:403–16. [PubMed] [Google Scholar]
- 7.Cantoni GL. Biochemical methylation: selected aspects. Annu Rev Biochem 1975;44:435–51. [DOI] [PubMed] [Google Scholar]
- 8.Mato JM, Alvarez L, Corrales FJ, et al. S-Adenosylmethionine and the liver. In: Arias IM, Boyer JL, Fausto N, et al, eds. The liver: biology and pathobiology. New York: Raven Press, 1994;461–70.
- 9.Pajares MA, Durán C, Corrales F, et al. Modulation of rat liver S-adenosylmethionine synthetase activity by glutathione. J Biol Chem 1992;267:17598–605. [PubMed] [Google Scholar]
- 10.Ruiz F, Corrales FJ, Miqueo C, et al. Nitric oxide inactivates rat hepatic methionine adenosyltransferase in vivo by S-nitrosylation. Hepatology 1998;28:1051–7. [DOI] [PubMed] [Google Scholar]
- 11.Corrales FJ, Ruiz F, Mato JM. In vivo regulation by glutathione of methionine adenosyltransferase S-nitrosylation in rat liver. J Hepatol 1999;31:887–94. [DOI] [PubMed] [Google Scholar]
- 12.Kotb M, Mudd SH, Mato JM, et al. Consensus nomenclature for the mammalian methionine adenosyltransferase genes and gene products. Trends Genet 1997;13:51–2. [DOI] [PubMed] [Google Scholar]
- 13.Rodríguez-Ortigosa CM, Vesperinas I, Qian C, et al. Taurocholate-stimulated leukotriene C4 biosynthesis and leukotriene C4-stimulated choleresis in isolated rat liver. Gastroenterology 1995;108:1793–801. [DOI] [PubMed] [Google Scholar]
- 14.Gores GJ, Kost LJ, LaRusso NF. The isolated perfused rat liver: Conceptual and practical considerations. Hepatology 1986;6:511–17. [DOI] [PubMed] [Google Scholar]
- 15.Eberle D, Clarke R, Kaplowitz N. Rapid oxidation in vitro of endogenous and exogenous glutathione in bile of rats. J Biol Chem 1981;256:2115–17. [PubMed] [Google Scholar]
- 16.Tietze F. Enzymic method for quantitative determination of nanogram amounts of total and oxidized glutathione: Applications to mammalian blood and other tissues. Anal Biochem 1969;27:502–22. [DOI] [PubMed] [Google Scholar]
- 17.Seelig GF, Meister A. Glutathione biosynthesis; γ-Glutamylcysteine synthetase from rat kidney. Methods Enzymol 1985;113:379–90. [DOI] [PubMed] [Google Scholar]
- 18.Orsonneau JL, Douet P, Massoubre C, et al. An improved pyrogallol red-molybdate method for determining total urinary protein. Clin Chem 1989;35:2233–6. [PubMed] [Google Scholar]
- 19.Martín Duce A, Ortiz P, Cabrero C, et al. S-Adenosyl-L-methionine synthetase and phospholipid methyltransferase are inhibited in human cirrhosis. Hepatology 1988;8:65–8. [DOI] [PubMed] [Google Scholar]
- 20.Cabrero C, Puerta J, Alemany S. Purification and comparison of two forms of S-adenosyl-L-methionine synthetase from rat liver. Eur J Biochem 1987;170:299–304. [DOI] [PubMed] [Google Scholar]
- 21.Chomczynski P, Sacchi N. Single-step method of RNA isolation by acid guanidinium thiocyanate-phenol-chloroform extraction. Anal Biochem 1987;162:156–9. [DOI] [PubMed] [Google Scholar]
- 22.Thomas PS. Hybridization of denatured RNA and small DNA fragments transferred to nitrocellulose. Proc Natl Acad Sci USA 1980;77:5201–5. [DOI] [PMC free article] [PubMed] [Google Scholar]
- 23.Alvarez L, Asunción M, Corrales F, et al. Analysis of the 5` non-coding region of rat liver S-adenosylmethionine synthetase mRNA and comparison of the Mr deduced from the cDNA sequence and the purified enzyme. FEBS Lett 1991;290:142–6. [DOI] [PubMed] [Google Scholar]
- 24.Xie QW, Calaycay J, Mumford RA, et al. Cloning and characterization of inducible nitric oxide synthase from mouse macrophages. Science 1992;256:225–8. [DOI] [PubMed] [Google Scholar]
- 25.Levi A, Elridge JD, Patterson BM. Molecular cloning of a gene sequence regulated by nerve growth factor. Science 1985;229:393–5. [DOI] [PubMed] [Google Scholar]
- 26.Bradford MM. A rapid and sensitive method for the quantitation of microgram quantities of protein utilizing the principle of protein dye binding. Anal Biochem 1975;72:248–54. [DOI] [PubMed] [Google Scholar]
- 27.Mingorance J, Álvarez L, Sánchez-Góngora E, et al. Site-directed mutagenesis of rat liver S-adenosylmethionine synthetase—Identification of a cysteine residue critical for the oligomeric state. Biochem J 1996;315:761–6. [DOI] [PMC free article] [PubMed] [Google Scholar]
- 28.Miller RG. Simultaneous statistical inference, 2nd edn. New York: Springer-Verlag, 1981.
- 29.Sugano T, Suda K, Shimada M, et al. Biochemical and ultrastructural evaluation of isolated rat liver systems perfused with a hemoglobin-free medium. J Biochem 1978;83:995–1007. [DOI] [PubMed] [Google Scholar]
- 30.Ávila MA, Mingorance J, Martínez-Chantar ML, et al. Regulation of rat liver S-adenosylmethionine synthetase during septic shock: role of nitric oxide. Hepatology 1997;25:391–6. [DOI] [PubMed] [Google Scholar]
- 31.Sánchez-Góngora E, Ruiz F, Wei A, et al. Interaction of liver methionine adenosyltransferase with hydroxyl radical. FASEB J 1997;11:1013–19. [DOI] [PubMed] [Google Scholar]
- 32.Hofmann AF. Bile acid secretion, bile flow and biliary lipid secretion in humans. Hepatology 1990;12:17–25S. [PubMed] [Google Scholar]
- 33.Speisky H, Shackel N, Varghese G, et al. Role of hepatic γ-glutamyltransferase in the degradation of circulating glutathione: Studies in the intact guinea pig perfused liver. Hepatology 1990;11:843–9. [DOI] [PubMed] [Google Scholar]
- 34.Gardell SJ, Tate SS. Effects of bile acids and their glycine conjugates on γ-glutamyl transpeptidase. J Biol Chem 1983;258:6198–201. [PubMed] [Google Scholar]
- 35.Abbott WA, Meister A. Modulation of gamma-glutamyl transpeptidase activity by bile acids. J Biol Chem 1983;258:6193–7. [PubMed] [Google Scholar]
- 36.Corrales F, Ochoa P, Rivas C, et al. Inhibition of glutathione synthesis in the liver leads to S-adenosyl-L-methionine synthetase reduction. Hepatology 1991;14:528–33. [PubMed] [Google Scholar]
- 37.Mitsuyoshi H, Nakashima T, Sumida Y, et al. Ursodeoxycholic acid protects hepatocytes against oxidative injury via induction of antioxidants. Biochem Biophys Res Commun 1999;263:537–42. [DOI] [PubMed] [Google Scholar]
- 38.Heuman DM, Bajaj RS, Lin Q. Adsorption of mixtures of bile salt taurine conjugates to lecithin-cholesterol membranes: implications for bile salt toxicity and cytoprotection. J Lipid Res 1996;37:562–73. [PubMed] [Google Scholar]
- 39.Beuers U, Boyer JL, Paumgartner G. Ursodeoxycholic acid in cholestasis: Potential mechanisms of action and therapeutic applications. Hepatology 1998;28:1449–53. [DOI] [PubMed] [Google Scholar]
- 40.Bray GP, Tredger JM, Williams R. S-adenosylmethionine protects against acetaminophen hepatotoxicity in two mouse models. Hepatology 1992;15:297–301. [DOI] [PubMed] [Google Scholar]
- 41.Osman E, Owen JS, Burroughs AK. Review article: S-adenosyl-L-methionine—a new therapeutic agent in liver disease? Aliment Pharmacol Ther 1993;7:21–8. [DOI] [PubMed] [Google Scholar]
- 42.Stramentinoli G, Gualano M, Ideo G. Protective role of S-adenosyl-L-methionine on liver injury induced by D-galactosamine in rats. Biochem Pharmacol 1978;27:1431–3. [DOI] [PubMed] [Google Scholar]
- 43.Boelsterli UA, Rakhit G, Balazs T. Modulation by S-adenosyl-L-methionine of hepatic Na+, K+-ATPase, membrane fluidity, and bile flow in rats with ethinyl estradiol-induced cholestasis. Hepatology 1983;3:12–17. [DOI] [PubMed] [Google Scholar]
- 44.Gasso M, Rubio M, Varela G, et al. Effects of S-adenosylmethionine on lipid peroxidation and liver fibrogenesis in carbon tetrachloride-induced cirrhosis. J Hepatol 1996;25:200–5. [DOI] [PubMed] [Google Scholar]
- 45.Cincu R, Rodríguez-Ortigosa CM, Vesperinas I, et al. S-Adenosyl-L-methionine protects the liver against the cholestatic, cytotoxic, and vasoactive effects of leukotriene D4: a study with isolated and perfused rat liver. Hepatology 1997;26:330–5. [DOI] [PubMed] [Google Scholar]


