Abstract
The limitations of conventional dosimeters restrict the comprehensiveness of verification that can be performed for advanced radiation treatments presenting an immediate and substantial problem for clinics attempting to implement these techniques. In essence, the rapid advances in the technology of radiation delivery have not been paralleled by corresponding advances in the ability to verify these treatments. Optical-CT gel-dosimetry is a relatively new technique with potential to address this imbalance by providing high resolution 3D dose maps in polymer and radiochromic gel dosimeters. We have constructed a 1st generation optical-CT scanner capable of high resolution 3D dosimetry and applied it to a number of simple and increasingly complex dose distributions including intensity-modulated-radiation-therapy (IMRT). Prior to application to IMRT, the robustness of optical-CT gel dosimetry was investigated on geometry and variable attenuation phantoms. Physical techniques and image processing methods were developed to minimize deleterious effects of refraction, reflection, and scattered laser light. Here we present results of investigations into achieving accurate high-resolution 3D dosimetry with optical-CT, and show clinical examples of 3D IMRT dosimetry verification. In conclusion, optical-CT gel dosimetry can provide high resolution 3D dose maps that greatly facilitate comprehensive verification of complex 3D radiation treatments. Good agreement was observed at high dose levels (>50%) between planned and measured dose distributions. Some systematic discrepancies were observed however (rms discrepancy 3% at high dose levels) indicating further work is required to eliminate confounding factors presently compromising the accuracy of optical-CT 3D gel-dosimetry.
Keywords: dosimetry, 3D, optical, imaging, computed tomography
1. INTRODUCTION
Historically, the majority of 3D gel dosimetry has been accomplished utilizing MR imaging to determine the 3D dose recorded in gels 1. MRI gel dosimetry has the advantage of versatility due to inherent compatibility with imaging dose-induced changes in relaxivity in a wide range of phantom shapes and volumes, and even phantoms with inserts of variable electron densities that simulate inhomogenieties. While MRI gel dosimetry will continue to thrive by virtue of these benefits, a role is now emerging for an alternative method of imaging dose induced optical changes in gels. Interestingly several of the same gel formulations (e.g. polymer gels and fricke gels) can be read by both imaging modalities. To date several investigators have developed laser based optical-CT scanning devices for 3D dosimetry 2,3,4. The primary advantages of the optical-CT technique are, on one hand ease of access, convenience and relatively low cost, and on the other high signal to noise at high spatial resolution. Restricted access to MR imaging time at our hospital led us to develop a laser-based optical-CT scanning system in our laboratory with the capability for high resolution 3D dosimetry. Here we present initial clinical tests of the system starting from simple irradiations and progressing to verification of complex IMRT prostate treatment.
Prior to the application of the optical-CT scanner to complex clinical IMRT verification, an extensive series of tests were performed to investigate potential geometric distortion, and inaccurate reconstruction of optical attenuation coefficients through a variety of potential optical artifacts including reflection, refraction, scatter, and instrumental effects such as electronic and laser drift. This basic characterization of the performance of the scanner ** showed that relative 3D dose mapping with accuracy ≥96% at a spatial resolution of 1mm3 was a feasible goal. The main body of this work was conducted not on gel-dosimeters but on unirradiated control gels where precise optical attenuation and geometric patterns could be established 5,6. Here we extend the progression of that work to include application of the scanner to verification in gel-dosimeters of simple single beam irradiations, and half-beam block ‘slab’ irradiations, and finally to complex IMRT verification.
2. METHODOLGY
An optical-CT scanner was designed and built based on the 1st generation scanning laser model proposed by Gore et al 4. Several differences in basic scanner design were incorporated in the scanner shown in figure 1. Notably the gel flask is suspended vertically from above, facilitating an accurate aquarium correction as the laser scans consistently the same plane through the aquarium while the gel-flask moves within. In addition, artificial asymmetries in projection profiles were minimized by eliminating optical components with sensitivity to small deviations in angle of incident light, and by mounting the field photodiode on the traveling (scanning) arm such that the similar optical path-length was maintained between the gel-dosimeter and the field photodiode. The motion control and data acquisition components were rebuilt using commercial hardware (National Instruments1, controller PXI-7344, driver MID7604, and data-acquisition PXI-6052 – 16bit 333 kS/s). Data acquisition and motion control was combined in a Labview 7 express software.
Figure 1.
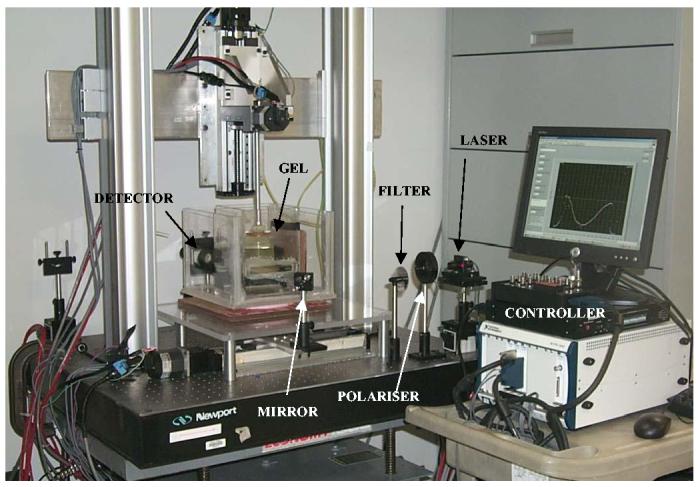
1st generation scanning laser optical-CT scanning system. The horizontal linear stage translates the mirror (and hence laser beam) across the gel flask inside aquarium containing optically matched fluid to minimize refraction at the flask edges. A second vertical linear stage supports a rotation stage which suspends the gel-flask in the aquarium via an aluminum mounting post
2.1 Optical-CT acquisition
Optical-CT acquisition proceeds in a tomographic manner, where the laser is scanned across the aquarium (containing stationary gel-flask) and the amount of transmitted laser light is measured using a photodiode detector. On completion of a full projection, the flask incrementally rotates and the laser scans back across the aquarium to acquire data for the next projection. Successive projections are thus acquired until 360 degrees of rotation has been achieved. The gel-flask then moves vertically to maneuver the next plane of the gel into the scanning plane, for the acquisition process to repeat. A polariser was used to generate linearly polarized light incident on the aquarium and gel-flask in the vertical orientation, facilitating modeling of a refraction correction at the edges of the flask using the Fresnel equations. The attenuated light signal drop along a generic projection through aquarium and flask combination was matched to the dynamic range of the detector by addition of small quantities of ink to the optical matching fluid in the water bath. Significant care was required to eliminate all small air bubbles on the flask and the walls of the aquarium in the scanning plane as these create significant scattering artifacts. In addition significant light output variations were noted in the laser diode module correlating with small (2 degrees) temperature changes in air temperature. These variations were corrected for by extending the projection length past the edge of the flask into the water-bath where the attenuation was known to be constant with time.
2.2 Gel manufacture and phantoms
All the gel-dosimetry verifications presented here comprised of polymer ‘BANG’ radiation sensitive gels (available from MGS Research, Guilford, CT) contained within 3ltr volume barex cylindrical flasks of dimensions 17cm diameter, and 12cm height (available from CIRS Inc Norfolk, VA). The significance of barex is its very low permeability to oxygen, a known de-sensitizing agent for polymer gels7. The gels were manufactured in a wet-lab in our institution from gel-kits purchased from MGS Research. The procedure involved melting an oxygenated pre-mixed gel-base containing gelatin, water and methacrylic acid, and adding an activating ingredient (hydrazine - oxygen scavenger). The gel was thoroughly mixed after addition of the oxygen scavenger, before being poured into the cylindrical gel-flask. The gel-dosimeter was then cooled in the fridge to 4 degrees and allowed to settle for 48hours. At the end of this period the gel is active, in the sense that it is radiation sensitive by virtue of the removal of free oxygen by the hydrazine. The gel remains useable provided oxygen does not penetrate the flask in sufficient quantity to consume the remaining scavenger. Barex is known to be an effective barrier to oxygen, although in the present experiment we had some concern about preservation of integrity of barrier strength through the thermo-vacuum forming process that shapes the barex into the flask. To minimize potential for such effects the flasks were irradiated after the minimum 48 hours considered required for oxygen removal in the gel. Despite this precaution oxygen evidence for oxygen contamination was observed as outlined in next section.
2.3 Gel-dosimetry irradiation
Three identical CIRS 3ltr cylindrical flasks filled with BANG gel were irradiated with simple field geometries where the dosimetry was known to high precision. A fourth identical flask was irradiated with a five field IMRT plan. The first flask was treated as a calibration gel-flask, and was irradiated with six calibration beams delivered with circular radiosurgery collimators, orientated vertically upward through the base of the flask. Each beam was 6MV radiation and 2cm diameter, and maximal spacing between beams was implemented to minimize dosimetric cross-talk. Doses at the plane of maximum dose were evenly spaced throughout the range 0-150cGy which is the useable (linear) range of the gel. True dose estimates at 2 scanning planes (5cm and 10cm deep) were calculated using the commissioned beam data tables, making appropriate allowance for the equivalent thickness of the barex base and density of polymer gel (1.03).
The second and third gel-flasks were irradiated with simple single field deliveries. In the second flask, a single 10×10cm square field of 6MV radiation was oriented vertically upward through the base of the cylindrical flask, co-incident and centered on the central axis. No build up material was placed under or around the flask as the flask was sufficiently large to create full dose buildup throughout the irradiated and penumbral regions of the beam. The dosimetry of this field was independently measured by a diode array (Mapcheck available from Sun Nuclear Corp., Melbourne Fl) containing 445 detectors 8. The standard Mapcheck resolution is 0.7cm diagonal spacing in the central 10×10cm area, extending to 1.4cm diagonal spacing in the outer 10-20cm region. Each diode has a measurement area of 0.8×0.8mm. For independent verification of the gel-measured distribution a significantly greater resolution was required, and this was achieved by mounting the mapcheck on a computer controlled moving platform 9,10. A 16 fold increase in sampling was achieved by irradiating the mapcheck 16 times each with a 2mm shift in mapcheck position. The resulting composite mapcheck measurement represents sampling at 1.4mm diagonal spacing throughout the inner area of 10×10cm.
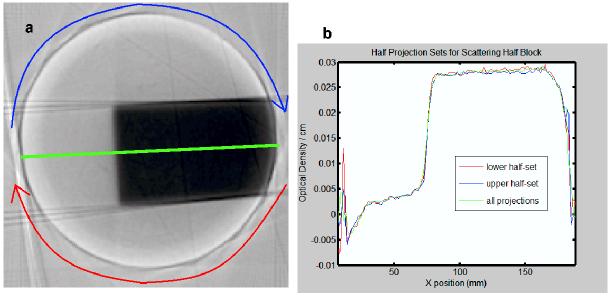
The third gel-flask was irradiated in similar manner (single beam vertically upward through the base), but this time the field was half-beam blocked to a 5×20cm rectangle with one short edge on the central axis of the flask and the other extending out into free air outside the flask. This ‘slab’ irradiation was chosen to generate interesting asymmetry in any potential light scattering conditions inside the gel, and more importantly to enable study of how well the dose was reconstructed out towards the walls of the flask where significant refraction artifacts were known to exist.
The final 4th flask was irradiated with a 5 field prostate IMRT treatment plan illustrated in figure 2. The plan represents an arbitrary prostate treatment that was being performed with routine prostate IMRT treatment. Each beam was 18MV radiation delivered in a step-and-shoot IMRT manner, and was created using the Pinnacle treatment planning system. The entire plan used to treat the patient was copied, without any changes to the segments and beams, and recalculated onto a CT scan dataset of the phantom. The IMRT plan was then delivered to the gel-dosimeter via an Elekta Linac. Three fiducial marks placed on the phantom, visible under both optical and x-ray CT scanning, enabled precise registration between the measured and planned dose distributions.
Figure 2.
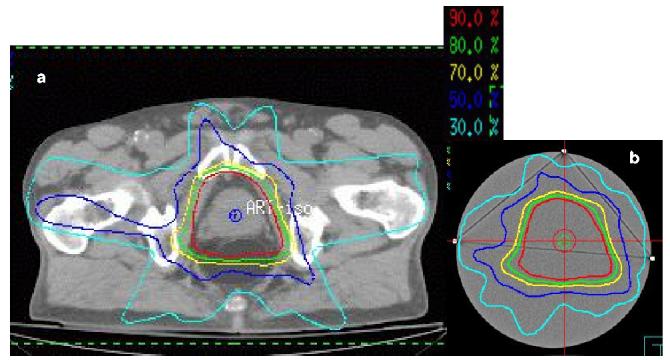
Pinnacle isodose distributions through a common slice from (a) the original prostate patient treatment plan (consisting of a 5 field IMRT Tx), and (b) recomputed isodoses of the same plan, with identical beam orientations and segments etc, for the 17cm diameter gel dosimeter.
After irradiation each flask was left overnight for full development of polymerization reactions, and then scanned in the optical-CT scanner. Acquisition parameters included 120 projections (1.5 deg increments) with 0.5mm steps along each projection. Slice spacing was 3mm in the complex IMRT verification, and scanning time was about 6mins per slice. The measured optical attenuation maps were converted to dose using a calibration curve (figure 3) obtained from irradiating and scanning the calibration gel-flask.
Figure 3.
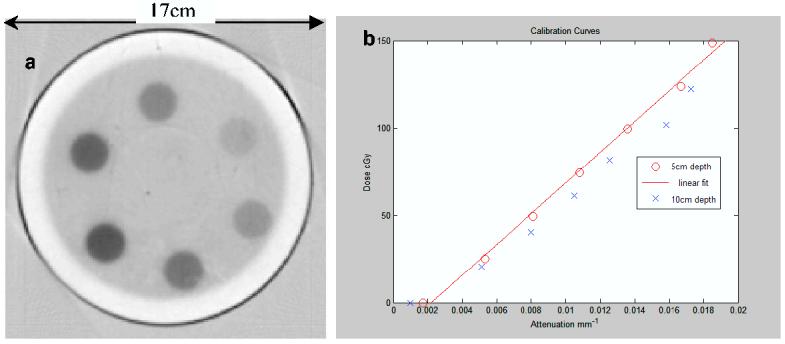
(a) optical-CT scan of axial slice through the calibration gel flask showing the 6 radiosurgery irradiations delivering doses in the range 0-1.5 Gy. (b) calibration curves for the same gel-flask relating reconstructed optical attenuation coefficients to calculated (known) delivered dose. The clear band of gel on the inside of the flask is attributed to localized oxygen contamination through the flask walls.
3. RESULTS
An optical-CT scan of two planes (5cm and 10cm depth) in the calibration gel-flask is shown in figure 3. A systematic under-response was observed in the deeper slice, and so the calibration fit line excluded this data. The probable explanation for this is oxygen contamination, which is also visible as the under-responding outer ring in the optical-CT image figure 3a. It seems clear that the barex flask walls were not as impermeable to oxygen as expected. We suspect that the apparent increase in oxygen permeability could be caused by weakening of the barrier properties of the barex in the thermo vacuum molding flask manufacturing process. An observation that supports this conclusion is that such oxygen permeation was not observed in smaller flasks (8cm diameter) where the degree of barex stretching is significantly less.
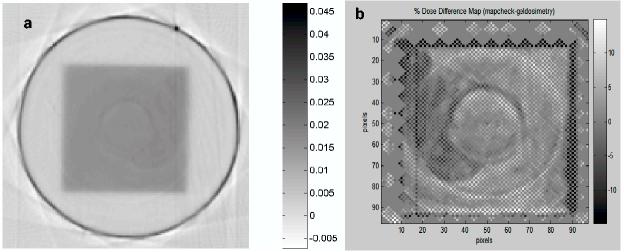
The unprocessed optical-CT scan of the central plane through the simple 10x10cm field is shown in figure 4. The outline of the square field irradiation is clearly discerned within the flask. Close inspection also reveals non-uniform low-scale structure inside the irradiated region and two circular ring artifact. The precise cause of the artifact remains under investigation.
Figure 4.
(a) Optical-CT scan of 5cm deep plane of the square field irradiation. (b) dose difference map of high resolution mapcheck – gel-measured distribution. Both data sets re-sampled onto the same grid.
The difference image of the high resolution mapcheck dose map and the gel-measured dose map is illustrated in figure 4b. The ring artifacts are highlighted in the difference map as are significant discrepancies in the penumbral regions. Further analysis of the composite mapcheck measurements showed, as expected, very uniform beam, no ring artifacts, and excellent matching with commissioning data. The discrepancies in figure 4b are therefore attributed either to imperfections in the optical-CT scanning or in non-uniform response of the gel-dosimeter. The root-mean-square difference is about 3% for the central 10×10cm region (excluding penumbra) indicating that the magnitude of discrepancies observed.
The optical-CT image of the slab irradiation is shown in figure 5a,b. Good uniformity of reconstruction along the flat beam is observed up until about 8mm close to the edge of the flask. Note the lack of oxygen contamination on the scale observed in figure 3a. This is attributed to removing oxygen trapped in the walls of the flask by flushing with oxygen scavenger prior to filling with gel. It is not established that this has completely prevented oxygen contamination at the edges of the flask, but it is demonstrated to reduce it.
Figure 5.
(a) optical-CT reconstruction of central slice through the slab irradiation. (b) reconstructed profiles (along central green line) from half projection data-sets. Red line corresponds to lower half of projections, blue line to upper.
The optical-CT reconstructed upper and lower central transverse planes through the IMRT distribution is shown in fig 6. Comparison orthogonal overlay isodose plots are shown in figure 7, and profile comparison is shown in figure 8. Close correlation and matching is observed for the higher isodose lines (above 50%). Below this systematic differences emerge indicating the gel is reporting shallower dose fall-off (higher dose) than the calculated distribution from Pinnacle planning system. The reason for the discrepancies at lower doses remains under investigation.
Figure 6.
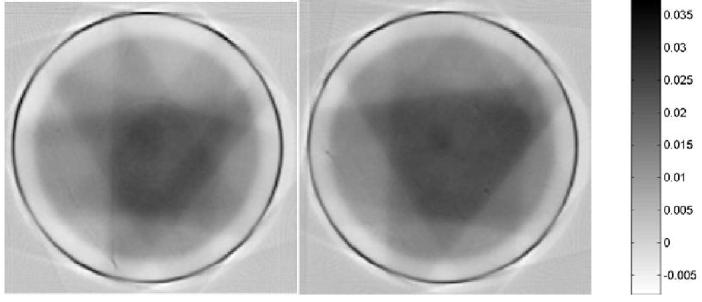
optical-CT reconstructed images through IMRT dose distribution
Figure 7.
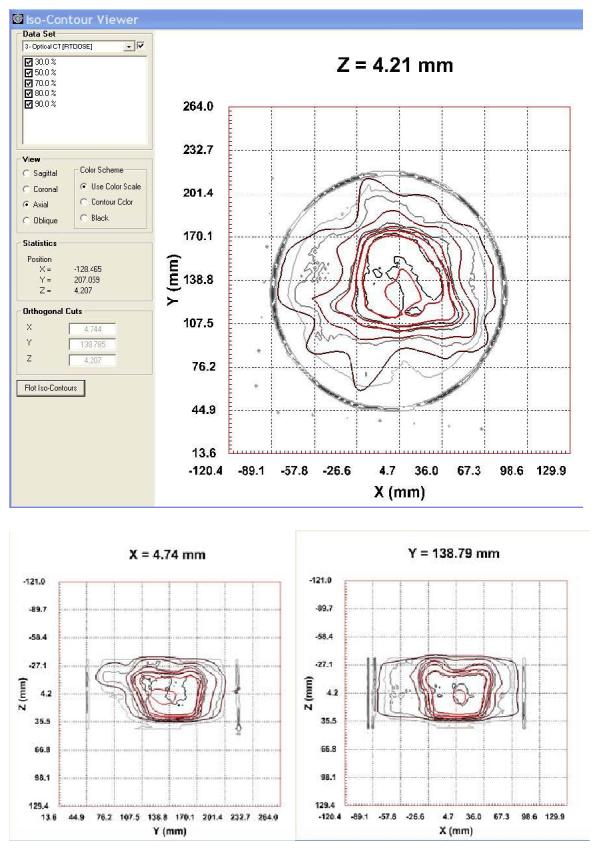
orthogonal isodose overlay plots of the measured (black lines) and calculated (red lines) for the 5 field IMRT prostate dose distribution
Figure 8.
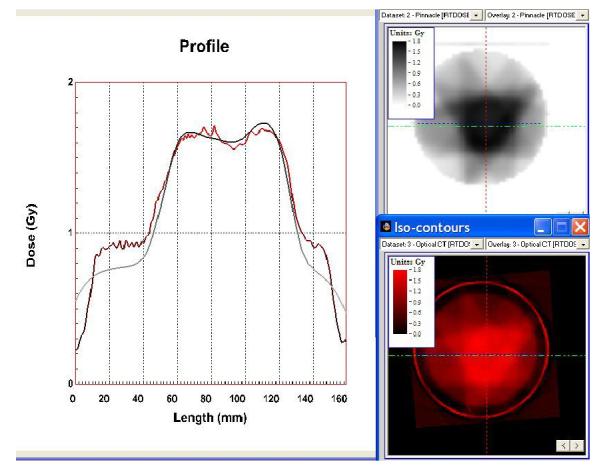
profiles through the calculated IMRT distribution (upper right) and the gel-measured distribution (lower right). The line of the profile is the horizontal green line in the right hand plots.
4. CONCLUSIONS
High resolution 3D gel dosimetry by optical-CT scanning provides a technique with unprecedented ability for the comprehensive verification of complex radiation treatments. Accurate 3D gel-dosimetry requires careful characterization of both the optical-CT scanner and the response of the gel. In the data presented here systematic differences (of rms magnitude 3%) were observed even for the simple single 10×10cm square field irradiation between the gel-measured and true values as determined by independent measurement and comparison to commissioning data. For complex IMRT distributions good isodose agreement was observed at high dose levels (>50%) with systematic discrepancies emerging at lower isodose lines. The slab irradiation demonstrated good integrity of reconstruction out to within about 8mm of the wall of the flask. In total, these measurements indicate that further work is required to identify and eliminate confounding factors compromising the accuracy of optical-CT 3D gel-dosimetry. The performance of the scanner when isolated from the gel-dosimeter has been found elsewhere to be satisfactory 5,11. This leads us to focus next efforts on improving the manufacture of the polymer gel dosimeters. In particular to alleviate the unexpected oxygen contamination in the larger flasks, and to improve uniformity of gel response through increased vigorosity of the mixing phase.
5. ACKNOWLEDGEMENTS
We are very grateful to Dr Gary Gluckman for providing DOSEQA software used in the analysis of the IMRT distribution, and to Dr Geoffrey Hugo providing the high resolution mapcheck measurements.
Footnotes
National Instruments, 11500 N Mopac Expwy, Austin, TX 78759-3504 (www.ni.com)
References
- 1.McJury M, Oldham, Cosgrove, Murphy, Doran, Webb Leach. Radiation dosimetry using polymer gels: methods and applications. Br.J Radiol. 2000;73:919–929. doi: 10.1259/bjr.73.873.11064643. [DOI] [PubMed] [Google Scholar]
- 2.Oldham M, Siewerdsen, Jaffray Shetty. High resolution gel-dosimetry by optical-CT and MR scanning. Med Phys. 2001;28:1436–1445. doi: 10.1118/1.1380430. [DOI] [PubMed] [Google Scholar]
- 3.Kelly BG, Battista Jordan. Optical CT reconstruction of 3D dose distributions using the ferrous-benzoic-xylenol (FBX) gel dosimeter. Med Phys. 1998;25:1741–1750. doi: 10.1118/1.598356. [DOI] [PubMed] [Google Scholar]
- 4.Gore JC, Ranade, Schulz Maryanski. Radiation dose distributions in three dimensions from tomographic optical density scanning of polymer gels: I. Development of an optical scanner. Phys.Med Biol. 1996;41:2695–2704. doi: 10.1088/0031-9155/41/12/009. [DOI] [PubMed] [Google Scholar]
- 5.Oldham M, Kim Optical-CT gel-dosimetry. II: Optical artifacts and geometrical distortion. Med Phys. 2004;31:1093–1104. doi: 10.1118/1.1655710. [DOI] [PMC free article] [PubMed] [Google Scholar]
- 6.Oldham M, Siewerdsen, Kumar, Jaffray Wong. Optical-CT gel-dosimetry I: basic investigations. Med Phys. 2003;30:623–634. doi: 10.1118/1.1559835. [DOI] [PMC free article] [PubMed] [Google Scholar]
- 7.Baldock C, Burford, Billingham, Wagner, Patval, Keevil Badawi. Experimental procedure for the manufacture and calibration of polyacrylamide gel (PAG) for magnetic resonance imaging (MRI) radiation dosimetry. Phys.Med Biol. 1998;43:695–702. doi: 10.1088/0031-9155/43/3/019. [DOI] [PubMed] [Google Scholar]
- 8.Letourneau D, Gulam, Yan, Wong Oldham. Evaluation of a 2D diode array for IMRT quality assurance. Radiother.Oncol. 2004;70:199–206. doi: 10.1016/j.radonc.2003.10.014. [DOI] [PubMed] [Google Scholar]
- 9.Hugo G, Belecciu, Letourneau, Wong Oldham. high resolution diode array dosimetry for IMRT commissioning: a feasibility study; XIV International Conference on the Use of Computers in Radiation Therapy; Soeul, Korea. 2004. [Google Scholar]
- 10.Hugo G, Belecciu, Wong Letourneau. Evaluation of a high-resolution diode array system for IMRT commissioning and verification. Medical Physics. 2004;31:1823–1823. [Google Scholar]
- 11.Oldham M, Siewerdsen, Kumar, Jaffray Wong. Optical-CT gel-dosimetry I: basic investigations. Med Phys. 2003;30:623–634. doi: 10.1118/1.1559835. [DOI] [PMC free article] [PubMed] [Google Scholar]


