Abstract
Background and aims: Fatigue is a frequent and disabling symptom reported by patients with chronic hepatitis C (CHC). Its mechanism is poorly understood. Recent attention has focused on the role of leptin and energy expenditure in CHC. Our aims were to analyse fatigue in CHC and to determine its relationship with disease activity, resting energy expenditure (REE), circulating leptin, and tumour necrosis factor α (TNF-α).
Methods: Seventy eight CHC patients, 22 healthy controls, and 13 primary biliary cirrhosis (PBC) patients underwent measurements of REE, body composition, leptin, and TNF-α. All subjects completed the fatigue impact scale (FIS) questionnaire. A liver biopsy and viral load measurements were performed in all patients.
Results: Thirty eight of 78 CHC patients considered fatigue the worst or initial symptom of their disease. The fatigue score of patients was significantly higher than that of controls (53.2 (40.1) v 17.7 (16.9); p<0.0001) and was more pronounced in females (p=0.003). Leptin was increased significantly in CHC patients compared with controls (15.4 (20.7) v 6.4 (4.1) ng/ml; p<0.05). In CHC patients, the fatigue score correlated significantly with leptin corrected for fat mass (r=0.30, p=0.01). This correlation increased when the physical domain of fatigue was included (r=0.39, p=0.0009). Furthermore, a similar positive correlation was found in PBC patients (r=0.56, p=0.04). No correlation was found between fatigue and age, REE, liver function tests, viral load, or the METAVIR score in CHC patients.
Conclusions: Fatigue is present in CHC patients and is more pronounced in females. The FIS questionnaire is clinically relevant and may be useful for future therapeutic trials aimed at reducing fatigue. Fatigue may be partly mediated by leptin.
Keywords: fatigue, chronic hepatitis C, leptin
Fatigue is one of the most common complaints of patients with chronic hepatitis C (CHC).1 Despite its significance as a crucial issue for health care in CHC, few studies have investigated this symptom. One of the major obstacles to research is the highly non-specific nature of fatigue. Accordingly, all experimental approaches have been hampered by the lack of any serious objective tools to assess the subjective experience of fatigue. In 1994, the fatigue impact scale (FIS) was developed to improve our understanding of the effects of fatigue on quality of life.2 Its use in chronic liver diseases has confirmed the disabling effect of fatigue in patients with primary biliary cirrhosis (PBC)3 and hepatitis C.4
It is not known what causes fatigue in patients with liver diseases. As described by Swain and Maric5 in animal models, three major central changes have been implicated; (i) neuroendocrine causes, with abnormal function of the hypothalamic-pituitary-adrenal axis; (ii) abnormalities in neurotransmission, particularly in the central serotonin pathway; and (iii) alterations in immune activation and cytokine release.
In CHC patients, we recently demonstrated that resting energy expenditure adjusted for fat free mass (REE/FFM) was increased, and that antiviral therapy was effective in normalising this hypermetabolism.6 We therefore hypothesised that this hypermetabolic state might participate in the behavioural changes (that is, fatigue) commonly observed in CHC.
The importance of leptin in the regulation of energy balance, body composition, and food intake has been demonstrated in both animal and human studies.7–9 To date however few studies have analysed leptin in liver diseases. In cirrhosis, which is often associated with hypermetabolism,10 leptin levels depend on the cause of liver fibrosis; levels are elevated in alcoholic patients11–14 and decreased in those with chronic hepatitis.15 In contrast, CHC patients exhibit low serum leptin levels, even when corrected for fat mass.16 Whether or not leptin contributes to CHC related fatigue is still not known.
The monokine tumour necrosis factor α (TNF-α) is one of the major secretogogues of leptin.17 This proinflammatory cytokine has been associated with hypermetabolic/catabolic disturbances in several conditions,18 and plays an important role in the pathogenesis of chronic liver diseases.19,20 Increased cytokine production has also been related to fatigue in various conditions.21–23 However, Gershon et al failed to detect any relationship between fatigue and TNF-α levels in patients with CHC.24
We therefore designed a prospective study to evaluate fatigue in patients with CHC using the FIS questionnaire, and to determine the relationship between fatigue and the severity of liver disease, REE, serum leptin, and TNF-α levels.
METHODS
Subjects
Seventy eight consecutive patients admitted to our liver unit for compensated liver disease due to CHC were included in the study. The diagnosis of CHC was based on the association of: (a) elevation of serum alanine aminotransferase (ALT) above 40 U/l (upper normal limit) for six months or longer, (b) presence of anti-hepatitis C virus (HCV) antibodies, (c) presence of HCV viraemia, and (d) exclusion of other causes of chronic liver disease (alcoholism, chronic hepatitis B, Wilson's disease, hepatotoxic drugs, haemochromatosis, α1 antitrypsin deficiency, autoimmune chronic active hepatitis). A liver biopsy was performed in all patients, none of whom was cirrhotic. These patients had no evidence of dehydration or overhydration or any other acute or chronic disease suspected of causing hypermetabolism (including human immunodeficiency virus). Furthermore, none had renal failure, thyroid disease, or clinically apparent depression, and none was treated with beta blockers or had received antiviral therapy.
Twenty two healthy volunteers formed the control group. These subjects were considered normal on the basis of history, physical examination, and biochemical blood screening (normal transaminase activity, no antibodies for HCV or human immunodeficiency virus, and negative hepatitis B surface antigen). There were no differences between patients and controls for age, sex, or body mass index (BMI). The characteristics of the CHC patients and controls are presented in table 1 ▶.
Table 1.
Characteristics of the study population
| Female | Male | |||
| Variable | Patients (n=34) | Controls (n=11) | Patients (n=44) | Controls (n=11) |
| Age (y) | 42.5 (12.6) | 37.4 (13.2) | 40.0 (10.1) | 41.0 (15.1) |
| BMI (kg/m2) | 24.6 (5.2) | 21.0 (5.2) | 23.8 (4.0) | 23.2 (2.0) |
| Body weight (kg) | 65.3 (17.3) | 56.9 (6.1) | 73.6 (14.4) | 68.3 (8.0) |
| FFM (kg) | 41.9 (9.2) | 42.8 (6.2) | 55.4 (9.8) | 55.7 (6.6) |
| FM (kg) | 23.3 (9.8)** | 14.1 (2.3) | 18.3 (8.7)* | 12.6 (4.4) |
| ALT (U/l) | 69.0 (59.5)** | 10.0 (3.6) | 106.9 (68.0)** | 20.3 (1.38) |
| Viral load (106copies/ml) | 11.7 (14.4) | — | 10.3 (13.1) | — |
| METAVIR (range 0–3) | ||||
| Activity index | 1.0 (0.5) | — | 1.0 (0.6) | — |
| Fibrosis index | 1.3 (1.0) | — | 1.4 (1.0) | — |
BMI, body mass index; FFM, fat free mass; FM, fat mass; ALT, alanine aminotransferase.
*p<0.05; **p<0.01 versus controls.
—, data not evaluated.
Thirteen well compensated non-cirrhotic patients with PBC were also included in this study (nine females, four males; mean age 63.8 (11.7) years). The diagnosis of PBC was established according to the following criteria: antimitochondrial antibody positivity; chronic cholestatic liver disease of at least six months' duration; and liver biopsy specimen compatible with a diagnosis of PBC. No patient had thyroid dysfunction and all were receiving ursodeoxycholic acid treatment (13–15 mg/kg/day).
All clinical studies were performed according to the Declaration of Helsinki, and all subjects gave written informed consent.
Virological evaluation
Anti-HCV antibodies were detected by two third generation enzyme immunoassays (HCV EIA 3.0, Abbott Laboratories, North Chicago, Illinois, USA and Ortho HCV 3.0 ELISA test, Ortho-Clinical Diagnostics, Raritan, New Jersey, USA). HCV-RNA was detected in sera by a reverse transcription-polymerase chain reaction method (Amplicor; Roche Diagnostic Systems, Branchburg, New Jersey, USA). Levels of viraemia were determined by a branched DNA technique (Quantiplex HCV RNA 2.0 Assay BDNA; Chiron, Emeryville, California, USA). Liver biopsy specimens were fixed in Bouin's solution and embedded in paraffin for routine staining with haematoxylin-eosin-saffron. All specimens were examined by the same pathologist and were evaluated by a previously validated scoring system, the METAVIR score.25
Assessment of fatigue
The impact of fatigue on quality of life was measured by the FIS, previously validated by Fisk and colleagues.2 The questionnaire was translated into French by Huet and colleagues,3 and has been used to compare fatigue in patients with PBC and healthy blood donors in Montreal. FIS is a self administered questionnaire consisting of 40 statements that describe possible manifestations of fatigue; these statements are classed into three health categories (cognitive (n=10), physical (n=10), and psychosocial (n=20)). Each item is rated on a five point scale of distress, ranging from 0 (“no problem”) to 4 (“extreme problem”) with a maximum of 160 points. FIS also includes a visual analogue scale allowing evaluation of the “disabling effect” of fatigue on a scale of 1 (“no disabling effect”) to 10 (“severe disabling effect”). Both patients and controls agreed to answer the FIS questionnaire after receiving counselling from one of the authors (EG). Questionnaires were completed at the clinic one week before clinical investigations.
Resting energy expenditure and body composition
REE was measured in the Functional Explorations Unit of Archet Hospital in the morning, after a 12 hour overnight fast. Participants were instructed to abstain from alcohol (including alcohol containing products and drugs) and smoking for 12 hours. After a 30 minute rest in the supine position, patients were placed in a semirecumbent position and measurements were taken using a ventilated hood open circuit indirect calorimeter (Deltatrac; Datex Instruments, Helsinki, Finland). After equilibrium was reached (10–20 minutes), respiratory exchanges were monitored continuously over a 30 minute period; data were obtained every minute and averaged over the 30 minutes. The system was checked weekly by burning ethanol under standard conditions, and calibrated immediately before each measurement with two standard gases. REE was calculated from the oxygen consumption rate and carbon dioxide production rate, using the modified Weir formula26 and was expressed in kilocalories per 24 hours. REE was also expressed as a ratio of FFM (REE/FFM) in kilocalories per kilogram of FFM per 24 hours.
FFM was measured by bipolar bioelectrical impedance analysis with an alternating electric current (50 μA) at two frequencies: 1 MHz and 5 kHz, as previously described and validated by Boulier and colleagues.27 The portable impedance analyser (IMP BO 1; L'impulsion, Caen, France) was equipped with a microprocessor; a computer was used to calculate impedance and body composition. Measurements were taken in the morning under the conditions described below. Subjects had been supine for 30 minutes, arms relaxed at the sides but not touching the body. Two stainless steel needles were inserted subcutaneously: one on the anterointernal side of the foot, the other in the first intermetacarpal space of the dorsal aspect of the contralateral hand. FFM and fat mass (FM) were expressed in kilograms.
Leptin and TNF-α assays
Serum samples were stored at −80°C until assayed; all assays were performed in duplicate. Serum leptin levels were measured using a specific radioimmunoassay for human leptin (Linco Research, St Charles, Missouri, USA) with a limit of detection of 0.5 ng/ml. Serum TNF-α concentrations were determined by a highly sensitive quantitative immunoassay (R&D Systems, Minneapolis, Minnesota, USA) which is linear to 32 pg/ml and has a sensitivity of 0.18 pg/ml. For both leptin and TNF-α, intra- and interassay coefficients of variation were less than 8%.
Statistical analysis
Quantitative data are expressed as mean (SD) and were compared using the Mann-Whitney U test and Kruskal-Wallis test. The χ2 test was used to compare qualitative data. Relationships between fatigue score, and the visual analogue scale, age, leptin, TNF-α, viral load, transaminase activity, and METAVIR score were evaluated by linear regression analysis. A p value <0.05 was considered significant.
RESULTS
Characteristics of the study population
Due to the sex dependency of fatigue, REE, body composition, and serum leptin levels, patients with CHC and controls were divided into two groups (males and females).
Evaluation of fatigue
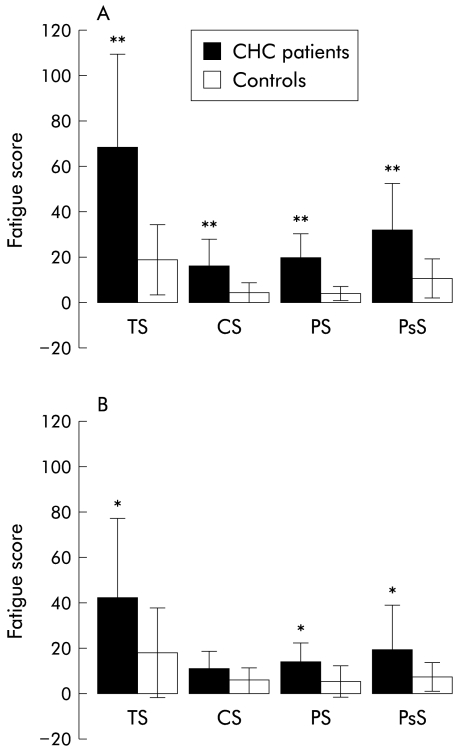
Thirty eight of the 78 patients with CHC (47.8%) considered fatigue the worst or initial symptom of their disease. The total fatigue score of patients with CHC was significantly higher than in controls (53.2 (40.1) v 17.7 (16.9); p<0.0001). A significant difference was also noted for each subscale compared with controls (fig 1 ▶). Fatigue in patients with CHC was significantly more pronounced in females than in males (68.2 (41.2) v 41.6 (35.6); p=0.003), and this difference remained significant for each subscale (fig 1 ▶). A significant correlation was observed between the total fatigue score and the visual analogue scale used to rate the disabling effect of fatigue (r=0.83, p<0.0001). The severity of fatigue in patients with CHC was similar to that in PBC (49.4 (32.3)).
Figure 1.
Fatigue in chronic hepatitis C (CHC). TS, total score; CS, cognitive score; PS, physical score; PsS, psychosocial score. (A) Comparison between female patients and controls. (B) Comparison between male patients and controls. *p<0.05, **p<0.01.
Energy expenditure
REE/FFM was significantly increased in patients with CHC compared with controls (32.4 (5.1) v 28.0 (3.3) kcal/kg FFM/24 hours; p<0.0001). Females were more hypermetabolic than males (34.0 (5.4) v 31.2 (4.6) kcal/kg FFM/24 hours; p=0.02). REE/FFM was similar in patients with PBC (29.9 (4.5)) and CHC.
Leptin levels
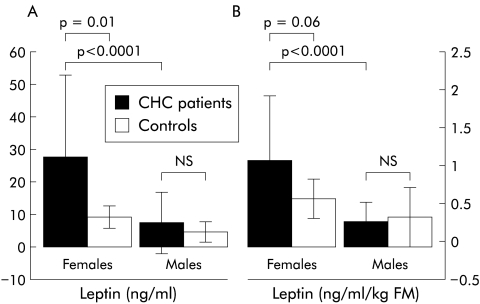
Mean fasting serum leptin level was significantly higher in patients with CHC than in controls (15.4 (20.7) v 6.4 (4.1) ng/ml; p<0.05). Figure 2 ▶ shows serum leptin levels expressed as both absolute values and after adjustment per kilogram of FM. Absolute leptin levels were significantly higher in females than in males both in patients and controls (p<0.0001 and p<0.001, respectively). When corrected for FM, leptin levels were significantly higher in patients with CHC (p<0.0001) but not in controls (p=0.09). Compared with controls, absolute leptin values were significantly increased in females (27.4 (25.0) v 8.7 (3.6) ng/ml; p=0.01) but not in males (6.9 (9.5) v 4.1 (3.2) ng/ml; NS). When expressed per kilogram of FM, leptin levels were increased in females (1.1 (0.8) v 0.6 (0.2) ng/ml/kg) but the difference was not statistically significant (p=0.06). No difference was observed in males (0.3 (0.2) v 0.3 (0.3) ng/ml/kg). Leptin adjusted for FM was significantly higher in PBC patients compared with CHC patients (1.3 (1.2) v 0.7 (0.7) ng/ml/kg; p=0.02).
Figure 2.
Absolute leptin levels (A) and leptin levels corrected for fat mass (FM) (B) in female and male patients with chronic hepatitis C (CHC) and controls.
TNF levels
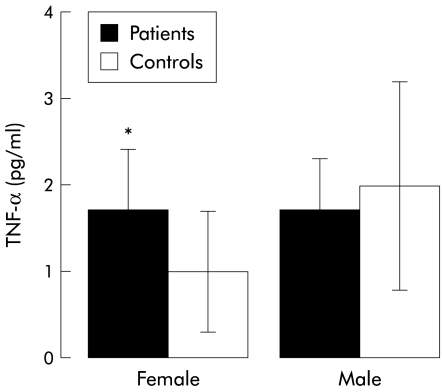
Serum TNF-α was similar in patients with CHC and controls (1.7 (1.6) v 1.6 (1.7) pg/ml; NS). In females, but not in males, serum TNF-α levels were significantly higher in patients with CHC compared with controls (1.7 (0.7) v 1.0 (0.7) pg/ml in females (p=0.03); 1.7 (0.6) v 2.0 (1.2) pg/ml in males (NS)) (fig 3 ▶). Serum TNF-α was significantly higher in PBC patients (3.4 (1.7) pg/ml) compared with both patients with CHC and controls (p<0.01).
Figure 3.
Comparison of serum tumour necrosis factor α (TNF-α) levels in male and female patients with chronic hepatitis C (CHC) and controls. *p=0.03.
Correlation analysis
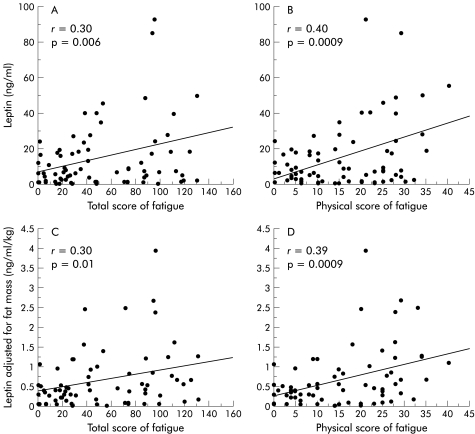
Leptin levels were correlated with FM in both female and male patients with CHC (r=0.64, p<0.0001; r=0.73, p<0.0001, respectively). In patients with CHC, the total fatigue score was significantly correlated with leptin levels both when expressed as absolute values (r=0.30, p=0.006) and after correction for FM (r=0.30, p=0.01). The correlation was more pronounced for the physical domain of fatigue (r=0.40, p=0.0003 with leptin; r=0.39, p=0.0009 with leptin corrected for FM) (fig 4 ▶). Fatigue (and each subscale) was not correlated with age, weight, BMI, REE/FFM, or FM, or with standard liver function tests (bilirubin, ALT, aspartate aminotransferase, prothrombin index), viral load, or METAVIR score.
Figure 4.
Relationship between leptin and fatigue in chronic hepatitis C patients. Correlation between absolute leptin levels and total score of fatigue (A) and its physical domain (B). Correlation between leptin levels corrected for fat mass and the total score of fatigue (C) and its physical domain (D).
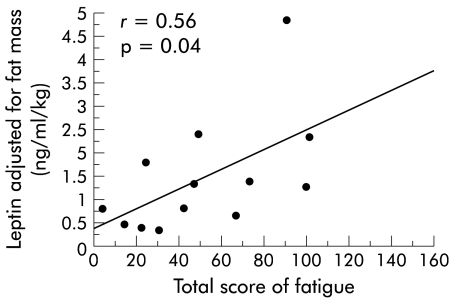
In PBC patients, a significant positive correlation (r=0.56, p=0.04) was found between the total score of fatigue and leptin corrected for FM (fig 5 ▶).
Figure 5.
Correlation between leptin levels corrected for fat mass and the total score of fatigue in primary biliary cirrhosis patients.
DISCUSSION
Fatigue is a common and disabling symptom of CHC1,28 that impairs the quality of life of infected patients.29 However, its pathogenesis has been poorly investigated. Our findings confirm that fatigue is a major complaint in patients with CHC and has a negative impact on their quality of life. We also suggest that leptin may be implicated in the pathogenesis of fatigue in CHC and that this mechanism may be sex dependent.
Quantification of fatigue is difficult. In the present study, this subjective symptom was assessed using a validated 40 item self administered questionnaire (FIS).2 This questionnaire was translated into French, and has been validated in a cohort of patients with PBC.3 This method allows evaluation of the perceived impact of fatigue on patients' lives, the factors that affect patients' perceptions of fatigue, and the affect of fatigue on the mental and general health of patients. Determination of the effect of fatigue on activities is a more sensitive method than simply asking patients to rate fatigue. Our findings are in accordance with those recently reported by Hassoun and colleagues30 who used the same French translation of the questionnaire in CHC patients. As expected, the degree of fatigue was markedly increased in CHC patients compared with healthy controls; this difference was noted in all three domains exploring quality of life (cognitive, physical, and psychosocial). In our study, the severity of fatigue, as evaluated by the FIS questionnaire (53.2 (40.1)), was comparable with that observed in patients with PBC3 but less than that reported in patients with multiple sclerosis (62.8 (36.3)) or the chronic fatigue syndrome (94.2 (28.1)).2 In contrast with the findings of Hassoun and colleagues,30 we found fatigue to be more severe in female than male patients with CHC.
In common with previous authors,4,30–32 we failed to find any relationship between fatigue and the degree of underlying hepatitis, including transaminase activity, prothrombin index, and bilirubin. Moreover, neither the level of viral load nor the degree of liver inflammation or fibrosis were correlated with the severity of symptoms.
It is well established that fatigued patients have psychometric scores suggestive of both depression and/or somatic anxiety.33 Although this point was not specifically evaluated in our study, none of our patients with CHC had clinically apparent severe depression. Consistent with our previous findings,6 REE/FFM was increased in patients with CHC, and this hypermetabolism was more pronounced in female patients. However, we did not find any relationship between REE/FFM and fatigue (or each subscale), which indicates that hypermetabolism per se probably has little or no influence on the severity of fatigue in such patients.
Attention has recently been focused on the role of leptin in chronic liver diseases. In cirrhosis, leptin levels have been found to be increased in some cases11–14 but decreased in others.15 In patients with chronic viral hepatitis (without cirrhosis), absolute leptin levels and leptin corrected for FM have been found to be lower than in normal controls.16 In our CHC patients, absolute leptin levels were significantly increased in females compared with controls, and this increase tended to persist when leptin was corrected for FM (p=0.06). Possible reasons for the discrepancy with the findings of Testa et al are that their study population was heterogeneous (chronic hepatitis C and B) and the number of subjects in each group was relatively small. In agreement with previously reported data,11 we found leptin levels to be sex dependent. The higher serum leptin levels observed in female patients cannot be attributed solely to the higher FM in the female groups because leptin levels tended to be higher (p=0.06) in women even after correction for FM. A large sample size is probably necessary to further investigate this dichotomy. However, our data suggest that this sex dependency may be explained by activation of the TNF-α system, which has been recognised as one of the major secretogogues for leptin.17 Indeed, a significant increase in serum TNF-α levels was observed in our young female patients with CHC. We can also speculate on the possible sensitising effect of oestrogen on release of TNF-α.34 However, the absence of any correlation between TNF-α and leptin levels (data not shown) indicates that other secretogogues such as insulin, corticosteroids, or nitric oxide may interact with release of TNF-α.11 Furthermore, we did not measure the bound leptin isoform which has been related to the TNF-α system in symptomatic human immunodeficiency virus infection.35
Concerning the relationship between fatigue and circulating leptin, we found a slight positive correlation between fatigue (especially the physical domain) and circulating leptin levels, even after adjustment for FM. Both fatigue and leptin levels were higher in female patients with CHC. No correlation was found between fatigue and FM. We therefore suggest that leptin may at least partially contribute to fatigue in CHC patients. The higher FM in our CHC patients remains unclear. We can cautiously speculate on the possible role of a reduction in their physical activity due to chronic fatigue. However, this important observation of higher FM in CHC patients does not influence our findings and needs to be confirmed. An important question is whether the observed elevation in leptin in patients with CHC mediates this behavioural effect. The observation of the same correlation in PBC patients suggests that the elevation in leptin is not related solely to HCV infection itself. Obviously, the underlying mechanisms of fatigue are multifactorial. It is generally recognised that fatigue occurs through changes in the central nervous system, including altered function of the hypothalamic-pituitary-adrenal axis and/or neurotransmission.5 It has also been suggested that altered serotoninergic pathways might contribute to fatigue.36 Leptin is known to exert its biological effect through the OB receptor that is present in several regions of the body, including the hypothalamus.37 It has also been demonstrated that human leptin levels are inversely related to pituitary-adrenal function38 and that leptin induced sympathetic tone exists in humans.39 Interestingly, leptin has been associated with behavioural changes in various conditions, such as sleep apnoea in humans,40 and has been shown to modify the functional capacity of the skeletal muscle mass in mice.41 Concerning the relationship between leptin and serotonin neurotransmission, both intracerebral and intraperitoneal leptin injections induce a significant increase in diencephalic 5-hydroxytryptamine content in mice.42 Taken together, these findings raise the possibility of a leptin dependent mechanism for fatigue. Whether circulating leptin acts in other liver diseases through a central and/or peripheral pathway requires further investigation.
In conclusion, we have demonstrated that fatigue, objectively assessed by the FIS questionnaire, is present in patients with CHC and that females are more susceptible to fatigue than males. The FIS questionnaire can thus be considered clinically relevant and may prove useful for future therapeutic trials. Study findings also suggest that leptin may play a role in the mediation of fatigue in CHC patients.
Acknowledgments
The authors gratefully thank Professor Pierre-Michel Huet for providing the French version of the fatigue impact scale questionnaire and Mrs Nancy Rameau for reviewing the manuscript.
Abbreviations
CHC, chronic hepatitis C
FIS, fatigue impact scale
REE, resting energy expenditure
FM, fat mass
FFM, fat free mass
TNF-α, tumour necrosis factor α
ALT, alanine aminotransferase
BMI, body mass index
HCV, hepatitis C virus
PBC, primary biliary cirrhosis
REFERENCES
- 1.Gumber SC, Chopra S. Hepatitis C: a multifaceted disease. Review of extrahepatic manifestations. Ann Intern Med 1995;123:615–20. [DOI] [PubMed] [Google Scholar]
- 2.Fisk JD, Pontrefact A, Ritvo PF, et al. Measuring the functional impact of fatigue: initial validation of the fatigue impact scale. Can J Neurol Sci 1994;21:9–14. [DOI] [PubMed] [Google Scholar]
- 3.Huet PM, Deslauriers J, Tran A, et al. Impact of fatigue on the quality of life of patients with primary biliary cirrhosis. Am J Gastroenterol 2000;95:760–7. [DOI] [PubMed] [Google Scholar]
- 4.Goh J, Coughlan B, Quinn J, et al. Fatigue does not correlate with the degree of hepatitis or the presence of autoimmune disorders in chronic hepatitis C infection. Eur J Gastroenterol Hepatol 1999;11:833–8. [DOI] [PubMed] [Google Scholar]
- 5.Swain MG, Maric M. Defective corticotropin-releasing hormone mediated neuroendocrine and behavioral responses in cholestatic rats: implications for cholestatic liver disease-related sickness behaviors. Hepatology 1995;22:1560–4. [PubMed] [Google Scholar]
- 6.Piche T, Schneider SM, Tran A, et al. Resting energy expenditure in chronic hepatitis C. J Hepatol 2000;33:623–7. [DOI] [PubMed] [Google Scholar]
- 7.Caro JF, Sinha MK, Kolaczynki JW, et al. Leptin: the tale of an obesity gene. Diabetes 1996;45:1455–62. [DOI] [PubMed] [Google Scholar]
- 8.Pelleymounter MA, Cullen MJ, Baker MB, et al. Effects of the obese gene product on body weight regulation in ob/ob mice. Science 1995;269:540–3. [DOI] [PubMed] [Google Scholar]
- 9.Hamann A, Matthaei S. Regulation of energy balance by leptin. Exp Clin Endoc Diabetes 1996;104:293–300. [DOI] [PubMed] [Google Scholar]
- 10.Muller MJ, Lautz HU, Plogmann B, et al. Energy expenditure and substrate oxydation in patients with cirrhosis: the impact of cause, clinical staging and nutritional state. Hepatology 1992;15:782–97. [DOI] [PubMed] [Google Scholar]
- 11.McCullough AJ, Bugianesi E, Marchesini G, et al. Gender-dependent alteration in serum leptin in alcoholic cirrhosis. Gastroenterology 1998;115:947–53. [DOI] [PubMed] [Google Scholar]
- 12.Shimizu H, Kakizaki S, Tsuchiya T, et al. An increase of circulating leptin in patients with liver cirrhosis. Int J Obes Relat Metabol Disord 1998;22:1234–8. [DOI] [PubMed] [Google Scholar]
- 13.Henriksen JH, Holst JJ, Moller S, et al. Increased circulating leptin in alcoholic cirrhosis: relation to release and adiposal. Hepatology 1999;29:1818–24. [DOI] [PubMed] [Google Scholar]
- 14.Ockenga J, Bischoff C, Tillmann HL, et al. Elevated bound leptin correlates with energy expenditure in cirrhotics. Gastroenterology 2000;119:1656–62. [DOI] [PubMed] [Google Scholar]
- 15.Greco AV, Mingrone G, Favuzzi A, et al. Serum leptin in post-hepatitis liver cirrhosis. J Hepatol 2000;33:38–42. [DOI] [PubMed] [Google Scholar]
- 16.Testa R, Franceschini R, Gianninni E, et al. Serum leptin levels in patients with viral chronic hepatitis or liver cirrhosis. J Hepatol 2000;33:33–7. [DOI] [PubMed] [Google Scholar]
- 17.Grunfeld C, Zhao C, Fuller J, et al. Endotoxin and cytokine induce expression of leptin, the OB gene product, in hamster. A role for leptin in the anorexia of infection. J Clin Invest 1996;97:2152–7. [DOI] [PMC free article] [PubMed] [Google Scholar]
- 18.Souba WW. Cytokine control of nutrition and metabolism in critical illness. Curr Probl Surg 1994;31:577–643. [DOI] [PubMed] [Google Scholar]
- 19.Tilg H, Diehl AM. Cytokines in alcoholic and nonalcoholic steatohepatitis. N Engl J Med 2000;343:1467–76. [DOI] [PubMed] [Google Scholar]
- 20.Nelson DR, Lim HL, Marousis CG, et al. Activation of tumor necrosis factor-alpha system in chronic hepatitis C virus infection. Dig Dis Sci 1997;42:2487–94. [DOI] [PubMed] [Google Scholar]
- 21.Moss RB, Mercandetti A, Vojdani A. TNF-alpha and chronic fatigue syndrome. J Clin Immunol 1999;19:314–16. [DOI] [PubMed] [Google Scholar]
- 22.Dreisbach AW, Hendrickson T, Beezhold D, et al. Elevated levels of tumor necrosis factor alpha in postdialysis fatigue. Int J Artif Organs 1998;21:83–6. [PubMed] [Google Scholar]
- 23.Anker SD, Rauchhaus M. Insights into the pathogenesis of chronic heart failure: immune activation and cachexia. Curr Opin Cardiol 1999;14:211–16. [DOI] [PubMed] [Google Scholar]
- 24.Gershon AS, Margulies M, Gorczynski RM, et al. Serum cytokine values and fatigue in chronic hepatitis C. J Viral Hepat 2000;7:397–402. [DOI] [PubMed] [Google Scholar]
- 25.Group TFMCS. Intraobserver and interobserver variations in liver biopsy interpretation in patients with chronic hepatitis C. Hepatology 1994;20:15–20. [PubMed] [Google Scholar]
- 26.Weir JB. New methods for calculating metabolic rate with special reference to protein metabolism. J Physiol 1949;109:1–12. [DOI] [PMC free article] [PubMed] [Google Scholar]
- 27.Boulier A, Fricker J, Thomasset al, et al. Fat-free mass estimation by the two-electrode impedance method. Am J Clin Nutr 1990;52:581–5. [DOI] [PubMed] [Google Scholar]
- 28.Tong MJ, El-Farra NS, Reikes AR, et al. Clinical outcomes after transfusion-associated hepatitis C. N Engl J Med 1995;332:1463–6. [DOI] [PubMed] [Google Scholar]
- 29.Foster GR, Goldin RD, Thomas HC. Chronic hepatitis C virus infection causes a significant reduction in quality of life in the absence of cirrhosis. Hepatology 1998;27:209–12. [DOI] [PubMed] [Google Scholar]
- 30.Hassoun Z, Huet PM, Willems B. Assessment of fatigue in patients with chronic hepatitis C using the fatigue impact scale (FIS). Hepatology 2000;32:280A. [DOI] [PubMed] [Google Scholar]
- 31.Nelles S, Abbey S, Stewart DE, et al. Fatigue assessment in patients with hepatitis C. Gastroenterology 1996;110:abstract 1276. [Google Scholar]
- 32.Mahl TC, Daniels K, Dahhan W, et al. Fatigue in patients with chronic hepatitis C. Gastroenterology 1996;110:abstract 1254. [Google Scholar]
- 33.Zdilar D, Franco-Bronson K, Buchler N, et al. Hepatitis C, interferon alfa, and depression. Hepatology 2000;31:1207–11. [DOI] [PubMed] [Google Scholar]
- 34.Lynch EA, Dinarello CA, Cannon JG. Gender difference in IL-1α, ΙL-β, ΙL-1 receptor antagonist secretion from mononuclear cells and urinary excretion. J Immunol 1994;153:300–6. [PubMed] [Google Scholar]
- 35.Ockenga J, Widjaja A, Holtmanspotter M, et al. Bound leptin is regulated by tumour necrosis factor-alpha in HIV-infected patients: a potential mediator of wasting? AIDS 1998;12:2233–5. [PubMed] [Google Scholar]
- 36.Jones EA. Fatigue associated with chronic liver disease: a riddle wrapped in a mystery inside an enigma. Hepatology 1995;22:1606–8. [PubMed] [Google Scholar]
- 37.Satoh N, Ogawa Y, Katsuura G, et al. Satiety effect and sympathetic activation of leptin are mediated by hypothalamic melanocortin system. Neurosci Lett 1998;249:107–10. [DOI] [PubMed] [Google Scholar]
- 38.Licinio J, Manzoros C, Negrao AB, et al. Human leptin levels are pulsatile and inversely related to pituitary-adrenal function. Nat Med 1997;3:575–9. [DOI] [PubMed] [Google Scholar]
- 39.Henriksen JH, Muller S, Ring-Larsen H, et al. The sympathetic nervous system in liver disease. J Hepatol 1998;29:328–41. [DOI] [PubMed] [Google Scholar]
- 40.Vgontzas AN, Papanicoalou DA, Bixler EO, et al. Sleep apnea and daytime sleepiness and fatigue: relation to visceral obesity, insulin resistance, and hypercytokinemia. J Clin Endocrinol Metab 2000;85:1151–8. [DOI] [PubMed] [Google Scholar]
- 41.Warmington SA, Tolan R, McBennet S. Functional and histological characteristics of skeletal muscle and the effects of leptin in the genetically obese (ob/ob) mouse. Int J Obes Relat Metab Disord 2000;24:1040–50. [DOI] [PubMed] [Google Scholar]
- 42.Calapai G, Corica F, Corsonello A, et al. Leptin increases serotonin turnover by inhibition of brain nitric oxide synthesis. J Clin Invest 1999;104:975–82. [DOI] [PMC free article] [PubMed] [Google Scholar]


