Abstract
Background: α1-Acid glycoprotein (α1-AGP) is an acute phase protein in most mammalian species whose concentration rises 2–5-fold during an acute phase reaction. Its serum concentration has often been used as a marker of disease, including inflammatory bowel disease (IBD). High α1-AGP levels were found to have a prognostic value for an increased risk of relapse in IBD.
Aims: To investigate a possible role for increased serum levels of α1-AGP in the development of IBD.
Methods: Dextran sodium sulphate (DSS) 2% was added to the drinking water of transgenic mice, overexpressing the rat α1-AGP gene, to induce acute colitis, thus mimicking the conditions of relapse. Clinical parameters, inflammatory parameters, and histological analyses on colon sections were performed.
Results: Homozygous α1-AGP-transgenic mice started losing weight and showed rectal bleeding significantly earlier than heterozygous transgenic or wild-type mice. Survival time of homozygous transgenic mice was significantly shorter compared with heterozygous and wild-type mice. The higher susceptibility of homozygous α1-AGP-transgenic mice to DSS induced acute colitis was also reflected in higher local myeloperoxidase levels, higher inflammation scores of the colon, and higher systemic levels of interleukin 6 and serum amyloid P component. Local inflammatory parameters were also significantly different in heterozygous transgenic mice compared with wild-type mice, indicating a local dosage effect. In homozygous transgenic mice, significantly higher amounts of bacteria were found in organs but IgA levels were only slightly lower than those of control mice.
Conclusion: Sufficiently high serum levels of α1-AGP result in a more aggressive development of acute colitis.
Keywords: acute phase proteins, dextran sodium sulphate, inflammatory bowel disease, interleukin, liver
α1-Acid glycoprotein (α1-AGP), an acute phase protein in all mammals investigated so far,1 is a highly glycosylated protein of 43 kDa. Due to the presence of sialic acids it is very negatively charged, its pI being only 2.7.2 α1-AGP is produced mainly in the liver3 although some extrahepatic synthesis has also been reported.4–6 In mouse serum, α1-AGP is normally found at a concentration of 0.2–0.4 mg/ml.7 During an acute phase condition, the concentration rises 2–5 times, making it one of the predominant proteins in serum. Although α1-AGP is an abundant protein, its real physiological significance is not fully understood. Inhibition of platelet aggregation8 and of neutrophil function9–11 has been reported. Furthermore, α1-AGP has been shown to bind lipopolysaccharide.12 Protective effects of α1-AGP have been described in vivo.13–18 Besides anti-inflammatory properties, α1-AGP has also been shown to potentiate the secretion by macrophages of proinflammatory cytokines such as interleukin (IL)-6.19,20
Ulcerative colitis and Crohn's disease, human inflammatory bowel diseases (IBDs), are chronic inflammatory disorders of the intestinal tract, characterised by periods of remission and relapse. The aetiology of both diseases is unknown. There is evidence that the pathogenesis involves complex interactions between genetic, immunological, and environmental factors,21 including those that affect the nature of the bacterial flora itself.22 Several experimental models of colitis have been introduced to study factors that can induce intestinal inflammation. Dextran sodium sulphate (DSS) is an agent that, when administered to drinking water, induces reproducible colitis in mice. We show here that transgenic mice expressing constitutively high levels of α1-AGP in the circulation are extremely sensitive to IBD induced by administration of DSS to drinking water.
MATERIALS AND METHODS
Mice
Rat α1-AGP-transgenic mice were generated as described previously23 by injecting genomic DNA into (C57BL/6×DBA/2)F1 zygotes; the resulting transgenic mice were back crossed eight generations into a C57BL/6 background. Heterozygous transgenic mice from the line 9.5-5 constitutively produce about 2 mg/ml α1-AGP.24 This is 10-fold more than wild-type animals. The colony was propagated by breeding heterozygous transgenic mice with C57BL/6 female mice; the offspring, containing heterozygous transgenic and wild-type littermates, were genotyped at weaning age using an enzyme linked immunosorbent assay. Blood (100 μl) was collected by retro-orbital bleeding, after which serum was prepared. α1-AGP was purified by phenol extraction25 and coated on the bottom of an enzyme linked immunosorbent assay plate. After washing, rat α1-AGP was detected using an antirat α1-AGP polyclonal antibody (generated by H Baumann in rabbits) (1/1000) and an antirabbit antibody, conjugated to alkaline phosphatase (Sigma Chemical Co., St Louis, Missouri, USA; 1/5000). The antirat α1-AGP antibody did not cross react with mouse α1-AGP. About 50% of the offspring were heterozygous transgenics. A homozygous transgenic breeding line was also propagated. Only female mice of 8–12 weeks were used in the experiments. Both transgenic and control (non-transgenic littermates) mice had comparable body weights. Mice were kept in a conventional air conditioned mouse room with a 12 hour light-dark cycle and received food and water ad libitum. Mice were bled by retro-ocular bleeding or heart puncture under ether or tribromoethanol (160 mg/kg) anaesthesia, respectively. Serum was prepared after clotting for 30 minutes at 37°C, removal of the clot, and centrifugation for 15 minutes at 15 000 g.
Disease model
Acute colitis was induced by adding 2% DSS to the drinking water (tap water) of homozygous and heterozygous α1-AGP-transgenic and wild-type mice. All mice were weighed daily and checked for gross bleeding. Four days after the start of DSS administration, mice were killed using tribromoethanol (160 mg/kg) and blood was taken by heart puncture. To determine colon length, histological score, and local levels of tumour necrosis factor (TNF) and myeloperoxidase (MPO), the colon was removed and washed with phosphate buffered saline (PBS). The colon was cut longitudinally and its length was measured. The distal third of the colon was cut and fixed in 10% formalin in PBS. Two pieces of colon tissue were cut from the distal part of the colon, weighed, and stored in sterile PBS or buffer A (0.5% hexadecyltrimethylammonium bromide in 50 mM potassium phosphate buffer, pH 6.0) at −20°C to determine local TNF and MPO levels, respectively. Sections of the paraffin embedded material were made longitudinally. Three 5 μm sections were cut at a distance of 20 μm. The sections were stained with haematoxylin-eosin. Histological analysis was performed as described previously26 in a double blind fashion. Mice were scored individually, each score representing the mean of three sections. Epithelium was scored as 0 (normal morphology), 1 (loss of goblet cells), 2 (loss of goblet cells in large areas), 3 (loss of crypts), and 4 (loss of crypts in large areas). Infiltration was scored as 0 (no infiltrate), 1 (infiltrate around crypt bases), 2 (infiltrate reaching to the lamina muscularis mucosa), 3 (extensive infiltration reaching to the lamina muscularis mucosa, thickening of the mucosa with abundant oedema), and 4 (infiltration of the lamina submucosa). The colitis score of individual mice represents the sum of different histological subscores and had a maximum value of 8. Mice that were not killed four days after the start of DSS administration were scored for survival, weighed daily, and checked for gross bleeding. Six days after DSS administration, blood was taken under light ether anaesthesia by retro-ocular bleeding.
Reagents
Bovine serum albumin, bovine α1-AGP, alkaline phosphatase conjugated antirabbit IgG, p-nitrophenyl phosphate, hexadecyltrimethylammoniumbromide, and o-dianisidine dihydrochloride were obtained from Sigma Chemical Co. DSS (molecular weight 40 000) was purchased from ICN Pharmaceuticals (Costa Mesa, California, USA). Sheep antimouse serum amyloid P component (SAP), rabbit antimouse SAP, mouse SAP standard, and pure human MPO were obtained from Calbiochem-Novabiochem International (San Diego, California, USA). Goat antimouse Ig, alkaline phosphatase conjugated goat antimouse IgA, and a mouse IgA standard were supplied by Southern Biotechnology Associates (Birmingham, Alabama, USA).
MPO determination
MPO activity was measured as previously described.27 Briefly, tissue samples were weighed and homogenised by sonication in buffer A (0.5% hexadecyltrimethylammonium bromide in 50 mM potassium phosphate buffer, pH 6.0). Homogenates were subjected to three freeze/thaw cycles of five minutes each. After centrifugation for 20 minutes, 20 μl of the supernatant of each sample were mixed with 280 μl of buffer B (0.167 mg/ml o-dianisidine dihydrochloride plus 0.0005% H2O2 in 50 mM potassium phosphate buffer, pH 6). After 20 minutes, absorbance was measured spectrophotometrically at 490 nm. Pure human MPO was used as a standard. To express MPO levels per mg of protein, protein determination was performed on the same sample according to a method described previously.28
IgA determination
To isolate faecal IgA, three fresh faecal pellets were weighed and dissolved overnight at 4°C in 1 ml of faeces dissolving solution (0.05% NaN3 and 10% fetal calf serum in PBS). Faeces were mixed by shaking; after high speed centrifugation, supernatant was collected and stored at −20°C until use. IgA ELISA was performed using microtitre plates coated overnight with a 1/1000 dilution of goat antimouse Ig. After washing, free places were blocked using 1% bovine serum albumin solution in PBS (one hour at 37°C). Samples and a standard were titrated in 1/3 steps in the assay and incubated at 37°C for one hour. After washing, a second antibody (alkaline phosphatase conjugated goat antimouse IgA) was added in 1/1000 dilution; plates were incubated for one hour at 37°C. The assay was developed using p-nitrophenylphosphate; absorbance was measured at 405 nm.
Measurement of serum parameters
TNF was measured in a cytotoxic assay on WEHI 164 clone 13 cells.29 Briefly, serial dilutions of samples and TNF standards were incubated with cells in 96 well microtitre plates (30 000 cells/well) in the presence of 1 μg/ml of actinomycin D. After 18 hours of incubation, the number of surviving cells was determined with 3-(4,5-dimethylthiazol-2-yl)-2,5-diphenyltetrazolium bromide (detection range of 0.1 pg/ml).
IL-6 was determined as described previously.30 IL-6 dependent 7TD1 cells were cultured in 96 well microtitre plates (7000 cells/well) in the presence of medium, serial dilutions of serum, or a murine IL-6 standard. After three days of culture, the number of living cells was determined in a hexosaminidase colorimetric assay; titres were assigned by comparing dilutions of samples and standard needed to obtain half maximal growth of 7TD1 cells.
SAP was measured by a sandwich ELISA as previously described.31 Briefly, microtitre plates were coated overnight with a 1/1000 dilution of sheep antimouse SAP. After washing, free places were blocked using 1% bovine serum albumin solution in PBS (one hour at 37°C). Serum and a standard were diluted 25-fold and titrated in 1/5 steps in triplicate, after which they were incubated at 37°C for one hour. After washing, a second antibody (rabbit antimouse SAP) was added in a 1/5000 dilution; plates were incubated for one hour at 37°C, after which an antirabbit antibody (alkaline phosphatase conjugated) was added and incubated for another hour at 37°C. The assay was developed using p-nitrophenylphosphate; absorbance was measured at 405 nm.
Rat and mouse AGP were quantitated by rocket immunoelectrophoresis using specific non-cross reactive polyclonal antibodies and appropriate standards previously described.23
Bacterial count
Mice were killed by cervical dislocation and perfused with 10 ml of sterile PBS to flush the blood out of the organs. Organs were removed aseptically and weighed. For homogenisation, the liver was diluted (w/v) twofold; spleen, kidney, colon, and lung were diluted (w/v) 10-fold. Suspensions were diluted and plated on sterile Luria broth. After overnight incubation at 37°C, colony forming units were determined and expressed as CFU/mg tissue.
Statistics
Mean (SD) values were compared using an unpaired Student's t test, with Welch's correction in case of non-homogeneous variances. Survival curves (Kaplan-Meier plots) were compared using a log rank test, and final outcomes using Fisher's exact test. p<0.05 was considered statistically significant.
RESULTS
Clinical symptoms during DSS induced colitis
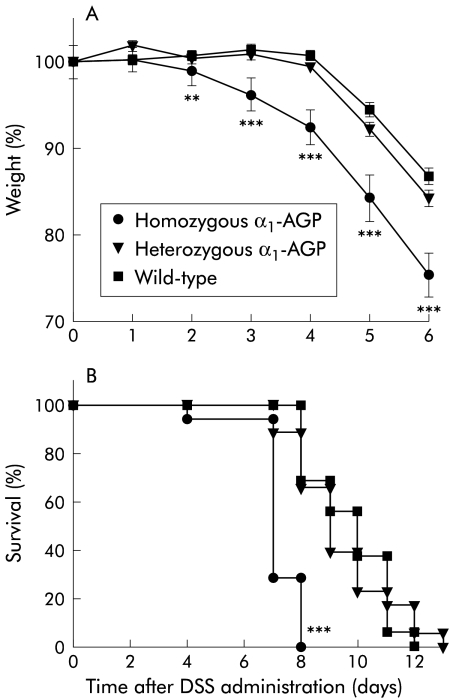
After administration of 2% DSS to the drinking water of homozygous and heterozygous α1-AGP-transgenic mice and to wild-type littermates, mice were weighed daily and stools were checked for the presence of blood. This was done until most homozygous transgenic mice started to die (day 7). On day 4, half of the mice from each group (n=18, n=19, and n=15 for homozygous and heterozygous transgenic and wild-type mice, respectively) were killed to determine inflammatory parameters. The rest of the mice were followed up for weight loss and survival. Starting from day 2 of DSS administration, a significant difference in weight was found (fig 1A ▶). The weight of homozygous α1-AGP-transgenic mice was significantly lower than that of heterozygous transgenic (p=0.0241) and wild-type (p=0.0035) mice. The difference in weight loss was most pronounced starting from day 3 (p<0.0001 for difference in weight between homozygous and heterozygous transgenic mice, and homozygous and wild-type mice on days 3, 4, 5, and 6). Homozygous transgenic mice started to show gross bleeding on day 2. On day 3, the number of homozygous transgenic mice that showed gross bleeding was significantly higher than in wild-type mice (p=0.0032); on day 5, all homozygous transgenics showed gross bleeding (p=0.0003 compared with wild-type mice). In heterozygous and wild-type mice, gross bleeding was observed on days 3 and 4, respectively; all mice showed gross bleeding on days 7 and 8, respectively. The number of heterozygous transgenic mice that showed gross bleeding was significantly different compared with that of wild-type mice on days 6 and 7 (p=0.0202 and p=0.0228, respectively) (table 1 ▶). Survival of homozygous transgenic mice was significantly reduced compared with heterozygous and wild-type mice (p<0.0001). Homozygous transgenic mice all died between days 4 and 8 while heterozygous and wild-type mice died between days 7 and 13, and days 8 and 12, respectively (fig 1B ▶).
Figure 1.
(A) Per cent weight during dextran sodium sulphate (DSS) induced acute colitis. DSS 2% was given to the drinking water of homozygous α1-AGP-transgenic (n=36 and n=17 from day 5), heterozygous α1-AGP-transgenic (n=38 and n=19 from day 5), and wild-type mice (n=30 and n=15 from day 5). Weight was recorded daily. Statistical significance was assessed compared with wild-type mice. (B) Survival during DSS induced acute colitis. DSS 2% was given to the drinking water of homozygous α1-AGP-transgenic (n=18), heterozygous α1-AGP-transgenic (n=19), and wild-type mice (n=15). Survival was recorded daily. Statistical significance was assessed compared with wild-type mice. **p<0.01, ***p<0.001.
Table 1.
Appearance of gross bleeding in mice (%) during dextran sodium sulphate treatment.
| Homozygous transgenic | Heterozygous transgenic | Wild-type | |
| Day 0 | 0 (n=36); NS | 0 (n=38); NS | 0 (n=30) |
| Day 1 | 0 (n=36); NS | 0 (n=38); NS | 0 (n=30) |
| Day 2 | 6 (n=36); NS | 0 (n=38); NS | 0 (n=30) |
| Day 3 | 25 (n=36);** | 3 (n=38); NS | 0 (n=30) |
| Day 4 | 80 (n=35);*** | 19 (n=38); NS | 6 (n=30) |
| Day 5 | 100 (n=17);*** | 61 (n=19); NS | 38 (n=15) |
| Day 6 | 100 (n=17);*** | 78 (n=19);* | 50 (n=15) |
| Day 7 | 100 (n=5); NS | 100 (n=19);* | 75 (n=15) |
| Day 8 | ND (n=0) | 100 (n=13); NS | 100 (n=10) |
Significance was calculated using a χ2 test. All values were compared with wild-type mice: *p<0.05, **p<0.01, ***p<0.001.
Exogenous AGP administration in wild-type mice also resulted in significant enhanced weight loss and earlier lethality compared with control mice: six days after DSS administration, wild-type mice which received two intraperitoneal injections (on days 0 and 3) of 10 mg of bovine α1-AGP had a mean weight of 14.6 (0.2) g, mice which received two injections of 5 mg α1-AGP had a mean weight of 15.9 (0.5) g, and wild-type mice receiving no α1-AGP had a mean weight of 17.8 (0.1) g (n=6 for each group; p<0.001 for each group compared with one another). All mice had the same weight at the onset of the experiment. Eight days after DSS administration, lethality was 6/6, 1/6 (p=0.0034), and 0/6 (p=0.0005), respectively.
Local inflammatory parameters
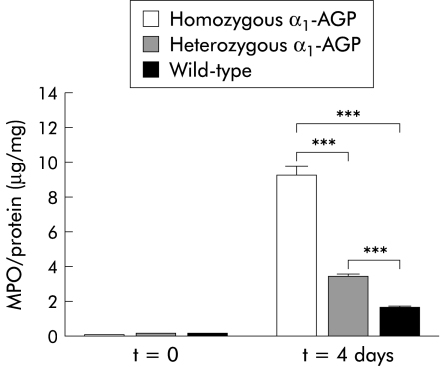
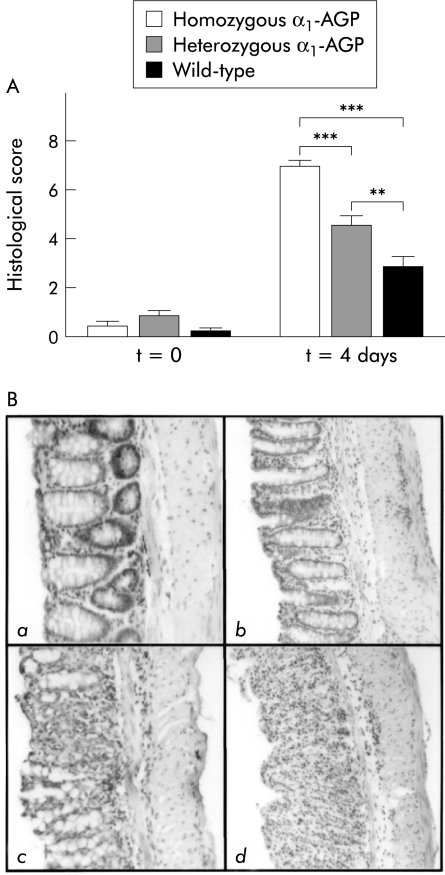
MPO concentration was determined, as a measure of neutrophil influx, on a distal piece of the colon of control mice from each group before DSS administration and four days after DSS administration. In the latter case, there was a significant increase in MPO levels in all three groups of mice compared with control levels (p<0.001). Moreover, there was also a significant difference after DSS administration between homozygous and heterozygous transgenic mice, between homozygous transgenic and wild-type mice, and between heterozygous transgenic and wild-type mice (p<0.001) (fig 2 ▶). TNF levels were determined on colon samples of control mice of each group before and after four days of DSS administration. Local TNF was not detectable (results not shown). Finally, inflammation of the distal colon was scored histologically in a double blind fashion four days after DSS administration. A significant increase in inflammation score for all three groups of mice was found compared with control mice before DSS administration (p<0.0001, p=0.0003, and p=0.044 for homozygous transgenic, heterozygous transgenic, and wild-type mice, respectively). There was also a significant difference between the various groups four days after DSS administration. Homozygous transgenic mice had a significantly higher inflammatory score than heterozygous transgenic (p<0.0001) and wild-type mice (p<0.0001). Moreover, heterozygous transgenic mice also had a significantly higher inflammation score compared with wild-type mice (p=0.0056) (fig 3A ▶). A representative example of colon sections of negative controls, and wild-type, homozygous, and heterozygous transgenic mice four days after 2% DSS administration is shown in fig 3B ▶. Negative controls showed no signs of crypt damage or inflammatory infiltrate. Wild-type mice showed only mild inflammation consisting of local, and in some cases more general, loss of goblet cells and inflammatory infiltrate localised to the crypt base. In heterozygous transgenic mice, crypt damage was in most cases confined to general loss of goblet cells or local crypt loss while inflammatory infiltrate extended from the crypt base to the lamina muscularis mucosa, with or without signs of oedema. In homozygous transgenic mice, crypt damage ranged from local to general crypt destruction; inflammatory infiltrate reached the lamina muscularis mucosa, with abundant oedema, or even the submucosa. In all cases, inflammatory infiltrate consisted of a mixture of granulocytes and lymphocytes.
Figure 2.
Local myeloperoxidase (MPO) levels after dextran sodium sulphate (DSS) treatment. MPO levels were determined in colon samples of homozygous α1-AGP-transgenic (n=18), heterozygous α1-AGP-transgenic (n=19), and wild-type mice (n=15) four days after administration of 2% DSS and compared with negative controls of the corresponding genotype (n=5 for each group). Statistical significance was assessed compared with homozygous transgenic mice. ***p<0.001.
Figure 3.
(A) Histological score after dextran sodium sulphate (DSS) treatment. Four days after 2% DSS treatment, the histological score was determined from the distal part of the colon from homozygous α1-AGP-transgenic (n=18), heterozygous α1-AGP-transgenic (n=19), and wild-type mice (n=15) and compared with negative controls of the corresponding genotype (n=5 for each group). Statistical significance values are based on homozygous and heterozygous transgenic versus wild-type mice, and homozygous versus heterozygous transgenic mice: **p<0.01, ***p<0.001. (B) Representative distal colon sections (100×) stained with haematoxylin-eosin. (a) Section of a negative control (no DSS treatment) showing normal crypt morphology, with crypt bases resting on the lamina muscularis mucosa, and no inflammatory infiltrate. (b) Section of a wild-type mouse four days after DSS treatment. There is local loss of goblet cells and some inflammatory infiltrate at the crypt base which is no longer resting on the lamina muscularis mucosa. (c) Section of a heterozygous transgenic mouse showing local crypt destruction and inflammatory infiltrate reaching to the lamina muscularis mucosa. (d) Section of a homozygous transgenic mouse with total destruction of crypt structure and inflammatory infiltrate reaching into the submucosa.
Systemic inflammatory parameters
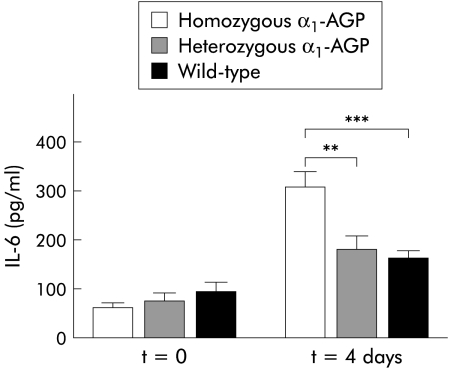
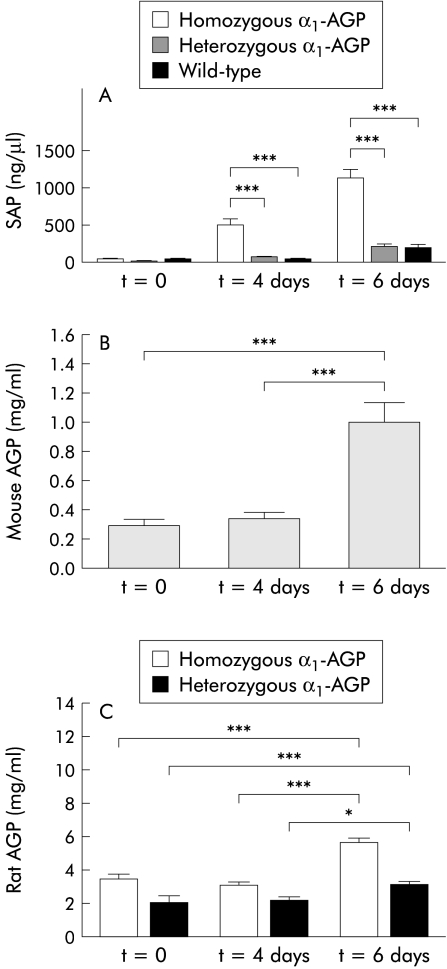
Four days after DSS administration, half of the mice in each group were killed and blood was taken by heart puncture. The surviving mice were bled by retro-ocular bleeding six days after DSS administration. Cytokine, SAP, and mouse or rat AGP levels were determined in serum samples as a systemic measure of inflammation. IL-6 levels were increased in the three groups of mice four days after DSS administration compared with control mice (p=0.0004 for homozygous transgenic mice and p=0.0159 for wild-type mice); the increase in IL-6 concentration in the serum of heterozygous transgenic mice was not statistically significant. There was also a significant difference in IL-6 levels four days after DSS administration between homozygous transgenic and heterozygous transgenic mice on the one hand and between homozygous transgenic and wild-type mice on the other (p=0.0026 and p=0.0002, respectively) (fig 4 ▶). TNF was not detected in serum samples, neither four days nor six days after DSS administration (results not shown). SAP levels in serum four days after DSS administration were significantly increased in homozygous transgenic mice (p=0.0059) but not in heterozygous transgenic and wild-type mice. Six days after DSS administration there was a significant increase in SAP levels in homozygous and heterozygous transgenic mice. The increase in SAP levels in wild-type mice was not statistically significant. We also found a significant difference in SAP levels six days after DSS administration compared with four days after DSS administration in the three groups of mice (p<0.0001, p=0.0042, and p=0.0037 for homozygous transgenic, heterozygous transgenic, and wild-type mice, respectively). Among the groups, there was a significant difference four and six days after DSS administration between homozygous and heterozygous transgenic mice on the one hand and between homozygous and wild-type mice on the other (p<0.0001 for all) (fig 5A ▶). Mouse AGP levels in wild-type mice (fig 5B ▶) and rat AGP levels in heterozygous and homozygous transgenic mice (fig 5C ▶) were significantly increased six days after DSS administration (p<0.001). Rat AGP levels in homozygous transgenic mice were almost twice as high as those in heterozygous transgenic mice.
Figure 4.
Interleukin 6 (IL-6) serum concentration during dextran sodium sulphate (DSS) treatment. Four days after DSS treatment, IL-6 levels were determined in the serum of homozygous α1-AGP-transgenic (n=36), heterozygous α1-AGP-transgenic (n=38), and wild-type mice (n=30). IL-6 levels were compared with negative controls of the corresponding genotype (n=5 for each group). Statistical significance was assessed compared with homozygous transgenic mice: **p<0.01, ***p<0.001.
Figure 5.
(A) Serum amyloid P component (SAP) serum concentrations during dextran sodium sulphate (DSS) treatment. Four and six days after DSS treatment SAP levels were determined in the serum of homozygous α1-AGP-transgenic (n=36 on day 4 and n=17 on day 6), heterozygous α1-AGP-transgenic (n=38 on day 4 and n=19 on day 6), and wild-type mice (n=30 on day 4 and n=15 on day 6). SAP levels were compared with negative controls of the corresponding genotype (n=5 for each group). Statistical significance was assessed compared with homozygous transgenic mice. (B) Mouse α1-AGP serum concentrations in wild-type mice before and during DSS administration (n=15). (C) Rat α1-AGP levels in homozygous and heterozygous transgenic mice before (n=5) and during DSS administration (n=17 and n=19 on day 4 and day 6 for homozygous and heterozygous α1-AGP transgenic mice, respectively). *p<0.05, ***p<0.001.
Bacterial counts in organs
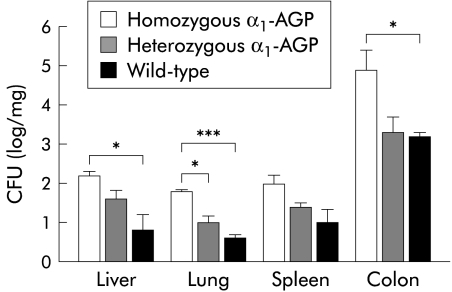
To test whether tissue destruction would lead to increased spread of luminal bacteria to other organs, organs were flushed, removed aseptically, weighed, and homogenised. Homogenised tissues were plated out and the number of bacteria was counted. In lung, significantly more bacteria were observed in homozygous transgenic mice compared with heterozygous transgenic and wild-type mice (p=0.0119 and p=0.0007, respectively). In the liver and colon, we found significantly more bacteria in homozygous mice compared with wild-type mice (p=0.0291 and p=0.0331, respectively). Although bacterial counts were also higher in the spleen of transgenic mice, the difference was not statistically significant compared with wild-type mice (fig 6 ▶).
Figure 6.
Bacterial load in different organs. Four days after 2% dextran sodium sulphate (DSS) treatment, tissues from homozygous α1-AGP-transgenic (n=4), heterozygous α1-AGP-transgenic (n=4), and wild-type mice (n=4) were homogenised and plated on Luria broth. Statistical significance was assessed compared with homozygous transgenic mice: *p<0.05, ***p<0.001. CFU, colony forming units.
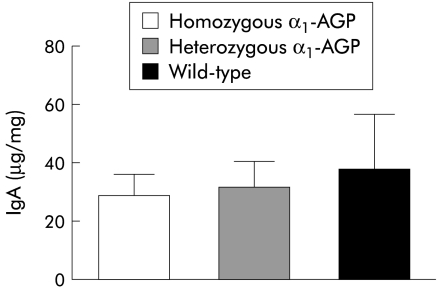
IgA levels in faeces were investigated to determine whether an increase in bacterial load in homozygous transgenic mice was due to decreased production of IgA in the colon. However, no significant difference in concentrations of IgA in the three groups of mice was detected (fig 7 ▶).
Figure 7.
Determination of IgA levels during dextran sodium sulphate (DSS) treatment. Four days after treatment with 2% DSS, IgA levels from homozygous α1-AGP-transgenic (n=10), heterozygous α1-AGP-transgenic (n=10), and wild-type mice (n=10) were determined.
DISCUSSION
Acute colitis, induced by administration of DSS to the drinking water of mice, is a useful model for studying the pathophysiological aspects of colonic inflammatory diseases such as IBD, for evaluating new therapeutic targets and agents,32,33 or to study relapse during IBD.34 Clinical symptoms following DSS administration include haemocult positive and loose stools, followed by diarrhoea, gross bleeding, and weight loss. The earliest histological observation is loss of goblet cells, followed by crypt loss, which precedes an increase in mucosal permeability. Inflammation occurs secondary to crypt loss. The inflammatory infiltrate mainly consists of MPO positive granulocytes.26,35
The mechanism of DSS induced colitis is not fully understood. DSS is thought to induce mucosal injury as mice deficient in key mediators of protection and/or repair mechanisms in the colonic mucosa and of factors preserving mucosal integrity of the colon have considerably increased susceptibility to DSS.36–38 Inflammation is the result of subsequent activation of macrophages, resulting in cytokine mediated cytotoxicity.39–43 As it was found that high serum concentrations of α1-AGP are positively correlated with the risk of relapse in IBD,44–46 we investigated a possible role of high serum concentrations of α1-AGP in the development of acute colitis. We found that during DSS administration, homozygous α1-AGP-transgenic mice started to show clinical signs of illness much earlier than heterozygous transgenic or wild-type controls. Weight loss and gross bleeding appeared significantly earlier in transgenic mice compared with wild-type mice, and survival of homozygous transgenic mice was significantly reduced compared with heterozygous transgenic and wild-type mice. The clinical data clearly show a difference in response to DSS between homozygous transgenics on the one hand and heterozygous transgenics and wild-type mice on the other. However, except for a minor but statistically significant difference in appearance of gross bleeding, there was no significant difference in clinical parameters between heterozygous transgenics and wild-type mice. The fact that homozygous transgenic mice show clinical signs of illness relatively fast indicates that the effect of α1-AGP is probably at one of the very early stages in the pathogenesis of DSS induced colitis. Accordingly, administration of exogenous α1-AGP to wild-type mice also led to increased lethality and weight loss in α1-AGP treated mice compared with controls receiving no α1-AGP.
Determination of local inflammatory parameters four days after DSS administration revealed a dosage effect of α1-AGP. Histological observation and local MPO levels clearly showed that α1-AGP-transgenic mice have a much worse inflammation/pathology than wild-type mice, homozygous transgenic mice being even more affected than heterozygous transgenics. Local TNF bioactivity was not detected in any of the colon samples, even using a very sensitive bioassay (detection limit of 0.1 pg/ml). Although upregulation of TNF is demonstrated by several investigators,40,47 others did not detect TNF bioactivity in colon or serum samples.48
Systemic inflammatory parameters, including serum IL-6 and SAP levels, again showed no significant differences between heterozygous and wild-type mice but were significantly higher in homozygous transgenics compared with heterozygous transgenic and wild-type mice. Again, we could not detect any TNF bioactivity in serum samples both in contrast with and in agreement with others.40,47,48 Mouse or rat AGP levels were also increased after DSS administration. Although α1-AGP levels only started to increase six days after DSS administration, the initial high concentration is probably sufficient to synergise in the development of acute colitis. Therefore, it seems that local inflammatory parameters are more influenced by the presence of α1-AGP while this is not the case for systemic inflammatory parameters.
The number of bacteria in the lung, liver, and colon was significantly higher in homozygous compared with wild-type mice four days after DSS administration. In spleen there was an increase in bacterial load in transgenic mice although this was not significant. This observation is in agreement with previously reported results49 showing an increase in Gram negative bacteria in the liver and spleen of terminally ill animals. It has already been suggested that some bacterial organisms may invade the mucosa after induction of toxic injury by DSS on colonic epithelial cells.37 Moreover, in acute DSS colitis, treatment with antibiotics led to improvement in histological parameters and colon length.36,50 This suggests that an increase in bacterial load and loss of tolerance, leading to spread of bacteria in tissues, may contribute to the disease process.
IgA is produced to defend mucosal surfaces from environmental organisms.51 As α1-AGP is known to have an inhibitory effect on activation of lymphocytes, by measuring IgA levels we investigated whether an increase in bacterial load in transgenic mice can be ascribed to decreased tolerance against intestinal bacteria. However, there was no difference in IgA levels between the three groups of mice.
Macrophages play an important role in the acute DSS model as they can phagocytose DSS, leading to activation of macrophages,39,40 which can contribute to tissue damage. As α1-AGP can stimulate macrophages to release proinflammatory cytokines such as IL-1,19 this could result in a positive feedback loop; the high local concentration of α1-AGP could have an exponential effect on cytokine release and could stimulate leucocyte recruitment and activation whereby more macrophages and other inflammatory cells such as neutrophils are activated and contribute to tissue damage. Indeed, we have shown that there was more MPO in transgenic mice (a dose dependent effect).
In conclusion, we have shown that α1-AGP-transgenic mice have an increased susceptibility to DSS induced colitis compared with wild-type mice. Clinically and systemically there is little difference in the parameters observed between heterozygous transgenic and wild-type mice. However, when considering local parameters, such as MPO levels and inflammation score, there was a dosage effect of α1-AGP. Homozygous transgenic mice are more susceptible than heterozygous transgenic mice; the latter are clearly more susceptible to DSS induced colitis than wild-type mice. Our results suggest that high levels of α1-AGP can have a synergistic effect with stimuli that can provoke colitis.
Acknowledgments
This work was supported by the Fonds voor Wetenschappelijk Onderzoek-Vlaanderen (grant G023698N) and the Interuniversitaire Attractiepolen.
Abbreviations
IL, interleukin
α1-AGP
α1-acid glycoprotein
DSS, dextran sodium sulphate
IBD, inflammatory bowel disease
MPO, myeloperoxidase
PBS, phosphate buffered saline
SAP, serum amyloid P component
TNF, tumour necrosis factor
REFERENCES
- 1.Kushner I, Mackiewicz A. The acute phase response: an overview. In: Mackiewicz, A, Kushner I, Baumann H, eds. Acute phase proteins: molecular biology, biochemistry, and clinical applications. Boca Raton: CRC Press, 1993:3–19.
- 2.Schmid K. α1-Acid glycoprotein. In: Putman FW, ed. The plasma proteins: structure, function and genetic control. New York: Academic Press, 1975:183–92.
- 3.Sarcione EJ. Synthesis of α1-acid glycoprotein by the isolated perfused rat liver. Arch Biochem Biophys 1963;100:516–18. [DOI] [PubMed] [Google Scholar]
- 4.Gahmberg CG, Andersson LC. Leukocyte surface origin of human α1-acid glycoprotein (orosomucoid). J Exp Med 1978;148:507–21. [DOI] [PMC free article] [PubMed] [Google Scholar]
- 5.Eap CB, Baumann P, Moretta A. Synthesis of α1-acid glycoprotein by human T lymphocytes. Experientia 1989;45:A52. [Google Scholar]
- 6.Sörensson J, Matejka GL, Ohlson M, et al. Human endothelial cells produce orosomucoid, an important component of the capillary barrier. Am J Physiol 1999;276:H530–4. [DOI] [PubMed] [Google Scholar]
- 7.Kopf M, Baumann H, Freer G, et al. Impaired immune and acute-phase responses in interleukin-6-deficient mice. Nature 1994;368:339–42. [DOI] [PubMed] [Google Scholar]
- 8.Costello M, Fiedel BA, Gewurz H. Inhibition of platelet aggregation by native and desialised α1-acid glycoprotein. Nature 1979;281:677–8. [DOI] [PubMed] [Google Scholar]
- 9.van Oss CJ, Gillman CF, Bronson PM, et al. Phagocytosis-inhibiting properties of human serum α1-acid glycoprotein. Immunol Commun 1974;3:321–8. [DOI] [PubMed] [Google Scholar]
- 10.Bennett M, Schmid K. Immunosuppression by human plasma α1-acid glycoprotein: Importance of the carbohydrate moiety. Proc Natl Acad Sci USA 1980;77:6109–13. [DOI] [PMC free article] [PubMed] [Google Scholar]
- 11.Lainé E, Couderc R, Roch-Arveiller M, et al. Modulation of human polymorphonuclear neutrophil functions by α1-acid glycoprotein. Inflammation 1990;14:1–9. [DOI] [PubMed] [Google Scholar]
- 12.Moore DF, Rosenfeld MR, Gribbon PM, et al. α1-Acid (AAG, orosomucoid) glycoprotein: interaction with bacterial lipopolysaccharide and protection from sepsis. Inflammation 1997;21:69–82.9179623 [Google Scholar]
- 13.Libert C, Brouckaert P, Fiers W. Protection by α1-acid glycoprotein against tumor necrosis factor-induced lethality. J Exp Med 1994;180:1571–5. [DOI] [PMC free article] [PubMed] [Google Scholar]
- 14.Van Molle W, Libert C, Fiers W, et al. α1-Acid glycoprotein and α1-antitrypsin inhibit TNF-induced but not anti-Fas-induced apoptosis of hepatocytes in mice. J Immunol 1997;159:3555–64. [PubMed] [Google Scholar]
- 15.Williams JP, Weiser MR, Pechet TT, et al. α1-Acid glycoprotein reduces local and remote injuries after intestinal ischemia in the rat. Am J Physiol 1997;273:G1031–5. [DOI] [PubMed] [Google Scholar]
- 16.Muchitsch EM, Auer W, Pichler L. Effects of α1-acid glycoprotein in different rodent models of shock. Fundam Clin Pharmacol 1998;12:173–81. [DOI] [PubMed] [Google Scholar]
- 17.Daemen MARC, Heemskerk VH, van `t Veer C, et al. Functional protection by acute phase proteins α1-acid glycoprotein and α1-antitrypsin against ischemia/reperfusion injury by preventing apoptosis and inflammation. Circulation 2000;102:1420–6. [DOI] [PubMed] [Google Scholar]
- 18.Hochepied T, Van Molle W, Berger FG, et al. Involvement of the acute phase protein α1-acid glycoprotein in nonspecific resistance to a lethal Gram-negative infection. J Biol Chem 2000;275:14903–9. [DOI] [PubMed] [Google Scholar]
- 19.Boutten A, Dehoux M, Deschenes M, et al. α1-Acid glycoprotein potentiates lipopolysaccharide-induced secretion of interleukin-1β, interleukin-6 and tumor necrosis factor-α by human monocytes and alveolar and peritoneal macrophages. Eur J Immunol 1992;22:2687–95. [DOI] [PubMed] [Google Scholar]
- 20.Su SJ, Yang BC, Wang YS, et al. α1-Acid glycoprotein-induced tumor necrosis factor-α secretion of human monocytes is enhanced by serum binding proteins and depends on protein tyrosine kinase activation. Immunopharmacology 1999;41:21–9. [DOI] [PubMed] [Google Scholar]
- 21.Shanahan F. Current concepts of the pathogenesis of inflammatory bowel disease. Ir J Med Sci 1994;163:544–9. [DOI] [PubMed] [Google Scholar]
- 22.Fiocchi C. Inflammatory bowel disease: etiology and pathogenesis. Gastroenterology 1998;115:182–205. [DOI] [PubMed] [Google Scholar]
- 23.Dewey MJ, Rheaume C, Berger FG, et al. Inducible and tissue-specific expression of rat α-1-acid glycoprotein in transgenic mice. J Immunol 1990;144:4392–8. [PubMed] [Google Scholar]
- 24.Libert C, Hochepied T, Berger FG, et al. High-level constitutive expression of α1-acid glycoprotein and lack of protection against tumor necrosis factor-induced lethal shock in transgenic mice. Transgenic Res 1998;7:429–35. [DOI] [PubMed] [Google Scholar]
- 25.Chan J, Yu D. One-step isolation of α1-acid glycoprotein. Protein Expr Purif 1991;2:34–6. [DOI] [PubMed] [Google Scholar]
- 26.Kojouharoff G, Hans W, Obermeier F, et al. Neutralization of tumour necrosis factor (TNF) but not of IL-1 reduces inflammation in chronic dextran sulphate sodium-induced colitis in mice. Clin Expl Immunol 1997;107:353–8. [DOI] [PMC free article] [PubMed] [Google Scholar]
- 27.Bradley PP, Priebat DA, Christensen RD, et al. Measurement of cutaneous inflammation: estimation of neutrophil content with an enzyme marker. J Invest Dermatol 1982;78:206–9. [DOI] [PubMed] [Google Scholar]
- 28.Lowry OH, Rosebrough JN, Farr AL, et al. Protein measurements with the Folin reagent. J Biol Chem 1951;193:265–75. [PubMed] [Google Scholar]
- 29.Espevik T, Nissen-Meyer J. A highly sensitive cell line, WEHI 164 clone 13, for measuring cytotoxic factor/tumor necrosis factor from human monocytes. J Immunol Methods 1986;95:99–105. [DOI] [PubMed] [Google Scholar]
- 30.Van Snick J, Cayphas S, Vink A, et al. Purification and NH2-terminal amino acid sequence of a T-cell-derived lymphokine with growth factor activity for B-cell hybridomas. Proc Natl Acad Sci USA 1986;83:9679–83. [DOI] [PMC free article] [PubMed] [Google Scholar]
- 31.Taktak YS, Stenning B. Solid phase enzyme immunoassays for the quantification of serum amyloid P (SAP) and complement component 3 (C3) proteins in acute-phase mouse sera. Horm Metab Res 1992;24:371–4. [DOI] [PubMed] [Google Scholar]
- 32.Cooper HS, Murthy S, Kido K, et al. Dysplasia and cancer in the dextran sulfate sodium mouse colitis model. Relevance to colitis-associated neoplasia in the human: a study of histopathology, β-catenin and p53 expression and the role of inflammation. Carcinogenesis 2000;21:757–68. [DOI] [PubMed] [Google Scholar]
- 33.Egger B, Bajaj-Elliott M, MacDonald TT, et al. Characterisation of acute murine dextran sodium sulphate colitis: cytokine profile and dose dependency. Digestion 2000;62:240–8. [DOI] [PubMed] [Google Scholar]
- 34.Stahlberg D, Veress B, Mare K, et al. Leukocyte migration in acute colonic inflammatory bowel disease: comparison of histological assessment and Tc-99m-HMPAO labeled leukocyte scan. Am J Gastroenterol 1997;92:283–8. [PubMed] [Google Scholar]
- 35.Kitajima S, Takuma S, Morimoto M. Changes in colonic mucosal permeability in mouse colitis induced with dextran sulfate sodium. Exp Anim 1999;48:137–43. [DOI] [PubMed] [Google Scholar]
- 36.Mashimo H, Wu DC, Podolsky DK, et al. Impaired defense of intestinal mucosa in mice lacking intestinal trefoil factor. Science 1996;274:262–5. [DOI] [PubMed] [Google Scholar]
- 37.Egger B, Procaccino F, Lakshmanan J, et al. Mice lacking transforming growth factor-α have an increased susceptibility to dextran sulfate-induced colitis. Gastroenterology 1997;113:825–32. [DOI] [PubMed] [Google Scholar]
- 38.Egger B, Buchler MW, Lakshmanan J, et al. Mice harboring a defective epidermal growth factor receptor (waved-2) have an increased susceptibility to acute dextran sulfate-induced colitis. Scand J Gastroenterol 2000;35:1181–7. [DOI] [PubMed] [Google Scholar]
- 39.Okayasu I, Hatakeyama S, Yamada M, et al. A novel method in the induction of reliable experimental acute and chronic ulcerative colitis in mice. Gastroenterology 1990;98:694–702. [DOI] [PubMed] [Google Scholar]
- 40.Dieleman LA, Ridwan BU, Tennyson GS, et al. Dextran sulfate sodium-induced colitis occurs in severe combined immunodeficient mice. Gastroenterology 1994;107:1643–52. [DOI] [PubMed] [Google Scholar]
- 41.Takizawa H, Shintani N, Natsui M, et al. Activated immunocompetent cells in rat colitis mucosa induced by dextran sulfate sodium and not complete but partial suppression of colitis by FK506. Digestion 1995;56:259–64. [DOI] [PubMed] [Google Scholar]
- 42.Ni J, Chen SF, Hollander D. Effects of dextran sulphate sodium on intestinal epithelial cells and intestinal lymphocytes. Gut 1996;39:234–41. [DOI] [PMC free article] [PubMed] [Google Scholar]
- 43.Leung FW, Heng MC, Allen S, et al. Involvement of luminal bacteria, heat shock protein 60, macrophages and γδ T cells in dextran sulfate sodium-induced colitis in rats. Dig Dis Sci 2000;45:1472–9. [DOI] [PubMed] [Google Scholar]
- 44.Wright JP, Young GO, Tigler-Wybrandi N. Predictors of acute relapse of Crohn's disease. A laboratory and clinical study. Dig Dis Sci 1987;32:164–70. [DOI] [PubMed] [Google Scholar]
- 45.Lubega J, Davies TJ. A comparison of serum mucoprotein with serum α1 acid glycoprotein, haptoglobin, and α1 antitrypsin assays in monitoring inflammatory bowel disease. Clin Chim Acta 1990;188:59–69. [DOI] [PubMed] [Google Scholar]
- 46.Kjeldsen J, Lauritsen K, De Muckadell OB. Serum concentrations of orosomucoid: improved decision-making for tapering prednisolone therapy in patients with active inflammatory bowel disease? Scand J Gastroenterol 1997;32:933–41. [DOI] [PubMed] [Google Scholar]
- 47.Murano M, Maemura K, Hirata I, et al. Therapeutic effect of intracolonically administered nuclear factor κB (p65) antisense oligonucleotide on mouse dextran sulphate sodium (DSS)-induced colitis. Clin Exp Immunol 2000;120:51–8. [DOI] [PMC free article] [PubMed] [Google Scholar]
- 48.Olson AD, DelBuono EA, Bitar KN, et al. Antiserum to tumor necrosis factor and failure to prevent murine colitis. J Pediatr Gastroenterol Nutr 1995;21:410–18. [DOI] [PubMed] [Google Scholar]
- 49.Lange S, Delbro DS, Jennische E, et al. The role of the Lps gene in experimental ulcerative colitis in mice. APMIS 1996;104:823–33. [DOI] [PubMed] [Google Scholar]
- 50.Kreuzpaintner G, Horstkotte D, Heyll A, et al. Increased risk of bacterial endocarditis in inflammatory bowel disease. Am J Med 1992;92:391–5. [DOI] [PubMed] [Google Scholar]
- 51.Macpherson AJ, Gatto D, Sainsbury E, et al. A primitive T cell-independent mechanism of intestinal mucosal IgA responses to commensal bacteria. Science 2000;288:2222–6. [DOI] [PubMed] [Google Scholar]


