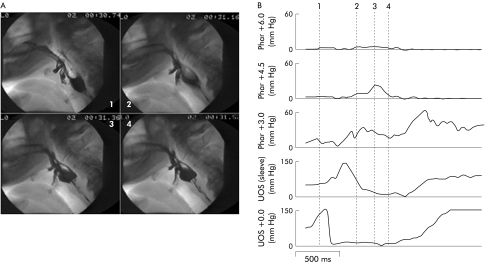
Figure 6.
Videoradiographic frames (A) and corresponding pharyngeal manometry (B) in a disease control with neurogenic dysphagia due to brainstem stroke. The broken vertical lines in (B) correspond to the time of each of the four radiographs. Note the marked delay in onset of sphincter relaxation (channel 4) seen to occur after the onset of the hypopharyngeal pressure rise (channel 3). Compare this temporal relationship with fig 3 ▶.

