Abstract
Background: Taurolithocholate induced cholestasis is a well established model of drug induced cholestasis with potential clinical relevance. This compound impairs bile salt secretion by an as yet unclear mechanism.
Aims: To evaluate which step/s of the hepatocellular bile salt transport are impaired by taurolithocholate, focusing on changes in localisation of the canalicular bile salt transporter, Bsep, as a potential pathomechanism.
Methods: The steps in bile salt hepatic transport were evaluated in rats in vivo by performing pharmacokinetic analysis of 14C taurocholate plasma disappearance. Bsep transport activity was determined by assessing secretion of 14C taurocholate and cholyl-lysylfluorescein in vivo and in isolated rat hepatocyte couplets (IRHC), respectively. Localisation of Bsep and F-actin were assessed both in vivo and in IRHC by specific fluorescent staining.
Results: In vivo pharmacokinetic studies revealed that taurolithocholate (3 μmol/100 g body weight) diminished by 58% canalicular excretion and increased by 96% plasma reflux of 14C taurocholate. Analysis of confocal images showed that taurolithocholate induced internalisation of Bsep into a cytosolic vesicular compartment, without affecting F-actin cytoskeletal organisation. These effects were reproduced in IRHC exposed to taurolithocholate (2.5 μM). Preadministration of dibutyryl-cAMP, which counteracts taurolithocholate induced impairment in bile salt secretory function in IRHC, restored Bsep localisation in this model. Furthermore, when preadministered in vivo, dibutyryl-cAMP accelerated recovery of both bile flow and bile salt output, and improved by 106% the cumulative output of 14C taurocholate.
Conclusions: Taurolithocholate impairs bile salt secretion at the canalicular level. Bsep internalisation may be a causal factor which can be prevented by dibutyryl-cAMP.
Keywords: cholestasis, taurolithocholate, Bsep, actin cytoskeleton, dibutyryl-cAMP
Taurolithocholate (TLC) and other monohydroxylated bile salts (BS) were suggested to play a role in the liver dysfunction that occurs in primary biliary cirrhosis,1 Byler’s disease,2 total parenteral nutrition induced cholestasis,3 and neonatal cholestasis.4 TLC induced cholestasis is also a useful experimental model of drug induced cholestasis.5–8
TLC induces an acute reversible cholestasis in the rat,5 with a bile flow (BF) nadir at 15–20 minutes of TLC administration. After that, BF recovers slowly, reaching control values at 24–30 hours.5 TLC diminishes both BS independent and BS dependent BF. Diminution in the former has been proposed to be due to a reduction in the water permeability of the canalicular membrane (CM),9 and to inhibition of the Na+/K+-ATPase pump, a key driving force of BS independent BF.10 Impairment in glutathione biliary excretion,11 probably associated with a decrease in the activity and/or localisation of Mrp2, a putative glutathione transporter,12 has also been postulated.13
In contrast, the mechanisms by which TLC impairs BS excretion remain to be elucidated. Taurine or glycine conjugated BS are mainly taken up by the hepatocyte by a Na+ dependent mechanism, mediated by the Na+ taurocholate cotransporting polypeptide.14 Their canalicular secretion, which is the rate limiting step in their overall transport from blood to bile, is mainly mediated by an ATP dependent transporter, the “bile salt export pump” (Bsep), a homologue of the MDR P-glycoproteins belonging to the superfamily of ATP binding cassette (ABC) transporters.15
Characterisation of the step/s in BS transport that are altered by TLC remain to be ascertained, and this represents one of the aims of our study. In addition, recent evidence that internalisation of another canalicular ABC transporter, Mrp2, occurs in different models of experimental cholestasis, including oestradiol-17β-d-glucuronide16 and TLC itself,13 has prompted us to examine the role of this pathomechanism in TLC induced BS secretory failure, by evaluating whether Bsep suffers a similar relocalisation. Finally, to help to establish a causal link between a putative alteration of Bsep localisation and BS secretory dysfunction induced by TLC, we have also analysed the ability of cAMP to prevent concurrently changes in both parameters caused by the cholestatic agent; cAMP was shown to stimulate targeting of transporters to the CM17–19 and to counteract TLC induced impairment in BS secretory function in the isolated rat hepatocyte couplet (IRHC) model.20
METHODS
Materials
TLC (sodium salt), 3α-hydroxysteroid dehydrogenase, Leibovitz-15 culture medium, Phalloidin-FITC, DMSO, and dibutyryl-cAMP (DB-cAMP) were from Sigma Chemical Co. (St Louis, Missouri, USA). 14C taurocholate (14C-TC) was from New England Nuclear (Boston, Massachusetts, USA). Cholyl-lysylfluorescein (CLF) was kindly provided by Dr Charles O Mills (Birmingham, UK). Collagenase type A from Clostridium histolyticum was from Gibco (Paisley, UK). All other reagents were of the highest grade available.
Animals
Adult male Wistar rats weighing 300–350 g were used throughout. Animals were maintained on a standard diet and water ad libitum, under a constant 12 hour light/12 hour dark cycle. Protocols were approved according to the Animal Scientific Procedure Act 1986.
“In vivo” studies
Surgical procedures
Animals were anaesthetised with sodium pentobarbital (50 mg/kg intraperitoneally) and anaesthesia maintained throughout. The carotid artery and femoral vein were catheterised with a PC-50 polyethylene tubing, and the common bile duct with a PE-10 polyethylene catheter (Intramedic, Clay Adams, Parsippany, New Jersey, USA). Body temperature was maintained at 37.5–38.0°C with a heating lamp.
Experimental procedures
In the bile secretion studies, TLC (3 μmol/100 g body weight) or vehicle (10% bovine serum albumin in saline) in controls was administered intravenously 30 minutes after basal bile collection. Bile was then collected at 20 minute intervals for 100 minutes. Next, animals were killed by exsanguination, and livers were removed and weighed. In experiments evaluating prevention of cholestasis by cAMP, DB-cAMP (10 mg/kg body weight intravenously), a permeant cAMP analogue, was administered five minutes prior to TLC administration.
In 14C-TC biliary excretion studies, the radioisotope (0.25 μCi/100 g body weight) was injected intravenously, either 20 minutes or 100 minutes after the TLC pulse. Pharmacokinetic analysis of 14C-TC plasma decay was carried out at 100 minutes; by that time, a normal BS excretion was reached, and 14C-TC kinetics better reflect defective transport capability rather than competition with the initially retained BS. Blood samples were collected every 0.5–3 minutes for 20 minutes, and bile samples every two minutes for 20 minutes.
Analytical procedures
BF was measured gravimetrically, assuming a bile density of 1.0 g/ml. Total BS were determined by the 3α-hydroxysteroid dehydrogenase procedure.21
Fractional 14C-TC transfer rates were assessed by performing plasma disappearance kinetic analysis. Plasma 14C-TC concentration data, plotted against time, were fitted to a biexponential equation; a preliminary triexponential fit failed to show any improvement according to Akaike’s criterion.22 Therefore, a two compartmental model with an open ended biliary outflow, as described by Richards and colleagues,23 was considered physiologically realistic, and employed to calculate the fractional transfer rates for hepatic uptake (r12), sinusoidal efflux (r21), and canalicular excretion (r3).
14C-TC in plasma and bile was measured in a liquid scintillation counter (RackBeta, Pharmacia Wallac Oy, Finland). 14C-TC hepatic content was measured in supernatants of homogenates obtained after centrifugation of the major lobe (10% w/v in saline).
Confocal microscopy and image analysis
Liver samples were frozen in isopentane precooled in liquid nitrogen and stored at −80°C. Liver slices (5 μm) were prepared with a Zeiss Microm HM5000 microtome cryostat, air dried, and fixed with 3% paraformaldehyde in phosphate buffered saline (PBS). For Bsep labelling, tissue sections were incubated overnight with a rabbit antimouse Bsep (1:100) antibody (Kamiya, Seattle, Washington, USA), and further incubated with Cy2 conjugated donkey antirabbit IgG (Jackson ImmunoResearch, West Grove, Pennsylvania, USA) (1:100, one hour). Slices were mounted with Vectashield mounting medium (Vector, Burlingame, California, USA), and analysed with a confocal microscope (True Confocal Scanner Leica TCS SP II). For actin labelling, fixed tissue sections were incubated with phalloidin-FITC (10 μg/ml in PBS, 20 minutes), mounted, and analysed with a confocal microscope, as described for Bsep. For double labelling, tissue sections were exposed to phalloidin-FITC after performing Bsep staining, as described above.
Densitometric analysis of confocal pictures was performed as previously described24 using the software Scion Image β4.02 for Windows (Scion Corporation, USA). Fluorescence intensity was measured over a line vertical to the canaliculus (length 8 μm). For each section, data from 15 different canaliculi were collected and used for statistical comparison. Data were reproduced in three independent liver preparations. Each measurement was normalised to the sum of all intensities of the respective measurement. Variances from different conditions were compared using the Mann-Whitney test.
Studies in IRHC
Couplet isolation, enrichment, and culture
IRHC were obtained from rat liver according to the two step collagenase perfusion procedure described by Wilton and colleagues,25 adapted from Gautam and colleagues,26 and further enriched by centrifugal elutriation.27 The final preparation, containing 73 (5)% of IRHC with viability >95%, as assessed by the trypan blue exclusion test, was plated in L-15 medium containing penicillin/streptomycin onto 35 mm plastic culture dishes (2 ml/dish) at a density of 0.5×10⁵ units/ml and incubated at 37°C for 4.5–5 hours.
Assessment of BS secretory function in IRHC
BS secretory function was evaluated by carrying out the canalicular vacuolar accumulation (cVA) of CLF test which assesses the percentage of couplets (>50 per experiment) displaying CLF in their canalicular vacuoles.25,28 Couplets were exposed to TLC (2.5 μM in 2 μl of DMSO) for 20 minutes; at this concentration neither TLC nor its vehicle DMSO had any effect on cell membrane integrity or viability, as assessed by release of lactate dehydrogenase and the trypan blue exclusion test, respectively (data not shown). Then, TLC was removed by washing twice with L-15, and cells were exposed to CLF (2 μM) for 15 minutes. Next, CLF was removed, and cVA of CLF assessed using an inverted fluorescence microscope (Olympus IMT2-RFL; Olympus Optical Ltd, London, UK). A separated group of couplets were pretreated with DB-cAMP (10 μM, 30 minutes) and further exposed to TLC.
In some experiments, intracellular CLF fluorescence was quantified. Microphotographs from randomly chosen vision fields were digitalised, and CLF fluorescence in the cellular body quantified by densitometry, using an image analysis program (Openlab; Improvision, Coventry, UK). Intracellular fluorescence intensity was determined by subtracting the total fluorescence in the couplets (∼30), divided by the total couplet area, from the value obtained in the canalicular vacuole alone, divided by the vacuolar area.
Assessment of Bsep and F-actin localisation
For Bsep immunofluorescent staining, cells were fixed with 4% paraformaldehyde in PBS and incubated with a polyclonal anti-Bsep rabbit antibody (1:250, 2 hours), followed by incubation with FITC labelled goat antirabbit Ig G (1:100, 40 minutes) (Zymed, San Francisco, USA). Cells were then mounted and examined by fluorescence microscopy (Zeiss Axiovert 350TV, equipped with plan neofluar lenses).
Phalloidin-FITC labelling was employed to visualise F-actin using a modification of the method described by Knutton and colleagues,29 as described by Wilton and colleagues.28 Cells were then mounted and examined by fluorescence microscopy, as described for Bsep.
Monochrome images (20–30 per group) were taken in 1 μm steps and captured on a CCD video camera (Hamamatsu Photonic Sys. Corp., Hamamatsu City, Japan). Out of focus flair was removed using a deconvolution program (Micro-Tome Mac; Vaytek, Fairfield, Illinois, USA). Fluorescence was quantified using Openlab software (Improvision).
Statistical analysis
Results are expressed as mean (SEM). The unpaired t test was used for comparison between the control and TLC groups. One way ANOVA, followed by the Newman-Keuls test, were performed for multiple comparisons. Values of p<0.05 were considered to be statistically significant.
RESULTS
In vivo effect of TLC on basal BF and BS secretion
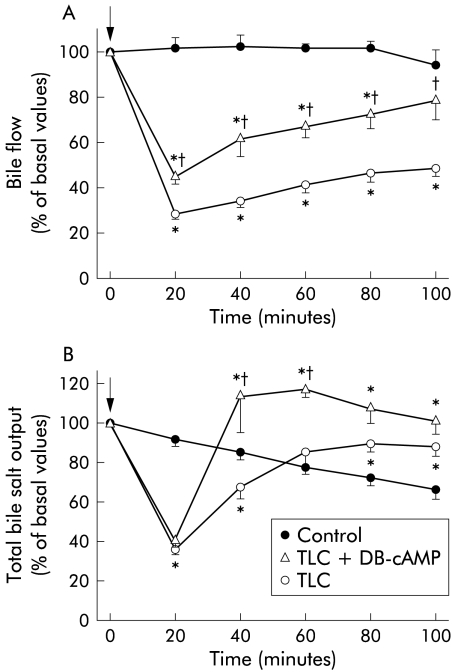
Figure 1▶ shows the changes in BF and total BS output after TLC administration. BF was rapidly diminished, showing a nadir at 20 minutes. After that, BF recovered slowly, remaining significantly lower than controls throughout the experiment. In contrast, BS output was normalised by 60 minutes of TLC administration, and even overcame control BS output from this time onwards.
Figure 1.
Time course of changes in bile flow (A) and bile salt output (B) in rats treated with taurolithocholate (TLC; 3 μmol/100 g body weight intravenously), with or without preadministration of dibutyril-cAMP (DB-cAMP; 10 mg/kg body weight intravenously). Control rats, who received only TLC vehicle, are also shown. Arrows indicate either TLC or vehicle administration. Values are expressed as mean (SEM) for six animals in the control and TLC groups, and three animals in the TLC+DB-cAMP group. *Significantly different from the control group (p<0.05); †significantly different from the TLC group (p<0.05).
The capacity of DB-cAMP to prevent TLC induced cholestasis was tested. Impairment in BF was partially but significantly prevented by DB-cAMP; acceleration in the recovery of this parameter following the initial drop was apparent, reaching control values at 100 minutes. Whereas the initial impairment in BS output was not prevented by DB-cAMP, this compound induced a rapid recovery of this parameter, reaching values even higher than those of the control group from 40 minutes of TLC administration onwards.
Biliary excretion and pharmacokinetic analysis of 14C-TC
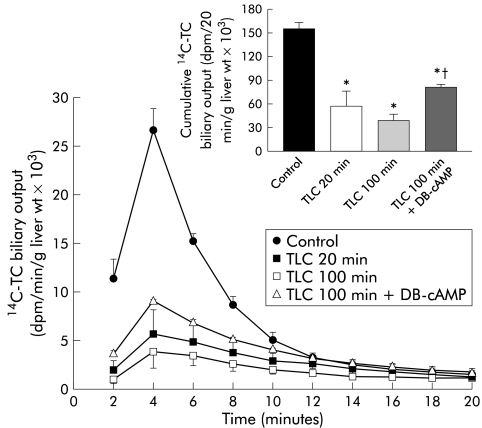
14C-TC biliary output was significantly impaired at both 20 minutes and 100 minutes of TLC treatment (fig 2▶), which was reflected in a reduction in the cumulative biliary excretion of the radioactive compound (fig 2▶, inset). Concomitantly, the final hepatic 14C- TC content was significantly increased (control 2.1 (0.6); TLC 20 minutes 24.1 (5.3); TLC 100 minutes 27.9 (5.5) dpm/μg liver weight; both significantly different (p<0.01) from the control). DB-cAMP pretreatment significantly counteracted the decrease in biliary excretion of 14C-TC, administered 100 minutes after TLC. Consequently, cumulative biliary excretion of the radioactive compound was enhanced by 106% (fig 2▶, inset).
Figure 2.
Biliary excretion of 14C taurocholate (14C-TC; 0.25 μCi/100 g body weight) in control rats and in taurolithocholate (TLC; 3 μmol/100 g intravenously) treated rats, either 20 minutes or 100 minutes after administration of the cholestatic agent. Biliary excretion of 14C- TC, administered 100 minutes after TLC injection in rats pretreated with dibutyril-cAMP (DB-cAMP; 10 mg/kg body weight intravenously) is also shown. In all experimental groups, 14C-TC was administered as a single intravenous dose at the indicated times, whereas in controls 14C-TC was administered 100 minutes after vehicle injection. Inset shows cumulative biliary output of 14C-TC 20 minutes after the intravenous pulse of the radioactive compound in the above mentioned experimental groups. Values are expressed as mean (SEM) for four animals per group. *Significantly different from the control group (p<0.05); †significantly different from the TLC (100 minutes) group (p<0.05).
Pharmacokinetic analysis of 14C-TC plasma disappearance 100 minutes after TLC administration is shown in table 1▶. Whereas hepatic 14C-TC uptake (r12) was not modified, TLC increased by 96% its sinusoidal efflux (r21) and decreased by 58% its canalicular excretion (r3). This alteration in r3, together with the increased hepatic 14C-TC retention in TLC treated rats, suggests that canalicular transport rather than sinusoidal uptake was the principal step impaired.
Table 1 .
Effect of taurolithocholate (TLC) treatment on the intrinsic transfer rates derived from bicompartmental analysis of plasma decay of 14C-taurocholate (TC)†
| Intrinsic transfer rates‡ (/min) |
|||
|---|---|---|---|
| r12 | r21 | r3 | |
| Control | 1.108 (0.056) | 0.071 (0.008) | 0.137 (0.013) |
| TLC | 1.285 (0.108) | 0.139 (0.016)** | 0.058 (0.008)** |
†Values are mean (SEM) for five animals per group.
‡The fractional transfer rates derived from the compartmental analysis of 14C-TC plasma decay, r12 (uptake), r21 (plasma reflux), and r3 (canalicular excretion), were obtained according to standard equations for an open bicompartmental model (Richards’ model).
**p<0.005 compared with the control group.
Effect of TLC on Bsep and F-actin localisation in vivo
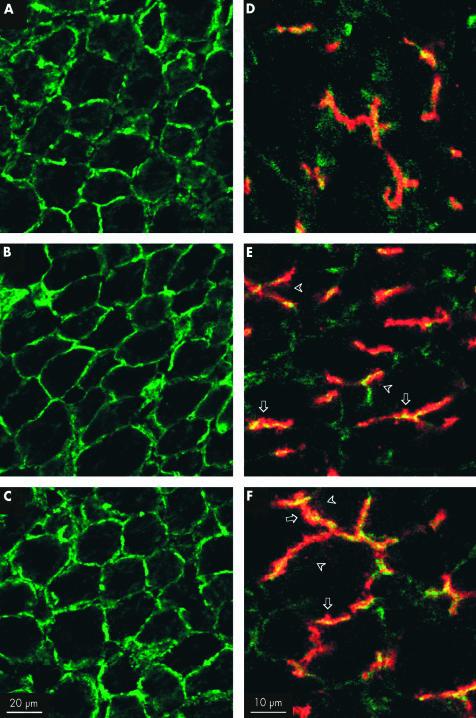
Changes in Bsep localisation and F-actin cytoskeleton organisation were analysed in situ by laser scanning confocal microscopy, both 20 minutes and 100 minutes after TLC administration.
Changes in F-actin distribution are shown in fig 3 (A–C)▶. In control rats, the F-actin cytoskeleton displayed a typical regular polygonal arrangement, representing the cortical F- actin network. No difference was apparent between controls (fig 3A▶) and TLC treated animals, either 20 minutes or 100 minutes after TLC administration (fig 3B, C▶, respectively).
Figure 3.
(A–C) Confocal images showing the in vivo effect of taurolithocholate (TLC; 3 μmol/100 g intravenously) on F-actin cytoskeleton organisation. In solvent treated control rats (A), the F-actin cytoskeleton showed a predominant pericanalicular localisation. No alteration in this normal distribution was observed in TLC treated rats, either 20 minutes or 100 minutes after TLC administration (B and C, respectively). (D–F) In vivo effect of TLC on bile salt export pump (Bsep) immunofluorescent localisation (red). F-actin staining (green) was used to demarcate the bile canaliculus, and yellow staining indicates colocalisation of both Bsep and F-actin. In solvent treated control rats (D), Bsep was mainly confined to the canaliculus. Twenty minutes after TLC administration (E), the cholestatic agent disrupted the normal canalicular localisation of Bsep, visualised as an increment in red staining outside the limits of the canaliculus (arrows) and in intracellular vesicle-like structures (arrowheads). The same phenomenon was observed 100 minutes after TLC administration (F) but an increased number of Bsep containing vesicular structures, deeper inside the hepatocytes, was apparent. Pictures are representative images from at least three independent experiments per group.
Figure 3▶ also depicts changes in Bsep localisation (red) following TLC treatment (D–F). Costaining with F-actin (green), which demarcates the canalicular space, is also shown (yellow staining indicates colocalisation). In control preparations, Bsep was mainly confined to the canalicular space (fig 3D▶). Twenty minutes after TLC administration, the cholestatic agent altered the localisation of Bsep (fig 3E▶), which is visualised as an increased red staining outside the canaliculus limits (fig 3E▶, arrows) and as an incremented number of Bsep containing vesicular-like structures in the subapical area (fig 3E▶, arrowheads). One hundred minutes after TLC administration, the alteration in Bsep localisation seemed to be even more severe, as an increased number of Bsep containing vesicular structures was found, deeper inside the hepatocytes (fig 3F▶, arrowheads).
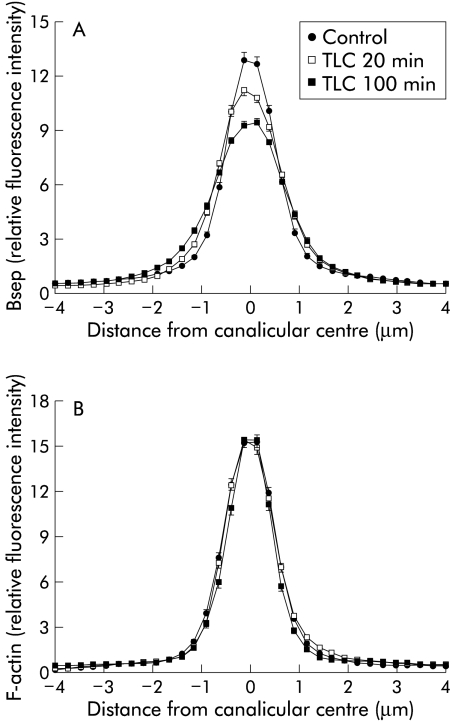
Densitometric analysis of Bsep fluorescence profiles (fig 4A▶) revealed a statistically significant broadening of the canalicular Bsep peak only at 100 minutes of TLC administration, although a trend towards internalisation of Bsep was also evident after 20 minutes of TLC administration. In contrast, a similar analysis of F-actin distribution revealed no changes (fig 4B▶).
Figure 4.
Densitometric analysis of fluorescence profiles of bile salt export pump (Bsep) (A) and F-actin (B). Fluorescence distribution was recorded along a line (from −4 to +4 μm) vertical to the canaliculi, under control conditions, and 20 minutes or 100 minutes after taurolithocholate (TLC) administration. Mean (SEM) of 15 measurements in each of the three individual experiments for each condition in fig 3▶ are shown. Statistical analysis of the fluorescence profiles of Bsep (A) showed that the TLC 100 minutes group was different from the control and TLC 20 minutes groups (p<0.05, see Methods for statistical analysis). F-actin distribution (B) was not different between the groups.
Effect of TLC on Bsep localisation and function in IRHC
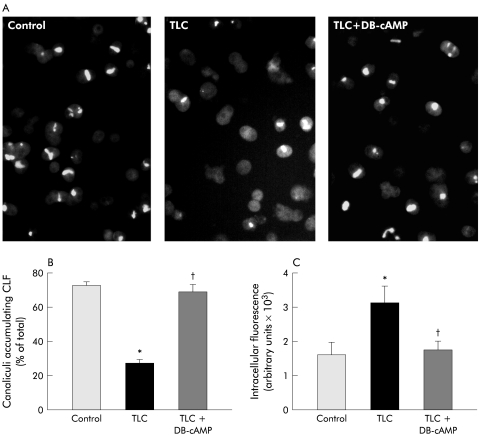
Figure 5▶ shows typical fluorescence images of IRHC accumulating CLF in their canalicular vacuoles (A), cVA of CLF values (B), and CLF intracellular content (C) in control and TLC treated IRHC, pretreated or not with DB-cAMP.
Figure 5.
(A) Representative microphotographs showing accumulation of the fluorescent bile salt analogue cholyl-lysylfluorescein (CLF) in control hepatocyte couplets, and in taurolithocholate (TLC; 2.5 μM, 20 minutes) treated couplets, which were pretreated or not with dibutyryl-cAMP (DB-cAMP; 10 μM, 30 minutes). (B) Quantification of the percentage of total couplets (>50) displaying visible CLF fluorescence in their canalicular vacuoles. (C) Quantification of total pixel intensity of CLF fluorescence in the cellular body of 30 hepatocyte couplets, as a measure of intracellular CLF content. Values are expressed as mean (SEM) obtained from four independent cell preparations. *Significantly different from the control group (p <0.05); †significantly different from the TLC group (p<0.05).
Under control conditions, 71.8 (2.4)% of couplets exhibited cVA of CLF. TLC decreased this value by 63%, and DB-cAMP pretreatment virtually normalised this parameter, in agreement with a previous report by our group.20 The decrease in cVA of CLF induced by TLC was accompanied by a 67% increase in CLF intracellular content, further suggesting that BS canalicular transfer is the main step in the overall BS transport, affected by TLC; DB- cAMP also counteracted this alteration.
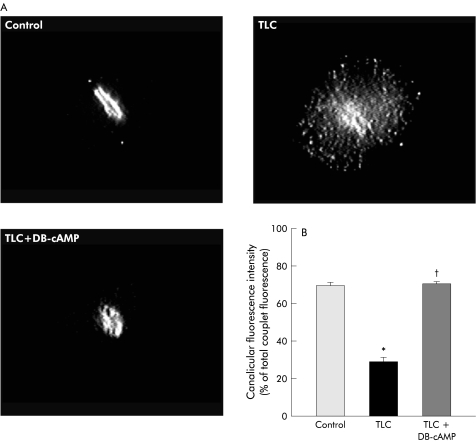
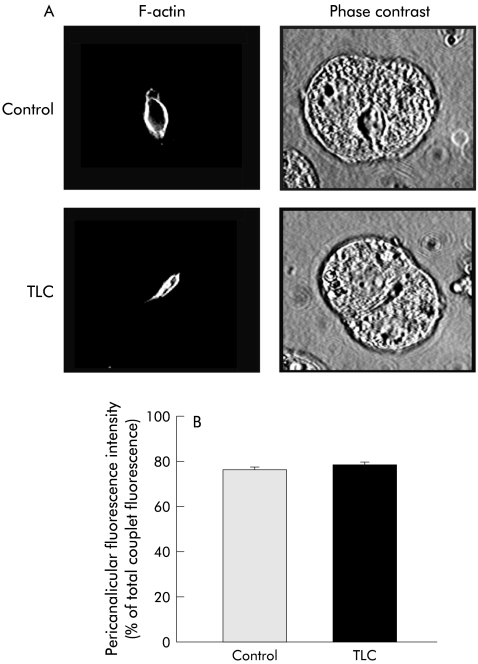
Bsep immunofluorescent staining in IRHC is depicted in fig 6▶. Under control conditions, Bsep was mainly confined to the CM. TLC induced marked Bsep relocalisation into vesicles localised in the pericanalicular area and, more sparsely, over the remaining cell body. Consequently, the proportion of fluorescence intensity present in CM was diminished by 42% (p<0.005). DB-cAMP pretreatment virtually normalised Bsep localisation. In contrast, no change in the normal pericanalicular localisation of F-actin or in IRHC topography (as visualised by phase contrast microscopy) was found in TLC treated couplets (fig 7▶).
Figure 6.
(A) Representative fluorescence microphotographs showing localisation of the bile salt export pump (Bsep) in control hepatocyte couplets and in taurolithocholate (TLC; 2.5 μM, 20 minutes) treated couplets, which were pretreated or not with dibutyryl-cAMP (DB-cAMP; 10 μM, 30 minutes). Quantification of Bsep fluorescence intensity in the canalicular area, expressed as a percentage of total (canalicular membrane plus cell body) fluorescence intensity, is also shown (B). *Significantly different from the control group (p<0.05). †significantly different from the TLC group (p<0.05).
Figure 7.
(A) Representative fluorescence microphotographs showing phalloidin-FITC labelled F-actin localisation and phase contrast images in control hepatocyte couplets, and in taurolitho- cholate (TLC; 2.5 μM, 20 minutes) treated couplets, which were pretreated or not with dibutyryl-cAMP (DB-cAMP; 10 μM, 30 minutes). Quantification of F-actin fluorescence intensity in the pericanalicular area, expressed as a percentage of total (pericanalicular area plus cell body) fluorescence intensity is also shown (B).
DISCUSSION
The aim of this study was to provide insight into the mechanisms involved in TLC induced BS secretory failure.
TLC induced in vivo an acute transient diminution in total BS output, reaching control values at 60 minutes (see fig 1▶). This recovery however may not necessarily reflect complete normalisation of the hepatic handling of BS; it is also possible that BS that had been retained in the liver during the peak of cholestasis could have generated a compensating concentration gradient, high enough to counteract a partial long lasting impairment of the BS transport systems. Our data support this last possibility. Pharmacokinetic studies on 14C-TC hepatic handling which were performed at the time biliary BS output was fully recovered, showed that and the fractional constant of 14C-TC canalicular transfer, r3, was decreased by 56% in TLC treated rats (see table 1▶). In contrast, the fractional constant of 14C-TC uptake, r12, was unaffected by TLC. This was in line with our finding that the amount of 14C-TC retained in liver tissue in vivo was significantly higher in TLC treated rats, and that the fluorescent BS analogue, CLF, was retained intracellularly at a higher level in TLC treated IRHC (see fig 5▶). Furthermore, no recovery of 14C-TC excretion was observed 100 minutes after TLC injection, despite the fact that total BS excretion had been normalised by this time, indicating maintained impairment of BS transport systems, compared with that occurring at 20 minutes (see fig 2▶).
Our results indicate that Bsep internalisation from the CM into intracellular vesicular structures (see figs 3▶ and 6▶) can be a contributing factor in BS secretory dysfunction. This contention was supported further by studies where an association between restoration of Bsep localisation by DB-cAMP and its ability to normalise Bsep function, as impaired by TLC, was analysed. Our data in IRHC showing that DB-cAMP was instrumental in restoring both Bsep localisation and function, as assessed by cVA of CLF, clearly support a key role of Bsep relocation in TLC induced BS secretory impairment. A similar beneficial effect of DB- cAMP on Bsep function was confirmed in vivo by studies showing that this second messenger significantly accelerated recovery of total bile salt output after its initial drop induced by TLC (see fig 1▶), and improved hepatic ability of clearing out into bile a tracer dose of 14C-TC.
Redistribution of membrane transporters induced by TLC may not be restricted to Bsep but may also involve other carriers such as the multispecific organic anion carrier Mrp2, as reported by Beuers and colleagues13; this study showed a functional association between Mrp2 relocation and impaired secretory function of the Mrp2 substrate, dinitrophenyl-S- glutathione. Furthermore, TLC was shown to induce redistribution of CM bound proteins in cultured hepatocytes, as revealed by ultrastructural studies.30
The mechanism by which TLC induced Bsep internalisation cannot be directly addressed from our results. A microtubule dependent vesicular pathway involved in targeting of CM transporters from a subapical compartment to their membrane domain, which shares the transcytotic pathway with the polymeric IgA receptor, has been reported to exist.31 The reverse phenomenon—that is, endocytosis of CM protein components—was recently demonstrated,32 and it is likely to account for transporter internalisation. Therefore, it is conceivable that a balance between exocytic insertion and endocytic internalisation of CM transporters exists, and that TLC may disrupt this balance either by inhibiting insertion or by stimulating internalisation, or both. The first possibility is likely as TLC impaired transcytotic microtubule dependent vesicular transport both in vivo33 and in IRHC.34 However, other possibilities should also be considered. Decreased CM fluidity due to the increase in cholesterol content induced by TLC,35 which was described to determine membrane fusibility properties,36 may also affect insertion of CM transport proteins, including Bsep. In contrast, disruption of actin cytoskeleton organisation, which was shown to alter sorting19 and maintenance37 of transporters in the CM, is unlikely since no change in F-actin distribution was observed following TLC administration either in vivo or in IRHC. However, this finding does not exclude the possibility that more subtle alterations in the actin cytoskeleton occur at a functional or molecular level, or both. Whatever the mechanism by which internalisation of Bsep occurs, factors known to stimulate insertion of this transporter into its membrane domain would be expected to help restore the insertion/internalisation balance, thus preventing disruption of its localisation; this was shown here to be the case for DB-cAMP (see fig 6▶). A similar phenomenon may explain the protective effect against TLC induced cholestasis and BS secretory failure of non-cholestatic BS-like taurocholate,38 tauroursodeoxycholate,20,38,39 which were both shown to stimulate vesicular Bsep targeting.17,40
In addition to impaired Bsep localisation, other mechanisms by which TLC alters normal transport and/or retention of BS at the hepatocanalicular level should be considered, and may well act in concert, namely: (i) the decrease in CM fluidity induced by TLC35; this may affect the functional BS transporter capacity, as has been shown to occur elsewhere for 14C-TC transport in CM vesicles41; (ii) impaired intracellular BS retention due to reduced binding to cytosolic proteins; reversible displacement of BS from their binding to glutathione S- transferase (ligandin) by TLC has been shown to occur,42 and this may account for the increase in intrinsic constant of liver to plasma sinusoidal 14C-TC efflux (r21) (see table 1▶); (iii) disruption of tight junctional integrity induced by TLC; this was described under similar conditions both in vivo43 and in IHRC,44 and may cause BS to diffuse back to plasma across the leaky intercellular junctional complex, thus contributing to their decreased output.
In summary, TLC impairs biliary BS secretion by affecting selectively its canalicular transport, an effect due, at least in part, to Bsep relocation into the submembranous compartment. As a similar phenomenon was observed in this13 and other forms of cholestasis16,37 for another canalicular transporter, Mrp2, and as these changes were always accompanied by impaired transport function, our findings indicate that endocytic carrier internalisation may be a common feature in cholestasis, which may account for the impaired transport of cholephilic compounds in such conditions. Clearly, further work will be required to substantiate this hypothesis.
Acknowledgments
This work was supported by grants from CONICET, the Royal Society, Fundación Antorchas and Ministerio de Salud de la Nación (to MGR), Universidad Nacional de Rosario (to FAC and ADM), the Sir Jules Thorn Charitable Trust (to PM), and by the PHS grant GM55343 (to MV).
Abbreviations
TLC, taurolithocholate
BS, bile salts
BF, bile flow
CM, canalicular membrane
Bsep, bile salt export pump
ABC, ATP binding cassette
IRHC, isolated rat hepatocyte couplet
DB-cAMP, dibutyryl- cAMP
TC, taurocholate
CLF, cholyl-lysylfluorescein
PBS, phosphate buffered saline
cVA, canalicular vacuolar accumulation
This article is dedicated to the memory of Professor Roger Coleman, 13 August 1938–14 January 2003.
Presented in part at the Biennial Meeting of the International Association for the Study of the Liver (IASL), Madrid, Spain, April 2002, and published in abstract form ( J Hepatol 2002;36(Suppl 1):253 ).
REFERENCES
- 1.Murphy GM, Jansen FH, Billing BH. Unsaturated monohydroxy bile acids in cholestatic liver disease. Biochem J 1972;129:491–4. [DOI] [PMC free article] [PubMed] [Google Scholar]
- 2.Linarelli LG, Williams CN, Phillips MJ. Byler’s disease: fatal intrahepatic cholestasis. J Pediatr 1972;81:484–92. [DOI] [PubMed] [Google Scholar]
- 3.Fouin-Fortunet H, Le Quernec L, Erlinger S, et al. Hepatic alterations during total parenteral nutrition in patients with inflammatory bowel disease: a possible consequence of lithocholate toxicity. Gastroenterology 1982;82:932–7. [PubMed] [Google Scholar]
- 4.Setchell KD, Schwarz M, O’Connell NC, et al. Identification of a new inborn error in bile acid synthesis: mutation of the oxysterol 7alpha-hydroxylase gene causes severe neonatal liver disease. J Clin Invest 1998;102:1690–703. [DOI] [PMC free article] [PubMed] [Google Scholar]
- 5.Javitt NB, Emerman S. Effect of sodium taurolithocholate on bile flow and bile acid excretion. J Clin Invest 1968;47:1002–14. [DOI] [PMC free article] [PubMed] [Google Scholar]
- 6.Priestly BG, Cote MG, Plaa GL. Biochemical and morphological parameters of taurolithocholate-induced cholestasis. Can J Physiol Pharmacol 1971;49:1078–91. [DOI] [PubMed] [Google Scholar]
- 7.King JE, Schoenfield LJ. Cholestasis induced by sodium taurolithocholate in isolated hamster liver. J Clin Invest 1971;50:2305–12. [DOI] [PMC free article] [PubMed] [Google Scholar]
- 8.Layden TJ, Boyer JL. Taurolithocholate-induced cholestasis: taurocholate, but not dehydrocholate, reverses cholestasis and bile canalicular membrane injury. Gastroenterology 1977;73:120–8. [PubMed] [Google Scholar]
- 9.Kakis G, Yousef IM. Pathogenesis of lithocholate- and taurolithocholate-induced cholestasis in rats. Gastroenterology 1978;75:595–607. [PubMed] [Google Scholar]
- 10.Reichen J, Paumgartner G. Inhibition of hepatic Na+, K+ -adenosine triphosphatase in taurolithocholate-induced cholestasis in the rat. Experientia 1979;35:1186–8. [DOI] [PubMed] [Google Scholar]
- 11.Bouchard G, Tuchweber B, Yousef IM. Bile salt independent flow during bile salt- induced choleresis and cholestasis in the rat: role of biliary thiol secretion. Liver 2000;20:27–37. [DOI] [PubMed] [Google Scholar]
- 12.Paulusma CC, van Geer MA, Evers R, et al. Canalicular multispecific organic anion transporter/multidrug resistance protein 2 mediates low-affinity transport of reduced glutathione. Biochem J 1999;338:393–401. [PMC free article] [PubMed] [Google Scholar]
- 13.Beuers U, Bilzer M, Chittattu A, et al. Tauroursodeoxycholic acid inserts the apical conjugate export pump, Mrp2, into canalicular membranes and stimulates organic anion secretion by protein kinase C-dependent mechanisms in cholestatic rat liver. Hepatology 2001;33:1206–16. [DOI] [PubMed] [Google Scholar]
- 14.Inoue M, Kinne R, Tran T, et al. Taurocholate transport by rat liver sinusoidal membrane vesicles: evidence of sodium cotransport. Hepatology 1982;2:572–9. [DOI] [PubMed] [Google Scholar]
- 15.Gerloff T, Stieger B, Hagenbuch B, et al. The sister of P-glycoprotein represents the canalicular bile salt export pump of mammalian liver. J Biol Chem 1998;273:10046–50. [DOI] [PubMed] [Google Scholar]
- 16.Mottino AD, Cao J, Veggi LM, et al. Altered localization and activity of canalicular Mrp2 in estradiol-17β-D-glucuronide-induced cholestasis. Hepatology 2002;35:1409–19. [DOI] [PubMed] [Google Scholar]
- 17.Kipp H, Pichetshote N, Arias IM. Transporters on demand: intrahepatic pools of canalicular ATP binding cassette transporters in rat liver. J Biol Chem 2001;276:7218–24. [DOI] [PubMed] [Google Scholar]
- 18.Roelofsen H, Soroka CJ, Keppler D, et al. Cyclic AMP stimulates sorting of the canalicular organic anion transporter (Mrp2/cMoat) to the apical domain in hepatocyte couplets. J Cell Sci 1998;111:1137–45. [DOI] [PubMed] [Google Scholar]
- 19.Roma MG, Milkiewicz P, Elias E, et al. Control by signaling modulators of the sorting of canalicular transporters in rat hepatocyte couplets: role of the cytoskeleton. Hepatology 2000;32:1342–56. [DOI] [PubMed] [Google Scholar]
- 20.Milkiewicz P, Roma MG, Elias E, et al. Hepatoprotection with tauroursodeoxycholate and β-muricholate against taurolithocholate induced cholestasis: involvement of signal transduction pathways. Gut 2002;51:113–19. [DOI] [PMC free article] [PubMed] [Google Scholar]
- 21.Talalay P. Enzymatic analysis of steroid hormones. Methods Biochem Anal 1960;8:119–43. [DOI] [PubMed] [Google Scholar]
- 22.Yamaoka K, Nakagawa T, Uno T. Application of Akaike’s information criterion (AIC) in the evaluation of linear pharmacokinetic equations. J Pharmacokinet Biopharm 1978;6:165–75. [DOI] [PubMed] [Google Scholar]
- 23.Richards TG, Tindell VR, Young A. A modification of the bromosulphthalein liver function test to predict the dye content of the liver and bile. Clin Sci 1959;18:499–511. [Google Scholar]
- 24.Kubitz R, D’Urso D, Keppler D, et al. Osmodependent dynamic localization of the multidrug resistance protein 2 in the rat hepatocyte canalicular membrane. Gastroenterology 1997;113:1438–42. [DOI] [PubMed] [Google Scholar]
- 25.Wilton JC, Coleman R, Lankester DJ, et al. Stability and optimization of canalicular function in hepatocyte couplets. Cell Biochem Funct 1993;11:179–85. [DOI] [PubMed] [Google Scholar]
- 26.Gautam A, Ng OC, Boyer JL. Isolated rat hepatocyte couplets in short-term culture: structural characteristics and plasma membrane reorganization. Hepatology 1987;7:216–23. [DOI] [PubMed] [Google Scholar]
- 27.Wilton JC, Williams DE, Strain AJ, et al. Purification of hepatocyte couplets by centrifugal elutriation. Hepatology 1991;14:180–3. [DOI] [PubMed] [Google Scholar]
- 28.Wilton JC, Matthews GM, Burgoyne RD, et al. Fluorescent choleretic and cholestatic bile salts take different paths across the hepatocyte: transcytosis of glycolithocholate leads to an extensive redistribution of annexin II. J Cell Biol 1994;127:401–10. [DOI] [PMC free article] [PubMed] [Google Scholar]
- 29.Knutton S, Baldwin T, Williams PH, et al. Actin accumulation at sites of bacterial adhesion to tissue culture cells: basis of a new diagnostic test for enteropathogenic and enterohemorrhagic Escherichia coli. Infect Immun 1989;57:1290–8. [DOI] [PMC free article] [PubMed] [Google Scholar]
- 30.Jung W, Gebhardt R, Robenek H. Primary cultures of rat hepatocytes as a model system of canalicular development, biliary secretion, and intrahepatic cholestasis. II. Taurolithocholate-induced alterations of canalicular morphology and of the distribution of filipin-cholesterol complexes. Eur J Cell Biol 1982;29:77–82. [PubMed] [Google Scholar]
- 31.Soroka CJ, Pate MK, Boyer JL. Canalicular export pumps traffic with polymeric immunoglobulin A receptor on the same microtubule-associated vesicle in rat liver. J Biol Chem 1999;274:26416–24. [DOI] [PubMed] [Google Scholar]
- 32.Rahner C, Stieger B, Landmann L. Apical endocytosis in rat hepatocytes in situ involves clathrin, traverses a subapical compartment, and leads to lysosomes. Gastroenterology 2000;119:1692–707. [DOI] [PubMed] [Google Scholar]
- 33.Marinelli RA, Roma MG, Pellegrino JM, et al. Taurolithocholate-induced inhibition of biliary lipid and protein excretion in the rat. Biochim Biophys Acta 1992;1125:44–8. [DOI] [PubMed] [Google Scholar]
- 34.Watanabe N, Smith CR, Phillips MJ. Pericanalicular vesicular movements in isolated hepatocytes visualized by time-lapse AVEC-DIC microscopy: Influence of ATP and taurolithocholate. Hepatology 1986;6:1196A. [Google Scholar]
- 35.Yousef IM, Bouchard G, Tuchweber B, et al. Monohydroxy bile acid induced cholestasis: role of biotransformation. Drug Metab Rev 1997;29:167–81. [DOI] [PubMed] [Google Scholar]
- 36.Wilschut J, Duzgunes N, Hoekstra D. Modulation of membrane fusion by membrane fluidity: temperature dependence of divalent cation induced fusion of phosphatidylserine vesicles. Biochemistry 1985;24:8–14. [DOI] [PubMed] [Google Scholar]
- 37.Rost D, Kartenbeck J, Keppler D. Changes in the localization of the rat canalicular conjugate export pump Mrp2 in phalloidin-induced cholestasis. Hepatology 1999;29:814–21. [DOI] [PubMed] [Google Scholar]
- 38.Scholmerich J, Kitamura T, Baumgartner U, et al. Taurohyocholate, taurocholate, and tauroursodeoxycholate but not tauroursocholate and taurodehydrocholate counteract effects of taurolithocholate in rat liver. Res Exp Med 1990;190:121–9. [DOI] [PubMed] [Google Scholar]
- 39.Milkiewicz P, Mills CO, Roma MG, et al. Tauroursodeoxycholate and S-adenosyl-L- methionine exert an additive ameliorating effect on taurolithocholate-induced cholestasis: a study in isolated rat hepatocyte couplets. Hepatology 1999;29:471–6. [DOI] [PubMed] [Google Scholar]
- 40.Kurz AK, Graf D, Schmitt M, et al. Tauroursodeoxycholate-induced choleresis involves p38(MAPK) activation and translocation of the bile salt export pump in rats. Gastroenterology 2001;121:407–19. [DOI] [PubMed] [Google Scholar]
- 41.Mills PR, Meier PJ, Smith DJ, et al. The effect of changes in the fluid state of rat liver plasma membrane on the transport of taurocholate. Hepatology 1987;7:61–6. [DOI] [PubMed] [Google Scholar]
- 42.Takikawa H, Sugiyama Y, Kaplowitz N. Binding of bile acids by glutathione S- transferases from rat liver. J Lipid Res 1986;27:955–66. [PubMed] [Google Scholar]
- 43.Boyer JL, Layden TJ, Hruban Z. Mechanism of cholestasis—Taurolithocholate alters canalicular membrane composition, structure and permeability. In: Popper H, Bianchi L, Reutter W, eds. Membrane Alterations as Basis of Liver Injury. Lancaster: MTP Press, 1976:353–69.
- 44.Roma MG, Orsler DJ, Coleman R. Canalicular retention as a marker of tight junctional permeability in isolated hepatocyte couplets: Effects of protein kinase modulation and cholestatic agents. Fund Appl Toxicol 1997;37:71–81. [DOI] [PubMed] [Google Scholar]


