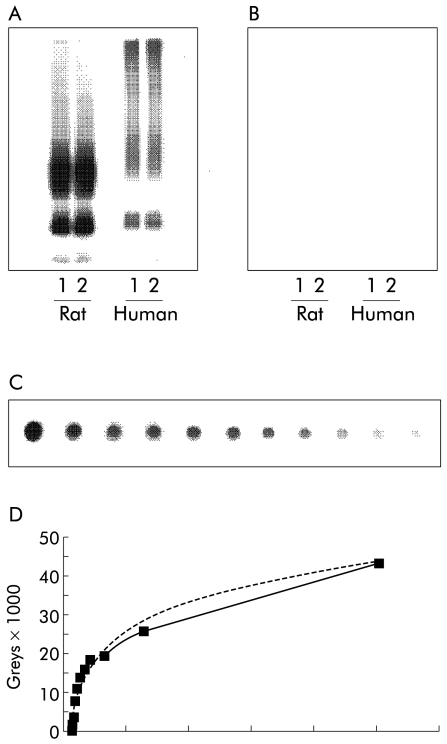
Figure 1.
Immunoblots and standard curve for determination of aquaporin 2 (AQP2) expression levels in urine. (A) Immunoblot of membrane fractions of inner medulla prepared from rat and human kidneys. The immunoblot was exposed to affinity purified anti-AQP2, diluted 1:2000, revealing 29 and 35–50 kDa bands for both rat and human kidneys. (B) Preabsorption control performed with anti-AQP2 previously incubated with immunising peptide. (C) Dot blot of serial peptide dilution, which was exposed to affinity purified anti- AQP2, diluted 1:800. (D) Standard curve obtained from serial peptide dilution including the best logarithmic equation of the relationship between AQP2 and signal intensity.

