Abstract
Background: Recently, single photon emission computed tomography (SPECT) scanning was described as a non-invasive technique to assess fundic accommodation. However, in contrast with the barostat, no intragastric distending force is applied during SPECT scanning. We hypothesised that in the absence of a barostat balloon, SPECT scanning largely detects the volume effect of the ingested meal and is a rather insensitive tool to detect fundic relaxation.
Methods: After an overnight fast, healthy volunteers underwent a barostat study and SPECT scanning on two separate days to assess: (1) meal induced fundic accommodation (Nutridrink, 200 ml, 300 kcal); and (2) gastric relaxation to 1 mg intravenous glucagon.
Results: Fasting fundic volumes (145 (8) v 280 (32) ml; p=0.001) and average postprandial volume (329 (10) v 571 (53) ml; p=0.001) were significantly lower measured with SPECT compared with the barostat study. Meal induced fundic relaxation (183 (10) v 289 (46) ml; p=0.050) and the postprandial/fasting volume ratio (2.32 (0.10) v 2.27 (0.29); p=0.892) did not differ significantly between SPECT scanning and the barostat. However, no correlation could be determined between accommodation volumes measured by both techniques. In contrast with meal induced relaxation, the glucagon induced increase in fundic volume (19 (5) v 406 (56) ml; p=0.007) and post/pre glucagon ratio (1.16 (0.03) v 3.02 (0.54); p=0.046) were significantly lower when measured by SPECT scanning compared with the barostat.
Conclusion: SPECT scanning detects changes in postprandial volume but is less suitable than the gastric barostat in detecting changes in gastric tone. Our study therefore questions its role as a tool to detect impaired accommodation and warrants further validation of this technique.
Keywords: Barostat, dyspepsia, gastric accommodation, single photon emission computed tomography
Under normal conditions, the proximal stomach relaxes after ingestion of a meal, a vagally mediated motor pattern known as meal induced accommodation.1 Impaired meal induced relaxation of the proximal stomach has been repeatedly demonstrated in a subgroup of patients with functional dyspepsia (FD).2,3 Symptoms such as early satiety2 and weight loss4 in particular have been reported to be associated with this phenomenon. Conversely, treatment with sumatriptan, a potent fundic relaxant, induced an increase in caloric intake in FD, suggesting that fundic relaxation may represent a new therapeutic approach for this subgroup of FD.2 If so, it may be of importance to determine proximal stomach function in order to select the subgroup of patients that would benefit from this fundic relaxant therapy.
At present, a gastric barostat study is generally accepted as the gold standard to investigate proximal stomach function. A balloon connected to a computerised pump is positioned in the proximal stomach to record intraballoon volume at a fixed pressure as a measure of fundic tone.5 This technique has provided enormous valuable information on the effect of meal ingestion and pharmacological agents on the proximal stomach. However, a major disadvantage is the invasive and stressful nature of this investigation. Furthermore, the presence of the balloon interferes with normal physiology, as reported by Mundt and colleagues.6 Consequently, it is an unattractive tool for routine clinical use and even for evaluation of drug effects in clinical trials, usually requiring repeated measurements.
Recently, single photon emission computed tomography (SPECT) has been reported as a possible non-invasive alternative.7 Radiolabelled 99mTc pertechnetate is injected intravenously and accumulates in the gastric mucosa allowing visualisation of the stomach. This technique was shown to record changes in postprandial volume to a similar extent as the gastric barostat.8 It should be emphasised that in this study the barostat balloon was positioned in the proximal stomach during SPECT scanning, providing a positive pressure to the gastric wall and thereby actively distending the stomach. Under more physiological conditions however the stomach will remain collapsed. Consequently, the volumes measured by SPECT scanning will reflect intragastric content such as intragastric secretions, swallowed air, and ingested foods or liquids. Based on these assumptions, we hypothesised that in the absence of a barostat balloon, SPECT scanning largely detects the volume effect of meal ingestion and is a rather insensitive tool in detecting fundic relaxation. To test this hypothesis, the ability to detect fundic relaxation of comparable magnitude evoked by meal ingestion or glucagon was compared between the two techniques performed on separate days. In addition, symptoms reported during the study were evaluated as indirect measures of procedure related discomfort.
MATERIALS AND METHODS
Subjects
Twenty one healthy volunteers, recruited by public advertisement, were invited to participate (13 women, eight men; mean age 26 years (range 18–54)). Gastrointestinal symptoms were excluded using a questionnaire (Nepean dyspepsia index)3 and none of the subjects was taking medications known to influence gastrointestinal motility. All subjects gave informed consent before entering the study. The study was approved by the ethics committee of the Academic Medical Centre, Amsterdam, the Netherlands.
Study protocols
Gastric relaxation was evoked by two different protocols: (1) meal intake and (2) intravenous injection of glucagon. For each protocol, subjects were invited to undergo a gastric barostat study and a 99mTc pertechnetate SPECT on two separate days. To determine gastric emptying time after meal ingestion, a 13C breath test was performed.
Protocol 1: meal induced relaxation
Barostat
After an overnight fast, 17 healthy volunteers (13 women, four men; mean age 25 years (range 18–54)) underwent a gastric barostat study at 09.00 am. The barostat bag was introduced, unfolded, and positioned into the proximal stomach. After an equilibration period of approximately 30 minutes, minimum distending pressure (MDP) was determined and baseline operating pressure was set at MDP+2 mm Hg. After a 30 minute baseline period, a liquid test meal with a caloric load of 300 kcal and a volume of 200 ml (Nutridrink; Nutricia, Zoetermeer, the Netherlands) was consumed with the aid of a straw. Intrabag volume was recorded during the following 60 minutes and symptoms of bloating, nausea, pain, satiety, fullness, hunger, and burning were assessed every five minutes by a visual analogue scale (VAS) whereby 0 mm represents “no sensation” and 100 mm represents “worst imaginable”. The 13C breath test was performed before the test meal and every 10 minutes during the first hour, and thereafter every 15 minutes for the next three hours.
SPECT
On a separate day, after an overnight fast, the same subjects underwent SPECT scanning at 9.00 am. Thirty minutes after intravenous injection of 200 MBq 99mTc pertechnetate, a baseline scan was performed. The test meal (Nutridrink, 200 ml, 300 kcal) was given and scans were made every 10 minutes up to one hour postprandially. Before every scan, breath samples were taken and symptoms of bloating, nausea, pain, satiety, fullness, hunger, and burning were scored by VAS. After the first hour, breath samples were collected every 15 minutes for the next three hours.
Protocol 2: glucagon induced fundic relaxation
Barostat
After an overnight fast, four healthy volunteers (four men; mean age 29 years (range 22–38)) underwent a gastric barostat study at 09.00 am. The barostat bag was introduced, unfolded, and positioned into the proximal stomach. After an equilibration period of approximately 30 minutes, MDP was determined and baseline operating pressure was set at MDP+2 mm Hg. Intrabag volume was recorded for 30 minutes, followed by intravenous injection of 1 mg glucagon (GlucaGen 1 mg; Novo Nordisk Farma BV, Alphen a/d Rijn, the Netherlands) dissolved in 1 ml sterile water for intravenous injection and was injected slowly over one minute. Intrabag volume was recorded during the following 15 minutes.
SPECT
On a separate day, after an overnight fast, the same subjects underwent SPECT scanning at 9.00 am. Thirty minutes after intravenous injection of 200 MBq 99mTc pertechnetate, a baseline scan was performed. Glucagon (1 mg) was administered intravenously and seven minute scans were started after one minute and eight minutes.
Methods
Gastric barostat
Following anaesthesia of the throat (xylocaine 10% spray; AstraZeneca BV, Zoetermeer, the Netherlands), subjects swallowed a 1200 ml polyethylene bag, tightly wrapped on the distal end of a double lumen polyvinyl tube (4 mm outer diameter Salem Sump tube; Sherwood Medical, St Louis, Missouri, USA). The balloon was unfolded by inflation of 500 ml of air and was positioned in the proximal stomach by gently withdrawing the catheter. The catheter was connected to the barostat and fixed to the cheek, and subjects were positioned upright. The barostat device (Medtronic Functional Diagnostics, Stockholm, Sweden) automatically corrected for the compressibility of air. Intraballoon pressure and volume were recorded continuously during the protocol, and data were stored on a personal computer using commercially available software (Polygram for Windows; Medtronic Functional Diagnostics, Synectics Medical AB, Stockholm, Sweden). MDP was determined as the minimum pressure at which intrabag volume was >30 ml. For measuring fasting volume, meal induced fundic relaxation and glucagon induced fundic relaxation, baseline operating pressure was set at MDP+2 mm Hg.
SPECT imaging
Total gastric imaging was assessed by means of SPECT scanning using 99mTc pertechnetate intravenously. A dual head gamma camera in SPECT mode allowed three dimensional data acquisition. Tomographic studies were acquired on a large field of view dual head gamma camera system (GE Varicam, Haifa, Israel) equipped with low energy high resolution collimators. Volunteers were positioned supine on the imaging table with the gastric region in the middle of the field of view. Thirty minutes after intravenous injection of 200 MBq 99mTc pertechnetate, a baseline acquisition was performed (360° orbit, 5° step, 72 views, 10 seconds/view, six minutes total acquisition time). Subsequently, after intervention (test meal, glucagon) multiple acquisitions were made up to one hour and up to 15 minutes, respectively. After completion of the acquisition, every acquisition was reconstructed on a Hermes processing station (Hermes; Nuclear Diagnostics, Stockholm, Sweden) using filtered back projection (Ramp-Butterworth filter, order 10, cut off 0.45 Nyquist) to produce transverse, sagittal, and coronal images of the stomach. After reconstruction, stomach volume measurements were performed using the volume tool software on the Hermes processing station. A threshold of 20% of the maximal voxel count value was applied, after filling the interior stomach with a default 50% voxel count value. Total and regional (proximal–distal) gastric volumes were calculated. The stomach was divided into the proximal and distal stomach by drawing a horizontal line across the incisura. To allow repetitive studies, a limited dose of 200 MBq 99mTc pertechnetate was administered, limiting the radiation burden to 2.4 mSv per study. We have previously determined that this dose is capable of delivering good quality images for at least 2.5 hours after intravenous injection.9 Total radiation exposure was within permissible ranges for research and clinical studies.
13C breath test
Gastric emptying was measured by the 13C breath test. Acetic acid-1-13C sodium salt was added to the caloric liquid meal (Nutridrink). Breath was collected by breathing into a tube through a straw. Breath samples were taken before the test meal and every 10 minutes during the first hour thereafter, followed by every 15 minutes for the next three hours. All breath samples were obtained in duplicate. Analysis of the breath samples was performed by the BreathMATPlus (ThermoQuest Finnigan MAT Gmbh, Bremen, Germany).
Data analysis
Barostat
Fasting volume was calculated as the mean volume of 15 minutes before meal intake or glucagon injection using commercially available software (Polygram for Windows; Medtronic, Stockholm, Sweden). Postprandial volumes were measured as the mean volume of five minute periods. Average postprandial volume was defined as the mean volume over the 60 minute postprandial period. Maximal volume was measured as the highest volume recorded during the 60 minutes postprandially. Fundic relaxation after ingestion of a liquid meal was expressed as the difference in volume between the average postprandial volume and fasting volume.3 Relaxation induced by glucagon was measured as the difference in volume between the average of 15 minutes after injection and fasting volume. The postprandial ratio and post glucagon ratio were calculated as the postprandial volume or the post glucagon volume divided by the fasting volume, respectively.
SPECT
SPECT fasting and postprandial volumes were measured as the mean volume of seven minute periods using the volume tool software on the Hermes processing station (Hermes; Nuclear Diagnostics). Similar to the barostat, gastric relaxation after liquid meal ingestion was defined as the difference in volume between the average postprandial volume and the seven minute fasting period prior to the meal. For relaxation after glucagon injection, the difference in volume between the average of 15 minutes post injection and the seven minutes prior to injection of glucagon fasting volume was calculated. The postprandial ratio and post glucagon ratio were defined as the average postprandial volume or post glucagon volume divided by fasting volume, respectively.
Symptoms
Symptoms reported before the meal and during the postprandial period were expressed as mean values for every five minute time point during the barostat study and every 10 minute time point during SPECT scanning. Individual sensation scores for bloating, nausea, pain, satiety, fullness, hunger, and burning were assessed on a VAS, from which an individual score, a total postprandial symptom score for each time point, and the total symptom score of each individual symptom were calculated.
13C breath test
Breath samples collected over four hours after ingestion of the meal were analysed by the BreathMATPlus (ThermoQuest Finnigan MAT Gmbh, Bremen, Germany). After analyses, the obtained δ13 values were used in curve fitting modules in Excel (Microsoft Excel 97) to calculate gastric half emptying time.10
Statistics
All group data are expressed as means (SEM). Descriptive statistics were used for pre and postprandial stomach volumes and symptom scores in time. To compare the barostat and SPECT scanning volumes, statistical analysis was performed using a Student’s t test and a Spearman’s rho test. Differences were considered significant at p<0.05.
RESULTS
Protocol 1: meal induced fundic relaxation
Volume: comparison between SPECT and barostat
While the dose of 99mTc pertechnetate used by Kuiken and colleagues7 was halved to reduce the radiation burden, the quality of the images was high, allowing volume calculations up to two hours postprandially. Within two hours, postprandial volumes returned to their initial fasting volume (data not shown).
Fasting volume
Before meal ingestion, there was great variation in fasting fundic volumes measured by gastric barostat, ranging from 142 ml to 562 ml. In contrast, both fundic and total gastric volumes obtained with SPECT scanning varied much less, ranging from 105 ml to 205 ml and from 113 ml to 268 ml, respectively. Fasting fundic and total gastric volumes were significantly lower during SPECT scanning compared with those obtained with the barostat (table 1 ▶).
Table 1.
Gastric volumes measured by single photon emission computed tomography (SPECT) and barostat
| Barostat | SPECT fundic volume (ml) | p Value (barostat v SPECT fundic) | Correlation coefficient (barostat v SPECT fundic) | SPECT total gastric volume (ml) | p Value (barostat v SPECT total gastric) | Correlation coefficient (barostat v SPECT total gastric) | |
| Fasting volume (ml) | 280 (32) | 145 (8) | 0.001 | −0.19 (p=0.492) | 181 (11) | 0.011 | −0.20 (p=0.451) |
| Postprandial volume (ml) | 571(53) | 329 (10) | 0.001 | −0.26 (p=0.344) | 381 (13) | 0.004 | −0.14 (p=0.685) |
| Difference (ml) | 289 (46) | 183 (10) | 0.050 | −0.08 (p=0.771) | 200 (13) | 0.111 | −0.31 (p=0.254) |
| Postprandial ratio | 2.27 (0.29) | 2.32 (0.10) | 0.892 | −0.12 (p=0.666) | 2.19 (0.13) | 0.816 | −0.29 (p=0.296) |
Values are expressed as means (SEM).
Postprandial volume
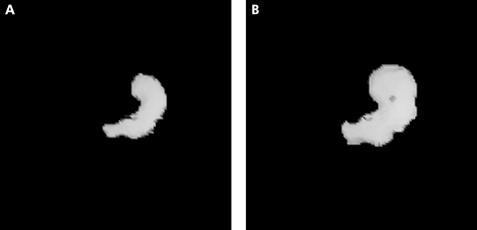
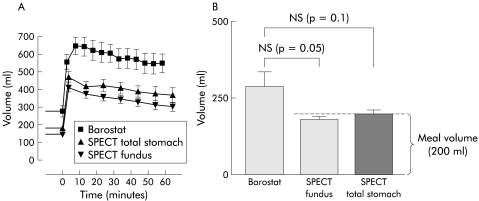
Meal intake resulted in a significant increase in gastric volume for both barostat (p<0.001) and SPECT (fig 1 ▶). As shown in fig 2 ▶, fundic volume increased rapidly after meal intake reaching a plateau within 10 minutes. In both the barostat and SPECT studies, volumes slowly declined at a comparable rate (fig 2A ▶). Average postprandial fundic and total gastric volume were both significantly lower with SPECT scanning compared with the gastric barostat (table 1 ▶). Maximal fundic volume (407 (16) ml) and total gastric volume (479 (22) ml) reached during SPECT scanning were significantly lower compared with the barostat values (677 (49) ml; p=0.001 and p<0.001, respectively).
Figure 1.
Reconstructed three dimensional single photon emission computed tomography (SPECT) images of a fasting (A) and postprandial (B) stomach in a healthy volunteer.
Figure 2.
(A) Dynamics of meal induced relaxation represented by fundic volumes plotted in time, as assessed by barostat and single photon emission computed tomography (SPECT). (B) Fundic accommodation induced by meal intake, as measured by barostat and SPECT. Meal induced fundic accommodation measured by barostat and SPECT was not significantly different. Note that meal induced fundic accommodation, as measured by SPECT scanning, approaches the volume of the ingested meal (200 ml).
Fundic accommodation
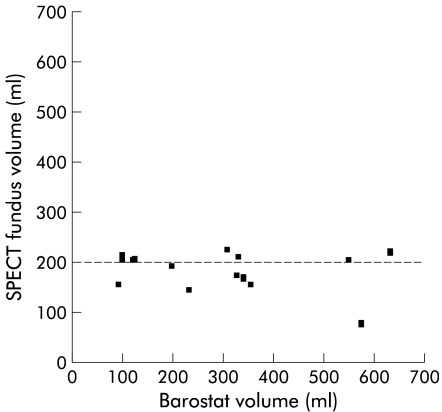
To evaluate whether SPECT scanning is a non-invasive alternative to the barostat in assessing gastric accommodation, accommodation responses were compared between the two techniques. The calculated meal induced fundic and total gastric accommodation expressed as the difference between the average pre and postprandial volume were not significantly different between the two techniques (fig 2B ▶). Similarly, no difference in the ratio of postprandial over fasting volume was observed (table 1 ▶). However, after applying a Spearman’s rho test to determine a correlation between SPECT scanning and the barostat, no significant linear relationship could be detected between barostat and SPECT accommodation volumes or ratios (table 1 ▶). Furthermore, when individual accommodation volumes obtained by barostat were plotted against those obtained by SPECT scanning, a wide variation in measured barostat volumes in contrast with SPECT fundic volumes was observed (fig 3 ▶). Moreover, individual accommodation volumes, as measured by SPECT scanning, did not significantly differ from the 200 ml volume of the ingested meal (p=0.1, one sample Student’s t test) (fig 3 ▶). In contrast, meal induced accommodation measured by barostat differed significantly from 200 ml (p=0.04, one sample Student’s t test).
Figure 3.
Correlation plot between meal induced accommodation assessed by single photon emission computed tomography (SPECT) scanning and barostat. Note that SPECT volumes are not significantly different from 200 ml (p=0.1), which equals the volume of the ingested meal.
Symptoms: comparison between SPECT and barostat
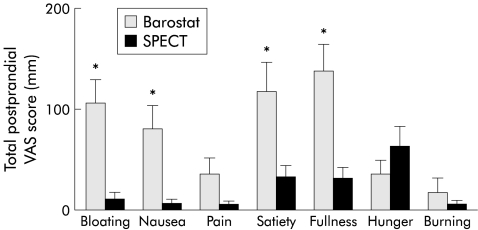
Symptoms reported by healthy volunteers were compared for both techniques. Healthy subjects reported significantly more postprandial symptoms of bloating, nausea, satiety, and fullness during the barostat study compared with SPECT scanning (fig 4 ▶). Pain, hunger, and burning sensation were not significantly different.
Figure 4.
Total postprandial visual analogue scale (VAS) score measured by barostat and single photon emission computed tomography (SPECT) scanning for each individual symptom. *p<0.05, Student’s t test.
Gastric emptying: comparison between SPECT and barostat
To evaluate possible differences in gastric emptying evoked by the presence of the barostat balloon, gastric half emptying times were measured in eight healthy volunteers (six women, two men; mean age 27 years (range 18–54)). The gastric half emptying time for the barostat was 33 (4) minutes. This was significantly faster compared with the SPECT scanning gastric half emptying time (70 (12) minutes; p=0.021).
Protocol 2: glucagon induced fundic relaxation
Volume: comparison between pre and post glucagon
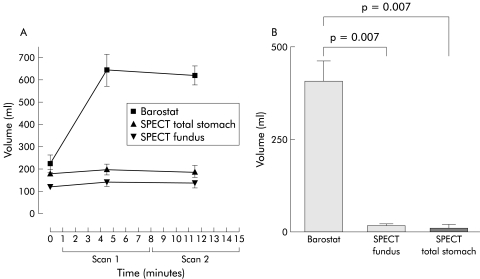
To eliminate the possible interference of meal volume, the capacity of SPECT scanning to assess pharmacologically induced relaxation was compared with that of the gastric barostat. During the barostat study, glucagon induced a rapid onset relaxation of the gastric fundus comparable with that obtained after meal ingestion. In contrast, SPECT scanning only detected a small increase in volume after glucagon injection, reaching a mean volume significantly smaller compared with that measured by barostat (fig 5 ▶, table 2 ▶). When data are expressed as the ratio of post glucagon volume over fasting volume, the post glucagon ratio was significantly lower for SPECT scanning compared with the barostat (table 2 ▶).
Figure 5.
(A) Volumes measured before and after glucagon intravenous injection, as assessed by barostat and single photon emission computed tomography (SPECT). Scan 1 was performed from one up to eight minutes, followed by scan 2 from eight to 15 minutes. (B) Glucagon induced fundic accommodation measured by barostat and SPECT was significantly different (p<0.05, Student’s t test).
Table 2.
Gastric volumes by single photon emission computed tomography (SPECT) and barostat
| Barostat | SPECT fundic volume (ml) | p Value (barostat v SPECT fundic) | SPECT total gastric volume (ml) | p Value (barostat v SPECT total gastric) | |
| Baseline volume (ml) | 226 (39) | 119 (15) | 0.084 | 182 (18) | 0.407 |
| Post glucagon volume (ml) | 632 (51) | 139 (18) | 0.002 | 194 (25) | 0.003 |
| Difference (ml) | 406 (56) | 19 (5) | 0.007 | 12 (10) | 0.007 |
| Post glucagon ratio | 3.02 (0.54) | 1.16 (0.03) | 0.046 | 1.06 (0.05) | 0.039 |
Values are expressed as means (SEM).
DISCUSSION
In the present study, we investigated whether SPECT scanning is a non-invasive alternative to the barostat in evaluating gastric relaxation. SPECT scanning detected lower volumes before and after meal intake compared with the barostat, most likely due to the absence of a distending pressure. Although the dynamics of the meal induced relaxation were comparable with those detected by the barostat, the increase in volume detected by SPECT scanning was not different from the ingested volume. Furthermore, in comparison with the meal induced volume increase, SPECT scanning failed to detect the profound gastric relaxation following glucagon infusion. These findings suggest that SPECT scanning rather detects the volume of the intragastric contents after meal intake and is less sensitive in detecting changes in gastric tone in the absence of a distending force. Our results therefore question the role of SPECT scanning as a tool to detect impaired accommodation and warrants further validation of this technique.
Currently, the gastric barostat is considered the gold standard in assessing fundic accommodation. However, as this technique is invasive, SPECT scanning has been proposed as a non-invasive alternative to evaluate this gastric motor reflex. Indeed, Bouras et al reported a good correlation between both techniques.8 These authors concluded that SPECT scanning accurately measures volume in vitro and can identify changes in gastric volume in response to a meal and gastric distension. In our study, we confirmed the ability of SPECT scanning to detect changes in gastric volume with comparable postprandial/fasting ratios as those obtained by the barostat. However, we found no correlation between the accommodation volumes measured by the two different techniques. Most likely, this discrepancy can be explained by a difference in methodology. In the study reported by Bouras et al, SPECT scanning was performed with the gastric barostat balloon in situ.8 As SPECT scanning measures intragastric volume based on imaging of the gastric wall, comparable volumes will be detected under these circumstances. In our study, however, the two techniques were performed separately and thus SPECT scanning occurred in the absence of a distending pressure. Under these conditions the stomach is collapsed and gastric volume detected by SPECT scanning is determined by other factors, such as ingested meal, swallowed air, and gastric secretion (estimated at 40–200 ml/h11). These methodological differences explain the lower postprandial volume detected by SPECT scanning and the lack of correlation between the increase in postprandial volumes detected by the two different techniques. Our findings that meal induced accommodation assessed by SPECT scanning did not differ from meal volume, further corroborates this hypothesis and suggests that SPECT scanning mainly detects meal volume rather than gastric relaxation. Preliminary data confirm this assumption, showing a good correlation (r =0.66, p=0.034; n=10) between ingested volume and volume measured by SPECT scanning (unpublished results). Finally, when assessed by barostat, glucagon induced a pronounced gastric relaxation (202%) of comparable magnitude to meal ingestion. SPECT scanning however detected only a marginal increase in fundic volume of 16%, suggesting that SPECT scanning is less sensitive in detecting gastric relaxation per se. Similar findings were reported by previous studies evaluating the relaxant effect of GLP-112 and sublingual nitroglycerine.13 In these studies, only minor increases in gastric volume were reported whereas from barostat studies these agents are known to induce pronounced relaxation of the stomach.14,15
Considering our hypothesis that SPECT scanning rather detects intragastric volume, the detected increase in postprandial volume also depends on gastric emptying and gastric secretion. In contrast with Liau et al, who stated that up to 50% of a small liquid meal will be emptied during the 20 minute period they measured,13 we measured an average gastric half emptying time of 70 minutes. Therefore, more than half of the ingested meal was still present after 60 minutes postprandially and is likely to contribute to the measured gastric volume. This implies that patients with fast gastric emptying may be incorrectly identified as having impaired accommodation. Consequently, further studies investigating the specificity and sensitivity of SPECT scanning in detecting impaired accommodation are warranted.
After meal intake, subjects reported significantly more symptoms during the barostat study than during SPECT scanning. Most likely, this resulted from the gastric distension induced by the positive pressure applied by the intragastric balloon. As the barostat balloon may also interfere with gastric function,6 SPECT scanning remains an attractive tool to study the stomach in a non-invasive manner. For example, it may be useful to study the relationship between symptoms and antral or fundic volume under more physiological circumstances. As such, it may contribute to a better understanding of the factors involved in the increased perception of postprandial symptoms in patients with FD. These studies are currently undertaken.
In summary, we conclude that SPECT scanning can detect changes in gastric volume in a non-invasive manner. However, our data suggest that SPECT scanning, in the absence of a distending force, is less suitable than the gastric barostat in detecting gastric relaxation and rather detects the volume of the intragastric contents after meal intake. These findings question the role of SPECT scanning as a tool for the detection of gastric relaxation or impaired accommodation and imply that further validation is required.
Acknowledgments
BvdE is supported by a grant from Janssen Research Foundation, Beerse, Belgium.
Abbreviations
SPECT, single photon emission computed tomography
MDP, minimal distending pressure
VAS, visual analogue scale
FD, functional dyspepsia
REFERENCES
- 1.Azpiroz F, Malagelada JR. Vagally mediated gastric relaxation induced by intestinal nutrients in the dog. Am J Physiol 1986;251:G727–35. [DOI] [PubMed] [Google Scholar]
- 2.Tack J, Piessevaux H, Coulie B, et al. Role of impaired gastric accommodation to a meal in functional dyspepsia. Gastroenterology 1998;115:1346–52. [DOI] [PubMed] [Google Scholar]
- 3.Boeckxstaens GE, Hirsch DP, van den Elzen BD, et al. Impaired drinking capacity in patients with functional dyspepsia: relationship with proximal stomach function. Gastroenterology 2001;121:1054–63. [DOI] [PubMed] [Google Scholar]
- 4.Kim DY, Delgado-Aros S, Camilleri M, et al. Noninvasive measurement of gastric accommodation in patients with idiopathic nonulcer dyspepsia. Am J Gastroenterol 2001;96:3099–105. [DOI] [PubMed] [Google Scholar]
- 5.Azpiroz F, Malagelada JR. Physiological variations in canine gastric tone measured by an electronic barostat. Am J Physiol 1985;248:G229–37. [DOI] [PubMed] [Google Scholar]
- 6.Mundt MW, Hausken T, Samsom M. Effect of intragastric barostat bag on proximal and distal gastric accommodation in response to liquid meal. Am J Physiol Gastrointest Liver Physiol 2002;283:G681–6. [DOI] [PubMed] [Google Scholar]
- 7.Kuiken SD, Samsom M, Camilleri M, et al. Development of a test to measure gastric accommodation in humans. Am J Physiol 1999;277:G1217–21. [DOI] [PubMed] [Google Scholar]
- 8.Bouras EP, Delgado-Aros S, Camilleri M, et al. SPECT imaging of the stomach: comparison with barostat, and effects of sex, age, body mass index, and fundoplication. Gut 2002;51:781–6. [DOI] [PMC free article] [PubMed] [Google Scholar]
- 9.Bennink RJ, van den Elzen BD, Kuiken SD, et al. Non invasive measurement of gastric accommodation by means pertechnetate SPECT: limiting radiation dose and increase image quality. World J Nuclear Med 2002;1:S47. [PubMed] [Google Scholar]
- 10.Maes BD, Ghoos YF, Rutgeerts PJ, et al. [*C]octanoic acid breath test to measure gastric emptying rate of solids. Dig Dis Sci 1994;39:104S–6S. [DOI] [PubMed] [Google Scholar]
- 11.Sewing KF, Billian A, Malchow H. Comparative study with ranitidine and cimetidine on gastric secretion in normal volunteers. Gut 1980;21:750–2. [DOI] [PMC free article] [PubMed] [Google Scholar]
- 12.Delgado-Aros S, Kim DY, Burton DD, et al. Effect of GLP-1 on gastric volume, emptying, maximum volume ingested, and postprandial symptoms in humans. Am J Physiol Gastrointest Liver Physiol 2002;282:G424–31. [DOI] [PubMed] [Google Scholar]
- 13.Liau SS, Camilleri M, Kim DY, et al. Pharmacological modulation of human gastric volumes demonstrated noninvasively using SPECT imaging. Neurogastroenterol Motil 2001;13:533–42. [DOI] [PubMed] [Google Scholar]
- 14.Schirra J, Wank U, Arnold R, et al. Effects of glucagon-like peptide-1(7–36)amide on motility and sensation of the proximal stomach in humans. Gut 2002;50:341–8. [DOI] [PMC free article] [PubMed] [Google Scholar]
- 15.Thumshirn M, Camilleri M, Choi MG, et al. Modulation of gastric sensory and motor functions by nitrergic and alpha2-adrenergic agents in humans. Gastroenterology 1999;116:573–85. [DOI] [PubMed] [Google Scholar]


