

Abstract
Background and aims: The general concept is that as Vibrio cholerae is not invasive, it mediates a non-inflammatory type of infection. This is being re-evaluated based on available data that natural cholera infection or cholera toxin induces a Th2-type of immune profile and stimulates the humoral immune response, innate cells, and mediators in the host.
Methods: To perform a comprehensive analyses of the inflammatory components, we studied mucosal biopsies from patients, both adults and children with acute watery diarrhoea caused by V cholerae O1 and O139. Patients with cholera, adults (n = 30) and children (n = 18), as well as healthy controls (n = 24) were studied. Histochemical, immunohistochemical, and ultrastructural studies were carried out to elucidate the contribution of the different factors using paraffin and frozen duodenal and/or rectal sections as appropriate. Samples were collected during the acute stage and during early and/or late convalescence.
Results: Following natural cholera infection, patients responded with increases in neutrophil polymorphs during the acute stage (p<0.001) compared with healthy controls whereas mucosal mast cells (MMC) (p = 0.008) and eosinophils (p = 0.034) increased in the gut during convalescence. Electron microscopic analyses of duodenal biopsies from adult patients showed increased piecemeal degranulation in both MMC and eosinophils and accumulation of lipid bodies in MMC. Duodenal biopsies from V cholerae O1 infected patients showed upregulation of myeloperoxidase, lactoferrin, PGHS-1, SCF, tryptase, tumour necrosis factor α, α-defensin, and eotaxin during the acute stage and chymase, interleukin 3 and major basic protein during convalescence.
Conclusion: We have shown that innate cells and their mediators are upregulated in acute watery diarrhoea. These cells and factors of the innate arm may be important in the host’s defence against cholera. Such effects may need to be simulated in a vaccine to achieve long lasting protection from cholera.
Keywords: cholera, polymorphonuclear neutrophil, eosinophil, mucosal mast cell, mediators
Cholera has long been considered a classic paradigm of a non-inflammatory toxigenic diarrhoea until observations showed that Vibrio cholerae O1 infection induces an increase in inflammatory cells.1 Subsequent studies showed that V cholerae may induce increases in innate factors, including myeloperoxidase, lactoferrin, nitric oxide metabolites, and eicosanoids.2–5 Natural cholera infection or cholera toxin induces a Th2-type of cytokine response, resulting in an increase in specific IgG4 and IgE isotypes of antibodies6–8 and also increases in interleukin (IL)-6 production by mast cells,9 suggesting involvement of innate cells in the immune response.
Clinical cholera is known to give rise to long lasting protection.10 As innate immunity may be needed for the host to mount an appropriate adaptive immune response to an infection,11 we have studied the possible interaction of inflammatory mediators over the course of the disease following natural infection with V cholerae O1 and O139. We studied stool, serum, and mucosal biopsies obtained from both adults and paediatric patients to understand the involvement of polymorphonuclear neutrophils (PMN), mucosal mast cells (MMC), and eosinophils during the acute and convalescence stages. Different mediators involved in upregulation of innate cells, including enzymes, cytokines, and chemokines localised at the mucosal surface were also studied.
MATERIALS AND METHODS
Study group and recruitment
Adult male patients (n = 30), aged 18–49 years, with culture confirmed12V cholerae O1 (n = 14) or O139 (n = 16) infection, were included in the study. Eighteen children (aged 2–5 years) with cholera (13 males and five females) infected with V cholerae O1 (n = 10) or O139 (n = 8) were also studied. The degree of dehydration and clinical severity were assessed by a physician.13 Twelve adult males in the same age group as patients with no history of diarrhoea during the previous three months were studied as healthy controls. In addition, 12 healthy children (six females and six males) attending the hospital for follow up 60 days after the onset of diarrhoeal infection were treated as study controls.14 Stools obtained from subjects on all study days were screened for common enteric pathogens, both bacteria and parasites.12,15,16 The study was approved by the ethics review committee of the ICDDR, B.
Sample collection and processing
Venous blood was collected from patients during the acute stage on the second day of hospitalisation (day 2), and five (day 7) and 28 days (day 28) later. Single blood samples were collected from healthy subjects. Duodenal and rectal pinch biopsies (n = 4) were collected from adult patients on days 2, 7, and 30 after the onset of disease using a standard endoscope and sigmoidoscope (Olympus, Tokyo, Japan). Biopsies were taken only once from corresponding healthy subjects (day 0).5 One sample was fixed in buffered formaldehyde, embedded in paraffin, and 3 μm sections prepared. Two biopsies were collected in Histocon (Histolab products AB, Gothenburg, Sweden), immediately snap frozen in liquid nitrogen, and stored at −70°C before cutting into 5 μm sections. For electron microscopy, biopsy samples were fixed in glutaraldehyde, embedded in araldite, and ultrathin sections prepared (LKB UM4 Ultramicrotome).
Morphological and ultrastuctural analysis
Paraffin embedded sections were stained with haematoxylin-eosin and coded sections from each specimen examined by a pathologist using criteria described previously.1 Eosinophils were localised in haematoxylin-eosin stained sections. For ultrastructural studies, ultrathin sections stained with uranyl acetate and lead citrate were scanned systematically (Philips EM201C electron microscope, Eindhoven, the Netherlands). A minimum of 10–20 eosinophils and mast cells were photographed and the type of granules, degranulation, and activation were noted.1,17,18 An enzyme histochemical staining procedure was used to detect and quantitate mast cells and neutrophils based on chloroacetate esterase activity using naphthol-AS-D-choloroacetate and a pararosanilin dye.19
Immunohistochemical analyses
For immunohistochemical analyses, duodenal sections obtained from 10 O1 cholera infected adult patients and 10 adult healthy controls were studied. The first 10 patients who were enrolled in the study were selected for this analysis. Paraffin embedded or cryostat sections were used in procedures described previously.20 For paraffin embedded sections, specific antibodies to detect tryptase, lactoferrin, myeloperoxidase (MPO) (Dako A/S, Glostrup, Denmark), α-defensin (Serotec, Oxford, UK), chymase (NeoMarkers, Fremont, California, USA), major basic protein (MBP) (Pharmingen, San Diego, California, USA), and IgE (Sigma, St Louis, Missouri, USA) were used.
Specific monoclonal or polyclonal primary antibodies were used in cryostat sections to detect chemokine receptor 3 (CCR3) (Santa Cruz Biotechnology, Inc., Santa Cruz, California, USA), IL-3, IL-4, IL-5 (Pharmingen), stem cell factor (SCF) (R&D, Minneapolis, Minnesota, USA), tumour necrosis factor α (TNF-α) (Innogenetics, Zwijndrecht, Belgium), eotaxin (Serotec), and prostaglandin H synthase 1 (PGHS-1) (Oxford Medical Research, Oxford, Michigan, USA). Biotinylated goat antirabbit/antimouse (Dako) and avidin biotin complex (Dako) or rabbit antimouse IgG (Dako) and peroxidase-antiperoxidase antibody (Dako) were used. For detection of MPO, tryptase, defensin, and IgE, paraffin sections were pretreated with trypsin (0.1%). Sections were developed in a solution of hydrogen peroxide and 3,3′-diaminobenzidine (Sigma Chemical Co.). Irrelevant isotype matched antibodies were used as controls in each assay.
Quantification of cells and mediators in sections
Tissue area was determined using an eyepiece grid consisting of 100 squares covering 1.0 mm2 of tissue on a Olympus BH2 microscope at ×400 magnification and counting the number of squares covering the tissue section. In the case of duodenal sections, positive cells in the lamina propria (LP) and intraepithelial regions were quantified separately for both crypt and villus. They were counted similarly in the superficial and deep mucosa of rectal biopsies. Results are expressed as the average number of cells per mm2.1,21 This procedure was used for quantification of PMN, eosinophils, and mast cells using chloroacetate esterase activity.
Quantification of immunostained sections for the remainder of the mediators was carried out by computer assisted analysis of video microscopic images with a DMLB microscope (Leica Wetzlar, GmbH, Germany) equipped with a 3CCD colour camera (JVC TK-CF380; Victor Company of Japan Ltd, Japan). Each image was examined in a Leica Q500IW image analyser using the Leica QWin version 2.0 computer programme. Standards were set for positive as well as negative cells.20,22 The data acquired were imported into Microsoft Excel. For each tissue section at least 20 fields (4×104 μm2/field) were investigated at ×400 magnification and the average calculated.
Statistical analysis
Comparisons were made using the Wilcoxon signed rank test, the Mann-Whitney U test, the χ2 test, or Fisher’s exact test, where necessary. Probabilities were regarded as significant if they reached a 95% level of confidence (p⩽0.05). Analyses were carried out using the statistical software SigmaStat (Jandel Scientific, San Rafael, California, USA). Values are expressed as median (25th and 75th percentiles) or geometric mean (SEM) and range.
RESULTS
Clinical history of the study groups
Of the adults and children infected with V cholerae O1 or O139, 90–100% suffered from severe dehydration. Only V cholerae O1 or O139 was isolated from the stools of patients. Stool microscopy revealed the presence of ova of Ascaris lumbricoides (n = 7), giardia (n = 3), E histolytica (n = 1), and hookworm (n = 3) among the 48 cholera patients.
No bacterial pathogens were isolated from the stools of healthy endemic controls, although giardia (n = 1) and A lumbricoides (n = 4) were detected. During the convalescence phase, no enteric bacterial pathogen was detected, although stool microscopy showed a similar frequency of different enteric parasites as seen in the acute stage.
Blood leucocytes
A higher blood leucocyte level was seen during the acute stage of the disease in children and adults in both groups of cholera patients compared with healthy controls. The percentage of polymorphs in blood was elevated in adult cholera patients during the acute stage of infection compared with the convalescence phase (p = 0.011−0.001) or with levels in healthy volunteers (p = 0.027). A comparison of the percentage of eosinophilic granulocytes in blood showed that levels were increased from the acute stage (median 3.2%) to convalescence at day 7 (median 6.0%; p = 0.022) for O139 infected patients, and between the acute stage (median 4.11%) and convalescence at day 30 (median 7.5%; p = 0.049) in adult O1 infected cholera patients (p = 0.023). In children with diarrhoea, no increase in blood eosinophil levels was observed.
Gross histopathology
In the different groups of cholera patients, the overall architectural integrity of the duodenal and rectal mucosa was undisturbed during the acute stage. The mucosa showed marked congestion of blood vessels compared with healthy controls. Endothelial cells appeared swollen, with margination of neutrophil polymorphs into the LP. The vascular response persisted with endothelial swelling and PMN margination until day 30. In the rectal mucosa of adult and paediatric patients, vascular congestion was also observed but was less prominent than in the duodenum during the acute stage. Margination of eosinophils in blood vessels and endothelial swelling persisted until convalescence.
Polymorphonuclear neutrophils
Elevated numbers of neutrophil polymorphs were seen in the LP and infiltrating the surface and/or crypt epithelium during the acute stage in both adult duodenal and rectal sections of cholera patients (p = 0.04 to <0.001) (fig 1 ▶). These cells remained elevated in comparison with healthy controls over the study period (p = 0.026−0.004). The magnitude of the response appeared to be higher in the duodenum than in rectal sites (NS).
Figure 1.
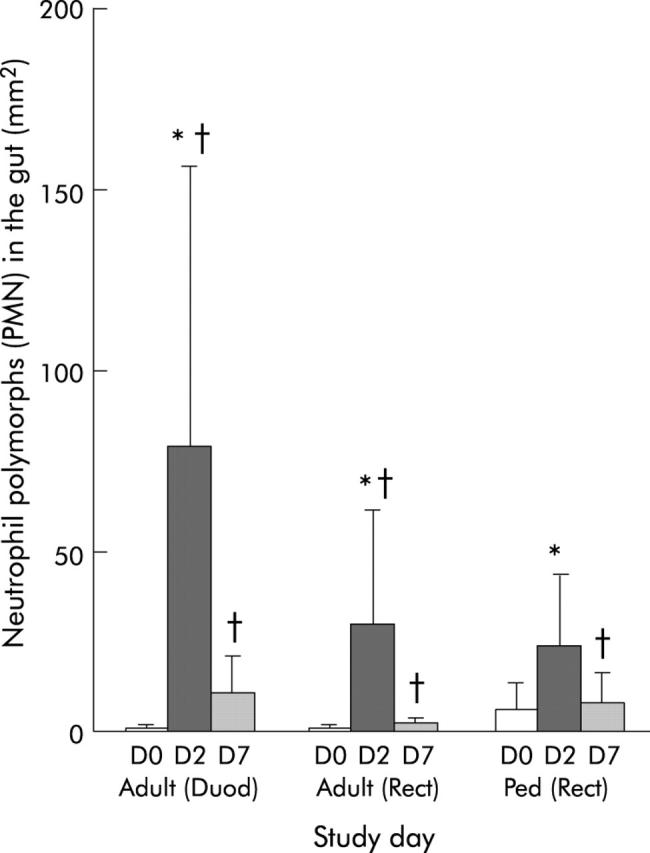
Levels of neutrophil polymorphs in duodenal (Duod) and rectal (Rect) sections of adults, and in rectal sections (Rect) of paediatric patients (Ped). Polymorphonuclear neutrophils (PMN) were stained by the chloroacetate method and counted manually using a ocular micrometer (Olympus) fitted into the eyepiece, and data were calculated as the number of cells per mm2 field area. Levels are shown for patients during the acute stage on day 2 (D2) and during convalescence on day 7 (D7) after the onset of diarrhoea. Data for healthy controls (adults or children) are shown as day 0 (D0). Bars are geometric means and lines show ranges (±SEM). *p<0.05 between patients on day 2 and convalescence at day 7; †p<0.05 between patients at different phases of the disease and healthy controls. Probability values were determined by the Wilcoxon signed rank test comparing differences in cell numbers at different times within the same group of patients and by the Mann-Whitney U test comparing patients with healthy controls.
When PMN numbers were compared in O1 and O139 patients at different locations of the gut, higher numbers were seen in duodenal tissues of O1 than of O139 infected patients (NS).
Duodenal sections of adult O1 cholera patients showed an increase in MPO, lactoferrin (table 1 ▶), and α-defensin (fig 2A ▶, table 1 ▶) during the acute stage of infection (p = 0.002 to <0.001).
Table 1.
Involvement of mediators in the regulation of inflammatory cells in cholera in adult patients
| Mediator | O1 patients (day 2)† | O1 patients (day 7) | O1 patients (day 30) | Healthy controls (day 0) |
| PGHS-1 | 0.26 (0.2–0.4)§ | 0.39 (0.27–0.57)§ | 0.16 (0.15–0.18) | 0.03 (0.01–0.06) |
| Tryptase | 1.58 (1.0–1.8)*‡ | 2.1 (1.874–2.630)§ | 2.6 (1.14–3.55)§ | 1.081 (0.932–1.697) |
| Chymase | 0.27 (0.2–0.8) | 0.21 (0.13–0.35) | 0.64 (0.43–0.96)§ | 0.11 (0.07–0.15) |
| SCF | 5.14 (4.0–6.57)§ | 3.28 (2.72–4.0)§ | 3.2 (2.43–4.2)§ | 0.87 (0.56–1.33) |
| IL-3 | 0.61 (0.38–0.96)*‡ | 5.05 (6.19–4.12)§ | 5.3 (7.56–3.68)§ | 0.19 (0.08–0.4) |
| IL-4 | 2.22 (1.42–3.49) | ND | 3.46 (2.20–5.44) | 1.9 (1.6–2.3) |
| IL-5 | 0.04 (0.01–0.16) | 0.13 (0.04–0.33) | 0.04 (0.01–0.09) | 0.06 (0.03–0.14) |
| TNF-α | 6.16 (5.3–7.17)‡§ | ND | 0.61 (0.53–0.71) | 0.25 (0.12–0.51) |
| Eotaxin | 7.8 (6.8–8.93)*‡§ | 0.58 (0.42–0.8) | 2.3 (1.87–2.81) | 1.52 (1.35–1.71) |
| MBP | 1.51(0.93–2.61) | 3.37 (2.57–4.42)*§ | 3.41 (2.87–4.07)‡§ | 1.8 (1.59–3.04) |
| MPO | 1.45 (1.08–8.87)*‡§ | 0.01 (0.01–0.05) | 0.01 (0.001–0.05) | 0.01 (0.002–0.02) |
| Lactoferrin | 1.16 (0.53–1.71)*‡§ | 0.02 (0.01–0.23) | 0.05 (0.01–0.12) | 0.003 (0.001–0.01) |
| Defensin | 5.470 (3.4–7.4)*‡§ | 2.43 (1.49–4.23)§ | 2.40 (1.52–3.25)§ | 0.89 (0.71–1.49) |
| CCR3 | 1.65 (1.41–1.93)‡§ | 1.33 (1.21–1.45)§ | 2.73 (2.61–2.86)§ | 0.17 (0.12–0.23) |
| IgE | 81 (37.8–93.1) | 46.4 (33.0–122.7) | 45.39 (41.51–76.8) | 42.6 (35.0–52.4) |
Paraffin embedded duodenal sections or cryostat sections were studied in adults.1
†Days after onset of disease in patients.
The average area for each section was 9.3×105 μm2 for duodenal biopsies. Quantification of the immunoreaction positive area relative to the total tissue section was done by a computerised image analysing technique and the results are expressed as percentage for the ratio of the positive area to the total area.
Values are median frequencies of stained cells per mm2 (25th and 75th percentiles).
*p⩽0.05 between patients during the acute stage and early convalescence; ‡p⩽0.05 between patients during the acute stage and late convalescence; §p⩽0.05 between patients and healthy controls. Probability values were determined by the Wilcoxon signed rank test comparing differences in cell numbers at different times within the same group of patients and by the Mann-Whitney U test comparing patients with healthy controls.
PGHS-1, prostaglandin H synthase 1; SCF, stem cell factor; MBP, major basic protein; TNF-α, tumour necrosis factor α; IL, interleukin; MPO, myeloperoxidase; CCR3, chemokine receptor 3; ND, not done.
Figure 2.
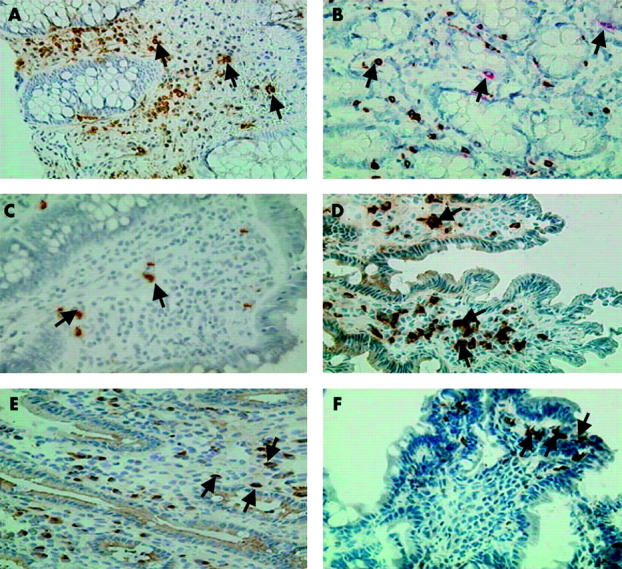
Immunohistochemical analyses of duodenal mucosa for inflammatory mediators. Arrows show expression of α-defensin (A). (B) Expression of tryptase and coexpression with chymase (C) eotaxin. (D) Chemokine receptor 3 (CCR3), (E) stem cell factor (SCF), and (F) prostaglandin H synthase 1 (PGHS-1) in duodenal biopsies from adult patients with cholera. Sections during the acute stage (A, C, D, E) or the convalescence phase (B, F) are shown. Paraffin (A, B) or frozen (C–F) sections were used. Magnification 400×.
Mucosal mast cells
Increased MMC numbers were seen in the crypt and villus LP of adult cholera patients by convalescence (p = 0.02−0.003) (table 2 ▶). In paediatric patients, an increase in total MMCs was also seen in rectal sections by early convalescence (p = 0.031) and in comparison with healthy controls (p<0.005). Degranulating MMC were detected in duodenal and rectal sections by day 2 to day 30 post-onset compared with healthy controls where degranulating mast cells were less common and most MMC appeared intact. However, the intensity of the degranulation of MMC was more extensive and marked in duodenal than in rectal mucosa. The numbers of MMC were also analysed separately in O1 and O139 infected cholera patients. During the acute stage, numbers were already increased in duodenal sections obtained from O139 patients compared with those seen in healthy controls (p = 0.026). However, no increase was seen over the course of the disease in contrast with that observed in O1 patients. No other difference was seen between the two groups in either children or adults.
Table 2.
Mucosal mast cells in duodenal and rectal sites in patients with cholera and in healthy controls
| Study day‡ | Lamina propria | Epithelium | Total | ||
| Crypt | Villus | Crypt | Villus | ||
| Adult duodenal tissue | |||||
| Day 2 | 9.7 (8.0–14.6) | 5.81 (4.14–8.3) | 2.78 (0.96–3.70)*† | 0.01 (0.01–0.26) | 18.35 (15.3–27.9) |
| Day 7 | 17.7 (14.7–32.3)† | 7.6 (6.7–13.3) | 1.3 (0.53–3.94) | 0.01 (0.01–0.46) | 30.5 (21.1–50.0)*† |
| Day 30 | 23.1 (19.8–31.7)† | 15.9 (10.81–18.92)† | 1.16 (0.45–1.54) | 0.01 (0.01–0.01) | 41.32 (31.53–49.1)*† |
| HC | 7.1 (1.13–26.9) | 5.61 (3.6–16.13) | 0.57 (0.01–2.01) | 0.01 (0.01–0.01) | 13.23 (4.62–49.1) |
| Deeper | Upper | Deeper | Upper | Total | |
| ‡Days after onset of disease in patients. | |||||
| HC, healthy controls. | |||||
| Significant difference (*p⩽0.05) between patients and controls; significant difference (†p⩽0.05) between the acute and convalescent stages of the disease. | |||||
| Adult rectal tissue | |||||
| Day 2 | 11.03 (8.63–15.73) | 3.92 (2.62–5.56) | 0.68 (0.01–2) | 0.51 (0.01–1.45) | 17.84 (12.6–26.9) |
| Day 7 | 15.30 (12.03–28.7)† | 10.1 (3.1–13.1) | 1.2 (0.40–1.62) | 0.40 (0.01–1.80) | 36.1 (15.3–45.0)† |
| Day 30 | 15.60 (10.11–18.7) | 6.82 (4.2–10.30) | 0.83 (0.12–1.14) | 0.38 (0.01–1.53) | 23.25 (16.2–28.92) |
| HC | 12.54 (6.33–14.82) | 3.11 (3.05–5.56) | 0.49 (0.46–1.28) | 0.43 (0.01–3.29) | 16.39 (10.29–22.91) |
| Paediatric rectal tissue | |||||
| Day 2 | 14.61 (9.75–17.58) | 4.42 (2.68–10.07) | 1.16 (0.38–2.63) | 0.72 (0.01–1.36) | 22.16 (13.78–31.37) |
| Day 7 | 15.79 (12.59–23.61) | 8.72 (4.59–11.82) | 2.47 (0.90–4.89) | 0.48 (0.01–2.39) | 35.42 (19.52–47.35)*† |
| Day 30 | 20.13 (12.26–31.85) | 7.34 (5.19–10.16) | 2.0 (1.37–3.61) | 0.55 (0.01–1.55) | 31.0 (20.21–42.41)* |
| HC | 10.75 (8.92–14.02) | 5.86 (1.69–7.12) | 1.06 (0.74–1.74) | 0.63 (0.39–1.29) | 19.85 (11.57–24.04) |
Ultrastructural studies showed that lower numbers of mast cells were in a normal state in O1 and O139 infected cholera patients over the course of the disease process (table 3 ▶, fig 3A ▶). The pattern was of both a piecemeal degranulation (PMD)- and anaphylactic degranulation (AND)-type (fig 3B ▶) with a generally higher frequency of the PMD-type of pattern (table 3 ▶). Some MMC showed a mild type of PMD where the granules were swollen and there was partial loss of granular material, whereas more cells showed a severe grade of damage resulting in empty granule chambers (p = 0.046 to <0.001). In some sections intraepithelial mast cells could be seen which had lost most of the granules by the AND mechanism and the empty granule membranes had fused to form canaliculi within the cytoplasm (fig 3C ▶). Activation of MMC was shown by the presence of large round dense particles of lipid bodies (fig 3B ▶).
Table 3.
Ultrastructural studies of mast cells in the duodenal mucosa of study subjects
| Type of change | Healthy controls (n = 23)† | O1 patients (day 2)‡ (n = 50) | O1 patients (day 7) (n = 35) | O1 patients (day 30) (n = 34) | O139 patients (day 2) (n = 17) | O139 patients (day 7) (n = 9) | O139 patients (day 30) (n = 16) |
| Normal | 35§ | 12* | 6* | 6* | 0* | 0* | 0* |
| PMD (1+) | 35 | 6* | 17 | 32 | 12 | 44 | 18 |
| PMD (2+ to 3+) | 0 | 61* | 60* | 53* | 71* | 33* | 25* |
| AND | 26 | 20 | 18 | 15 | 12 | 22 | 62* |
| Lipid body activation | 35 | 56 | 60 | 50 | 82* | 77* | 62 |
†n = number of mast cells studied ultrastructurally.
‡Days after onset of disease in patients.
§Numbers indicate percentage of cells with the particular type of activation that were studied.
*p<0.05, χ2 or Fisher’s exact test was used to determine statistically significant differences between patients at the different stages of infection and healthy controls.
PMD, piecemeal degranulation; AND, anaphylactic degranulation.
Figure 3.
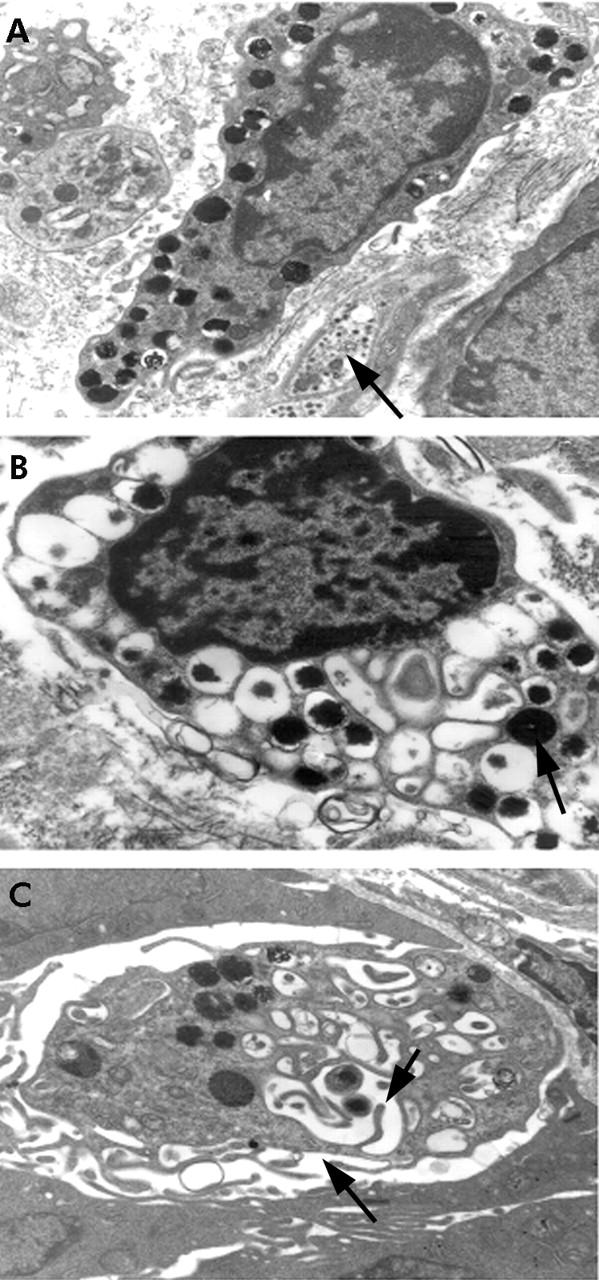
Ultrastructural studies of mucosal mast cells (MMC) in the gut. Arrow shows (A) normal MMC with many dark staining granules adjacent to a non-myelinated nerve fibril. Magnification 12 000×. (B) Both piecemeal degranulation (PMD) and anaphylactic degranulation (AND); arrow shows large dense particles of lipid body indicative of activity. Magnification 16 400×. (C) An intraepithelial mast cell showing loss of most of the granules by AND; arrows show empty granular membranes that have fused to form canaliculi within the cytoplasm. Magnification 22 800×.
Mucosal mast cell specific proteases were also studied in the duodenum using immunohistochemical procedures. There was increased expression of tryptase during the acute and convalescence stages compared with healthy controls (p = 0.012−0.018) (table 1 ▶). Upregulation of the serine protease chymase was also observed in duodenal tissues. The numbers of cells positive for tryptase were higher than those positive for chymase over the course of the disease (p = 0.016−0.008). When double stained, colocalisation of the two proteases could be seen in cells (fig 2B ▶).
Eosinophils
Numbers of eosinophils in duodenal and rectal tissues increased during convalescence in adult and paediatric cholera patients (p = 0.015−0.002) (fig 4 ▶). Localisation was mostly in the villus and crypt region (p = 0.041−0.002) and increased numbers of intraepithelial eosinophils were detected (p = 0.013−0.008). In addition to the quantification above, it was observed that free eosinophilic granules were present in the entire LP and also in the intraepithelial region of duodenal and rectal sections in cholera patients by early convalescence. A high intensity of degranulation was frequently found near the muscularis mucosa, in the deeper LP and sometimes near the surface epithelium. In some patients, degranulation spread to the entire LP in close proximity to the surface epithelium.
Figure 4.
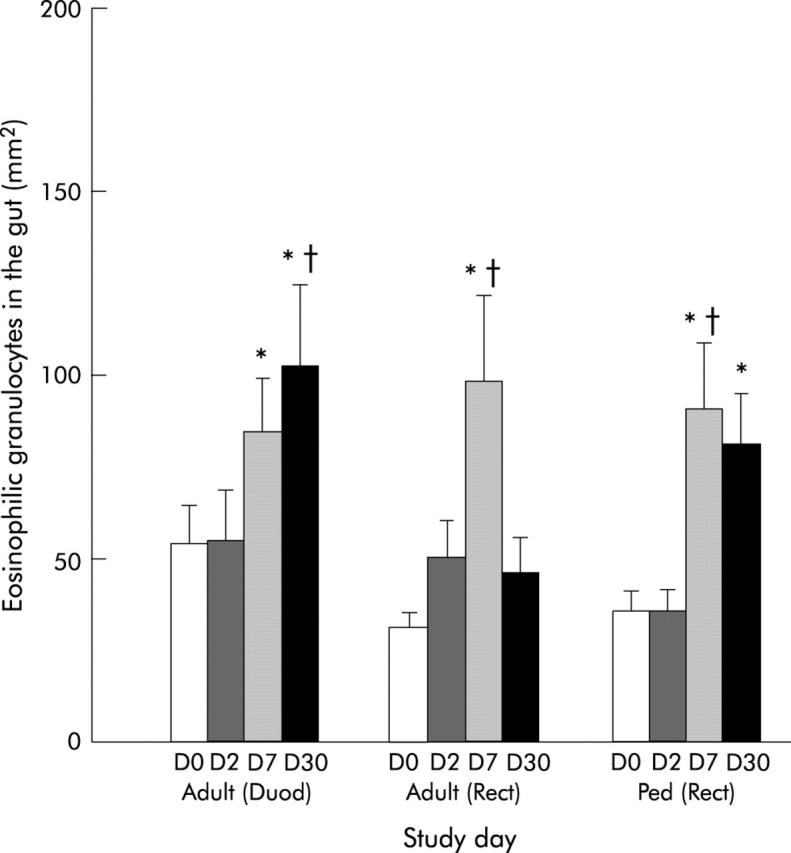
Levels of eosinophils in duodenal (Duod) and rectal (Rect) sections of adults, and in rectal (Rect) sections of paediatric patients (Ped). Levels are shown for patients during the acute stage on day 2 (D2) and during convalescence on day 7 (D7) and day 30 (D30) after the onset of diarrhoea. Data for healthy controls (adults or children) are also shown as day 0 (D0). *p<0.05 between patients on day 2 and convalescence on day 7 or day 30; †p<0.05 between patients at different phases of disease and healthy controls. Bars are geometric means (SEM) and ranges.
When the results were compared between O1 and O139 infected patients, a gradual increase in the numbers was observed in duodenal sections in O1 patients over the course of the disease. The numbers peaked on day 30, which were significantly higher than during the acute stage or in healthy subjects (p = 0.028−0.006). A statistically significant increase was however not seen in eosinophil numbers in O139 patients over the disease period compared with healthy controls. The increase appeared to be earlier in O139 than in O1 patients (median value for O1 34.43/mm2 and O139 57.68/mm2; NS). At late convalescence, significantly higher numbers of eosinophils were quantified in O1 patients compared with O139 patients (median value for O1 81.30/mm2 and O139 32.45/mm2; p = 0.004).
To better understand activation of eosinophils, changes in bactericidal protein MBP were studied in duodenal biopsies from adult cholera patients and an increase in MBP was seen at convalescence (p⩾0.07) (table 1 ▶).
Electron microscopic studies showed that a relatively low percentage of eosinophils appeared in the normal stage in O1 or O139 patients (p⩽0.001) (table 4 ▶, fig 5A ▶). Cells appeared to be activated and a PMD pattern of degranulation was observed with loss in both core (fig 5B ▶) and matrix (fig 5C ▶) regions. At convalescence, eosinophils could also be seen which had undergone damage (fig 5D ▶). Figure 5 ▶ also shows condensation of nuclear material. The pattern appeared to be more severe in O1 patients over the course of the disease period, while it reversed to normal morphology in O139 patients by convalescence (table 4 ▶).
Table 4.
Ultrastructural studies of eosinophils in the duodenal mucosa of study subjects
| Type of change | Healthy controls (n = 25)† | O1 patients (day2) (n = 40) | O1 patients (day 7) (n = 34) | O1 patients (day 30) (n = 27) | O139 patients (day 2) (n = 10) | O139 patients (day 7) (n = 12) | O139 patients (day 30) (n = 13) |
| Normal | 60‡ | 0* | 0* | 0* | 10* | 8* | 8* |
| PMD (1+) | 20 | 19 | 21 | 7 | 10 | 33 | 31 |
| PMD (2+ to 3+) | 4 | 78* | 77* | 88* | 60* | 16 | 16 |
| PMD (core) | 0 | 7 | 15* | 19* | 0 | 16 | 8 |
| PMD (matrix) | 12 | 43* | 44* | 26 | 50* | 25 | 8 |
| PMD (core and matrix) | 4 | 48* | 35* | 48* | 20 | 8 | 0 |
| Degranulation and activation | 8 | 63* | 79* | 59* | 60* | 42* | 23 |
| Necrosis | 8 | 10 | 15 | 33* | 20 | 50* | 62* |
†n = number of eosinophils studied ultrastructurally.
‡Percentages of cells with the particular type of activation that were studied.
*p<0.05, χ2 or Fisher’s exact test was used to determine statistically significant differences between patients at the different stages of infection and healthy controls.
PMD, piecemeal degranulation.
Figure 5.

Electron micrograph of uranyl acetate and lead citrate stained sections showing eosinophils in the duodenal section of a Vibrio cholerae O1 infected patient. (A) Eosinophil with granules containing a dense central crystalline core and lighter staining matrix (long arrows) and an irregular shaped elongated nucleus with a blunt surface (short arrows); magnification 12 000×. (B) Activated eosinophil with granules showing piecemeal degranulation and loss of core which appear as paler areas (arrows); magnification 16 400×. (C) Degranulated eosinophil showing granules with piecemeal degranulation and loss of matrix (arrows); magnification 12 000×. (D) Eosinophil that has undergone damage with condensation of nuclear material (arrows); magnification 16 400×.
Mediators and regulatory molecules in the duodenum in V cholerae O1 patients
The β-chemokine eotaxin was increased during the acute stage of infection in comparison with the other study groups and could be visualised in the cytoplasmic area of cells in the LP (p = 0.003−<0.001) (table 1 ▶, fig 2C ▶). Intense staining of cells for the chemokine receptor CCR3 (fig 2D ▶) was also seen, which was elevated during the acute stage. IL-3 was localised in the cytoplasmic area in cells in the LP, which increased during early and late convalescence (p = 0.01−0.003). In contrast, TNF-α was already increased during the acute stage (table 1 ▶, p = 0.036−0.008) and could be localised in the LP region in the cytoplasmic area of cells. Staining could also be detected in the crypt region in most patients studied, with more extracellular area than cells being detected. Another chemokine, SCF, was increased during the acute and convalescence phases compared with healthy controls (table 1 ▶, fig 2E ▶).
Cells morphologically resembling mast cells were positive for IL-5. Expression of IL-4 was also seen which was located in single cells in the LP. Both cytokines were detected during the acute stage as well at during convalescence (NS) and expression was not different from that seen in healthy controls.
The constitutive enzyme PGHS-1 was elevated in the cytoplasmic area of cells in the mucosa during the acute stage (p = 0.03) and during early convalescence compared with controls (p = 0.032) (fig 2F ▶). Single cells staining for IgE were observed. However, when quantified, there was no difference in the stained area in patients during the acute stage of the infection and healthy controls.
DISCUSSION
In this study we have been able to demonstrate that innate cells are activated and mediators are upregulated at the mucosal surface following natural infection with V cholerae O1 and O139.
The location of mast cells at the mucosa and their ability to release potent mediators indicate that these cells play an important role in the host defence against bacterial infection.23 Mucosal mast cells are known to be activated by binding of IL-3 and SCF which may be produced from T cells and epithelial cells, among others, in the gut.24 The presence of both IL-3 and SCF in duodenal sections from adult cholera patients suggests their role in activation of MMC and release of Th2 type cytokines IL-4 and IL-5. In our study we could not detect an increase in IL-4 or IL-5 at the mucosal surface. However, physiological amounts may be enough to have significant effects on cells in the mucosa.24 It is believed that mast cells serve as a source of IL-4, which is an early response cytokine that activates T helper cell responses.
Migration and mobilisation of neutrophil polymorphs to sites of infection and inflammation is a primary host defence mechanism. A variety of molecules stimulate migration of PMN. Mast cell derived TNF-α plays a critical role in host defence by recruitment of neutrophils to sites of infection.24 We found increased localisation of TNF-α during the acute stage of infection and suggest that in cholera it may act as an early response cytokine to mediate upregulation of PMN and activate secretion of bactericidal proteins. In addition, leukotrienes (LT) such as LTB4 and LTC4 produced by mast cells also induce migration of neutrophils.25 In an earlier study we showed an increase in LTB4 in intestinal secretions in cholera patients.5 In the present study we found an increase in lipid bodies in mast cells, suggesting enhanced synthesis of the arachidonic acid metabolites. Thus both TNF-α and LTB4 may induce migration and activation of PMN. Other arachidonic acid metabolites including prostaglandin E2 are also increased in cholera.5,26 In the present study, we also found increased localisation of PGH synthase 1, a constitutive enzyme mediating synthesis of eicosinoids at early convalescence, providing evidence for an increase in arachidonic acid metabolites and lipid bodies in cholera. In addition to changes in the gut, we also found increases in leucocytes, including PMN, in blood. Such increases have been seen previously in cholera patients.1,5
Some key bactericidal proteins, lactoferrin, MPO, as well α-defensin were also elevated during the acute stage, further highlighting the functional role of PMN in cholera. Lactoferrin is known to have bactericidal killing properties on V cholerae O14 and β-defensins have been detected in patients with acute watery diarrhoea.27 MPO, which is involved in bactericidal activity, is also produced by neutrophil polymorphs. Its upregulation at the local site as well as in stools from cholera patients5 suggests that it may also have a protective role by generating reactive products that have potent antibacterial properties.28
The increase and activation of eosinophils in cholera is not surprising as it is known that there is close interaction between mast cells and eosinophils in the gut.29,30 We also found increases in eosinophils in the blood of cholera patient. Activation of mast cells and release of IL-5 is needed for activation of eosinophils. Upregulation of eotaxin, which is a chemokine and chemoattractant for these cells, in the mucosa was seen at the onset. Increased localisation of CCR3, the receptor for eotaxin, was also seen. The chemokine binding receptor CCR3 is known to be present on eosinophils.31 We found tryptase and chymase double positive mast cells in the mucosa and were also able to detect CCR3 and tryptase double positive cells. Thus eotaxin may activate both mast cells and eosinophils in the gut by binding to CCR3 receptors26 and may serve as a chemoattractant.
The results presented here showed an extensive piecemeal type of degranulation of innate cells. This may reflect antigen induced slow activation from stimulation by bacterial products (cholera toxin, lipopolysaccharide, etc) or by binding of V cholerae to host cell surfaces which may result in signals to mast cells and other accompanying cells to orchestrate an appropriate response.
Activation of inflammatory cells has generally been associated with allergic disorders and parasitic infections,24 which also results in an increase in the IgE isotype of antibodies. Although IgE was detected in the gut of cholera patients, an increase was not seen over the course of the disease period. Our previous studies have also shown that cholera does not induce increases in levels of total IgE in blood.8
Although V cholerae colonise the small intestine, it is evident that morphological and vascular changes can also be seen in distal rectal tissues.1,17 Based on the notion of a common mucosal immune system,31 response is seen not only at the site of antigen deposition but also at remote mucosal sites. There is evidence that immunisation with cholera toxin via the rectal or gastric route induces IgA responses in duodenal secretions.32 Our results also reveal that in natural disease, activation of innate immunity is seen not only in the small intestine but also at rectal sites. Activation was however more extensive and marked in the duodenal than in the rectal mucosa. This information is not only useful for understanding the pathogenesis of acute watery diarrhoea but also for the development of immunisation strategies for vaccines for other mucosa associated diseases.
The study was also designed to investigate if V cholerae O139 by virtue of possessing a capsular polysaccharide induces a different pattern of response from that seen after V cholerae O1 infection.33 Our results showed that inflammatory responses in duodenal tissues of O139 patients were upregulated, as in O1 infected patients. However, a difference was seen only in the kinetics of the response in O139 patients. Eosinophil and mast cell numbers appeared to be more elevated at the duodenal site at the onset of disease in O139 patients compared with O1 infected patients. The numbers of cells also declined more rapidly during convalescence in O139 infected patients. The presence of a capsule and/or antigens on O139 strains does not appear to give it added virulence and inflammation, compared with what is seen in O1 induced disease, and is similar to the adaptive response we have observed previously.7,8,12,34
It must be emphasised that in cholera, the response during the acute stage is at variance with that seen in an invasive disease such as shigellosis.20,35 Gross histopathological features of the gut are undisturbed unlike those seen in invasive diarrhoea14 where an intense reaction at the mucosa occurs as a result of invasion and destruction by the pathogen. Changes in the rectal surface, ranging from mild to severe inflammation, is accompanied by leucocytes, red blood cells, and macrophages in stool in over 50% of patients.14 These features are characteristically absent in cholera.5 Increased levels of inflammatory markers are seen in Shigella infections in comparison with those seen in cholera.35 Thus higher levels of C reactive protein in blood (p = 0.03), and TNF-α and IL-1β in stool (p<0.001), were detected in patients with bloody dysentery. It is interesting however that mast cells and eosinophils, including other innate mediators, are in general comparable in shigellosis36 and cholera. In contrast, in shigellosis, these factors may be protective but may also contribute to immunopathogenesis at the local site.
Thus V cholerae activate these cells to release mediators, chemokines, and cytokines to modulate the host’s innate immune response and produce a more robust adaptive immune response.26,37 This results in clearance of the pathogen and rapid recovery. For a vaccine to be protective against cholera it may need to simulate these features seen following natural infection.
Acknowledgments
This study was conducted at the ICDDR, B: Centre for Health and Population Research, with the support of grants from the Swedish Agency for Research Cooperation with Developing Countries (Sida-SAREC) (grant 1998-05440). ICDDR, B acknowledges with gratitude the commitment of Sida-SAREC to the Centre’s research efforts.
Abbreviations
MMC, mucosal mast cell
PMN, polymorphonuclear neutrophil
LP, lamina propria
PMD, piecemeal degranulation
AND, anaphylactic degranulation
MBP, major basic protein
TNF-α, tumour necrosis factor α
IL, interleukin
MPO, myeloperoxidase
CCR3, chemokine receptor 3
LT, leukotrienes
PGHS-1, prostaglandin H synthase 1
SCF, stem cell factor
REFERENCES
- 1.Mathan MM, Chandy G, Mathan VI. Ultrastructural changes in the upper small intestinal mucosa in patients with cholera. Gastroenterology 1995;109:422–30. [DOI] [PubMed] [Google Scholar]
- 2.Janoff EN, Hayakawa H, Taylor DN, et al. Nitric oxide production during Vibrio cholerae infection. Am J Physiol 1997;273:G1160–7. [DOI] [PubMed] [Google Scholar]
- 3.Silva TM, Schleupner MA, Tacket CO, et al. New evidence for an inflammatory component in diarrhea caused by selected new, live attenuated cholera vaccines and by El Tor and Q139 Vibrio cholerae. Infect Immun 1996;64:2362–4. [DOI] [PMC free article] [PubMed] [Google Scholar]
- 4.Arnold RR, Brewer M, Gauthier JJ. Bactericidal activity of human lactoferrin: sensitivity of a variety of microorganisms. Infect Immun 1980;28:893–8. [DOI] [PMC free article] [PubMed] [Google Scholar]
- 5.Qadri F, Raqib R, Ahmed F, et al. Increased levels of inflammatory mediators in children and adults infected with Vibrio cholerae O1 and O139. Clin Diagn Lab Immunol 2002;9:221–9. [DOI] [PMC free article] [PubMed] [Google Scholar]
- 6.Marinaro M, Staats HF, Hiroi T, et al. Mucosal adjuvant effect of cholera toxin in mice results from induction of T helper 2 (Th2) cells and IL-4. J Immunol 1995;155:4621–9. [PubMed] [Google Scholar]
- 7.Qadri F, Ahmed F, Karim MM, et al. Lipopolysaccharide- and cholera toxin-specific subclass distribution of B-cell responses in cholera. Clin Diagn Lab Immunol 1999;6:812–18. [DOI] [PMC free article] [PubMed] [Google Scholar]
- 8.Qadri F, Asaduzzaman M, Wenneras C, et al. Enterotoxin-specific immunoglobulin E responses in humans after infection or vaccination with diarrhea-causing enteropathogens. Infect Immun 2000;68:6077–81. [DOI] [PMC free article] [PubMed] [Google Scholar]
- 9.Leal-Berumen I, Snider DP, Barajas-Lopez C, et al. Cholera toxin increases IL-6 synthesis and decreases TNF-alpha production by rat peritoneal mast cells. J Immunol 1996;156:316–21. [PubMed] [Google Scholar]
- 10.Glass RI, Becker S, Huq MI, et al. Endemic cholera in rural Bangladesh, 1966–1980. Am J Epidemiol 1982;116:959–70. [DOI] [PubMed] [Google Scholar]
- 11.Marcinkiewicz J. Neutrophil chloramines: missing links between innate and acquired immunity. Immunol Today 1997;18:577–80. [DOI] [PubMed] [Google Scholar]
- 12.Qadri F, Wenneras C, Albert MJ, et al. Comparison of immune responses in patients infected with Vibrio cholerae O139 and O1. Infect Immun 1997;65:3571–6. [DOI] [PMC free article] [PubMed] [Google Scholar]
- 13.WHO. Diarrhoeal diseases control programme. Global activities, 1988–1989. Wkly Epidemiol Rec 1990;65:289–92. [PubMed] [Google Scholar]
- 14.Raqib R, Mia SM, Qadri F, et al. Innate immune responses in children and adults with Shigellosis. Infect Immun 2000;68:3620–9. [DOI] [PMC free article] [PubMed] [Google Scholar]
- 15.Qadri F, Das SK, Faruque AS, et al. Prevalence of toxin types and colonization factors in enterotoxigenic Escherichia coli isolated during a 2-year period from diarrheal patients in Bangladesh. J Clin Microbiol 2000;38:27–31. [DOI] [PMC free article] [PubMed] [Google Scholar]
- 16.WHO. Programme for control of diarrhoeal diseases. Geneva: WHO, CDD 83.3 1987;Rev 1:9–20. [Google Scholar]
- 17.Pulimood AB, Mathan MM, Mathan VI. Quantitative and ultrastructural analysis of rectal mucosal mast cells in acute infectious diarrhea. Dig Dis Sci 1998;43:2111–16. [DOI] [PubMed] [Google Scholar]
- 18.Dvorak AM, Tepper RI, Weller PF, et al. Piecemeal degranulation of mast cells in the inflammatory eyelid lesions of interleukin-4 transgenic mice. Evidence of mast cell histamine release in vivo by diamine oxidase-gold enzyme-affinity ultrastructural cytochemistry. Blood 1994;83:3600–12. [PubMed] [Google Scholar]
- 19.Jolly S, Detilleux J, Coignoul F, et al. Enzyme-histochemical detection of a chymase-like proteinase within bovine mucosal and connective tissue mast cells. J Comp Pathol 2000;122:155–62. [DOI] [PubMed] [Google Scholar]
- 20.Raqib R, Lindberg AA, Bjork L, et al. Down-regulation of gamma interferon, tumor necrosis factor type I, interleukin 1 (IL-1) type I, IL-3, IL-4, and transforming growth factor beta type I receptors at the local site during the acute phase of Shigella infection. Infect Immun 1995;63:3079–87. [DOI] [PMC free article] [PubMed] [Google Scholar]
- 21.Lindholm C, Quiding-Jarbrink M, Lonroth H, et al. Local cytokine response in Helicobacter pylori-infected subjects. Infect Immun 1998;66:5964–71. [DOI] [PMC free article] [PubMed] [Google Scholar]
- 22.Bjork L, Fehniger TE, Andersson U, et al. Computerized assessment of production of multiple human cytokines at the single-cell level using image analysis. J Leukoc Biol 1996;59:287–95. [DOI] [PubMed] [Google Scholar]
- 23.Abraham SN, Malaviya R. Mast cell modulation of the innate immune response to enterobacterial infection. Adv Exp Med Biol 2000;479:91–105. [DOI] [PubMed] [Google Scholar]
- 24.Abraham SN, Malaviya R. Mast cells in infection and immunity. Infect Immun 1997;65:3501–8. [DOI] [PMC free article] [PubMed] [Google Scholar]
- 25.Malaviya R, Abraham SN. Role of mast cell leukotrienes in neutrophil recruitment and bacterial clearance in infectious peritonitis. J Leukoc Biol 2000;67:841–6. [DOI] [PubMed] [Google Scholar]
- 26.Speelman P, Rabbani GH, Bukhave K, et al. Increased jejunal prostaglandin E2 concentrations in patients with acute cholera. Gut 1985;26:188–93. [DOI] [PMC free article] [PubMed] [Google Scholar]
- 27.Islam D, Bandholtz L, Nilsson J, et al. Downregulation of bactericidal peptides in enteric infections: a novel immune escape mechanism with bacterial DNA as a potential regulator. Nat Med 2001;7:180–5. [DOI] [PubMed] [Google Scholar]
- 28.Pruitt MKRB, Rahemtulla B, Rahemtulla F, et al. Innate humoral factors. In: Ogara PL, Mestecky J, Lamm ME, et al, eds. Mucosal immunology, 2nd edn. San Diego: Academic Press Inc, 1999:65–8.
- 29.Romagnani P, De Paulis A, Beltrame C, et al. Tryptase-chymase double-positive human mast cells express the eotaxin receptor CCR3 and are attracted by CCR3-binding chemokines. Am J Pathol 1999;155:1195–204. [DOI] [PMC free article] [PubMed] [Google Scholar]
- 30.Lin TJBD. Mast cells and eosinophils in mucosal defences and pathogenesis. In: Ogara PL, Mestecky J, Lamm ME, et al, eds. Mucosal immunology, 2nd edn. San Diego: Academic Press Inc, 1999:469–82.
- 31.Czerkinsky C, Prince SJ, Michalek SM, et al. IgA antibody-producing cells in peripheral blood after antigen ingestion: evidence for a common mucosal immune system in humans. Proc Natl Acad Sci U S A 1987;84:2449–53. [DOI] [PMC free article] [PubMed] [Google Scholar]
- 32.Haneberg B, Kendall D, Amerongen HM, et al. Induction of specific immunoglobulin A in the small intestine, colon-rectum, and vagina measured by a new method for collection of secretions from local mucosal surfaces. Infect Immun 1994;62:15–23. [DOI] [PMC free article] [PubMed] [Google Scholar]
- 33.Johnson JA, Salles CA, Panigrahi P, et al. Vibrio cholerae O139 synonym bengal is closely related to Vibrio cholerae El Tor but has important differences. Infect Immun 1994;62:2108–10. [DOI] [PMC free article] [PubMed] [Google Scholar]
- 34.Qadri F, Mohi G, Hossain J, et al. Comparison of the vibriocidal antibody response in cholera due to Vibrio cholerae O139 Bengal with the response in cholera due to Vibrio cholerae O1. Clin Diagn Lab Immunol 1995;2:685–8. [DOI] [PMC free article] [PubMed] [Google Scholar]
- 35.Qadri F, Alam MS, Nishibuchi M, et al. Adaptive and inflammatory immune responses in patients infected with strains of Vibrio parahaemolyticus. J Infect Dis 2003;187:1085–96. [DOI] [PubMed] [Google Scholar]
- 36.Raqib R, Moly PK, Sarker P, et al. Persistence of mucosal mast cells and eosinophils in Shigella-infected children. Infect Immun 2003;71:2684–92. [DOI] [PMC free article] [PubMed] [Google Scholar]
- 37.Chertov O, Yang D, Howard OM, et al. Leukocyte granule proteins mobilize innate host defenses and adaptive immune responses. Immunol Rev 2000;177:68–78. [DOI] [PubMed] [Google Scholar]