Abstract
Background and aims: We verified whether conditioned media (CM) from pancreatic cancer cell lines (MIAPaCa2, CAPAN-1, PANC-1, BxPC3) alter glucose metabolism and gene expression profiles (microarray experiment with a platform of 5000 skeletal muscle cDNA) in mice myoblasts.
Methods: Myoblasts were incubated with control or pancreatic cancer CM for 24 and 48 hours.
Results: Lactate significantly increased in CM compared with non-conditioned myoblasts. No variations in expression levels of the main genes involved in glycolysis were found in CM myoblasts. Propionyl coenzyme A carboxylase and isocitrate dehydrogenase 3 beta genes, which encode enzymes of the tricarboxylic acid cycle, were overexpressed, while IGFIIR and VAMP5 genes were underexpressed in CM myoblasts. PAFAH1B1 and BCL-2 genes (intracellular signal transduction) and the serine protease cathepsin G (proteolysis), were overexpressed in CM myoblasts. Tyrosine accumulation in CM myoblasts suggested that proteolysis overcomes protein synthesis. Sorcin, actin alpha, troponin T1, and filamin A were underexpressed in CM myoblasts.
Conclusions: Our findings demonstrate that pancreatic cancer cell conditioned media enhanced lactate production and induced proteolysis, possibly by altering expression levels of a large number of genes, not only those involved in protein biosynthesis and degradation or glucose metabolism, but also those involved in the tricarboxylic acid cycle and in vesicle traffic.
Keywords: cachexia, diabetes mellitus, micoarray, myoblasts, pancreatic cancer
A clinical history of recently diagnosed type 2 diabetes is often found in patients with pancreatic adenocarcinoma.1–3 Epidemiological data suggest that type 2 diabetes is either a risk factor for pancreatic adenocarcinoma2,4–6 or a metabolic impairment strictly associated with and consequent to pancreatic adenocarcinoma itself.7,8 Although the two hypotheses are not mutually exclusive, the latter is supported by a body of clinical and experimental data1,3,9–14: sudden onset type 2 diabetes is usually found in patients with pancreatic cancer2,3,7,8 and tumour excision either ameliorates glucose tolerance or leads to complete remission of diabetes.1,9 Furthermore, in vivo and in vitro experimental studies indicate that pancreatic cancer cell products can alter liver and muscle glucose metabolism and can induce peripheral insulin resistance.9–11,14,15
Pancreatic cancer cell conditioned media (CM) reduce liver glycolysis and favour the triglyceride synthesis pathway.14 Pancreatic tumour extracts from type 2 diabetic patients reduce skeletal muscle glycogen storage,9 possibly enhancing glycogen phosphorylase, while reducing glycogen synthase, mRNA, and enzyme activities.15 Pancreatic cancer has also been reported to cause an altered beta cell response to physiological stimuli16 and dissociation between insulin and amylin secretion.12,13,17
It has been suggested that rapidly evolving cachexia, another feature of pancreatic cancer, is caused by tumour cell products, particularly the proteolysis inducing factor, which is released into the bloodstream, targeting muscle cells.18–21
The skeletal muscle mass therefore appears to be significantly involved in patients with pancreatic cancer, being the potential target of various tumour products which can alter glucose metabolism on the one hand and activate protein degradation on the other.
The aims of this study were to verify whether pancreatic cancer cell CM alter glucose metabolism in mice myoblasts and to compare the gene expression profiles of non-conditioned and conditioned myoblasts using a microarray experiment with a platform of 5000 skeletal muscle cDNA.
EXPERIMENTAL PROCEDURES
Cell cultures
We used four human pancreatic cancer cell lines: two (MIA PaCa 2 and CAPAN-1) were obtained from the American Type Culture Collection (ATCC), PANC-1 was a gift from Professor A Scarpa (University of Verona, Italy), and BxPC3 was kindly provided by Dr A Galli (University of Florence, Italy). The colorectal cancer cell line HT29 was obtained by Deutsche Sammlung von Mikroorganismen und Zellkulturen GmbH (DSMZ). The myogenic mice cell line C2C12 was obtained from frozen batches maintained in our laboratories. MIA PaCa 2, PANC-1, and BxPC3 cells were established from human primary pancreatic adenocarcinomas whereas CAPAN-1 cells were established from a liver metastasis from a pancreatic ductal adenocarcinoma. Cells were kept in culture (75 cm2 flasks) at 37°C in a humid atmosphere, with 5% CO2 and 95% air. MIA PaCa 2, BxPC3, HT29, and C2C12 cells were grown in Dulbecco’s modified Eagle’s medium (DMEM, 0.1% gentamycin and 10% fetal calf serum (FCS); reagents from Life Technologies, Paisley, UK). PANC-1 were grown in RPMI (Life Technologies, Paisley, UK) (0.1% gentamycin and 10% FCS) whereas CAPAN-1 cells were grown in RPMI (0.1% gentamycin and 20% FCS). Pancreatic and colorectal cancer cell line CM were obtained as follows: 400 000 cells were plated in 75 cm2 flask and cultured for seven days in low glucose (5.5 mM) DMEM (0.1% gentamycin and 10% FCS). The media were then collected, centrifuged at 1100 g, and stored at 4°C for no more than 24 hours, after which the experiments with myoblasts were performed.
Patient tumour samples
Neoplastic tissue samples were obtained at surgery from six patients (two males, four females; aged 50–75 years) with locally advanced pancreatic adenocarcinoma: three had type 2 diabetes (fasting plasma glucose >126 mg/dl). Samples were stored at −80°C for no more than two months. Each tissue sample was homogenised in phosphate buffered saline (PBS 1:20 w/v) and total protein content was measured (Bradford’s method; BioRad Laboratories GmbH, Munchen, Germany).
Experiments with mice myoblasts
Sixty thousand myoblasts were plated in each well of a 24 culture plate and cultured for 24 hours. The medium was removed; after washing with PBS, myoblasts were incubated in a non-conditioned medium (NCM = DMEM (0.1% gentamycin, and 10% FCS)), in pancreatic or colorectal cancer cell CM, or in NCM with tumour tissue homogenates (TC = tumour conditioned) reaching a final tumour derived protein concentration of 1 mg/ml. Glucose and lactate concentrations of NCM, CM, and TC were measured and corrected before the experiments in order to obtain the same starting values. The experiments were performed at a glucose concentration of 20 mM. Media were collected after 24, 48 and, in some experiments, 72 hours. All the experiments were done at least in triplicate.
Experiments with mice myoblasts and U-13C-glucose
Three separate experiments using mice myoblasts incubated with NCM and pancreatic cancer cell line CM were made using U-13C-glucose (Tracer Technologies INC, Sommerville, Massachusetts, USA) (2% of native 12C-glucose) in order to follow its metabolic fate through 3-13C-lactate enrichment. Supernatants were collected after 24, 48, and 72 hours. Samples were immediately frozen and stored at −20°C until 3-13C-lactate and 5-13C-glucose were analysed.
Experiments with mice myoblasts and fractioned CAPAN-1 conditioned medium
A series of three separate experiments were performed with NCM myoblasts and myoblasts incubated with CAPAN-1 CM and with three fractions of the latter, obtained after ultrafiltration with DIAFLO 10 000 molecular weight (MW) and 30 000 MW (Amicon Millipore Corporation, Bedford, Massachusetts, USA). Fractions were: (1) MW <10 000 Da; (2) MW 10 000–30 000 Da; and (3) MW >30 000 Da.
Biochemical analyses
Total glucose and lactate were measured within three hours from collection by means of a colorimetric method on an automatic analyser (Dimension RxL, Dade Behring, Milan, Italy).
Lactate production, derived from glucose, and glucose utilisation (3-13C-lactate from U-13C-glucose and 5-13C-glucose) were analysed as a N-methyl-N-ter-butyldimethylsilyl-trifluoroacetamide derivative (Pierce, Rockford, Illinois, USA) and as pentacetate derivative (Sigma Chemical, St Louis, Missouri, USA) respectively, using a quadruple gas chromatography-mass spectrometry instrument, operating in EI mode with an Agilent 5973 Network after separation in a DB-17 capillary column (J&W, Folsom, California, USA).22 The ratio between tracer (3-13C-lactate from U-13C-glucose) and tracee (3-12C-lactate from natural 12C-glucose) mass in the samples was evaluated by isotope ratio measurement (m/z 264/261). The ratio between tracer (U-13C-glucose) and tracee (12C-glucose) mass in the samples was evaluated by isotope ratio measurement (m/z 247/242). The fragment that represents glucose labelled species resulted with five 13C atoms (2-3-4-5-6-13C glucose) and is monitored at 247 m/z. The ratio between tracer and tracee mass is evaluated from isotope ratio measurements as:
g × G* / 1 + G* or L = l × L* / 1 + L*
where G* is the tracer glucose concentration from exogenous source, g is the tracee glucose concentration from endogenous source, L* is the tracer lactate from glucose, and l is lactate from endogenous source.
Using a high pressure liquid chromatography procedure, tyrosine concentrations were measured in the supernatants of NCM and pancreatic cancer cell line CM obtained from three separate experiments.
Myoblasts experiments for microarray analysis
Mice C2C12 myoblasts (1.5×10⁶) were plated in Petri dishes (∅ = 10 cm) coated with 1% (w/v) type A gelatin from porcine skin (Sigma, Milano, Italy).
A total of 80 Petri dishes were prepared, and myoblasts were cultured for 24 hours. Myoblasts from 20 Petri dishes were scraped and pooled (basal); media were removed from the remaining 60 Petri dishes, myoblasts were washed with PBS, and then incubated with NCM (20 Petri) or CAPAN-1 CM (40 Petri). After 16 hours of incubation, media were collected from 10 NCM and 20 CAPAN-1 CM while myoblasts were scraped and pooled. For the remaining 30 Petri dishes, this procedure was repeated after 26 hours of incubation. Glucose and lactate in the supernatants were measured. Total RNA from myoblasts was purified following the Trizol standard protocol. A small aliquot of RNA (200 ng) was then used for quantification and quality control, using the RNA 6000 LabChip kit and Agilent Bioanalyzer 2100 (Agilent Technologies, Palo Alto, California, USA). We routinely obtain a mean quantity of 1 μg of total RNA per 105 myoblasts. Total RNA (15 μg) was retrotranscribed and directly labelled in the presence of Cy3 or Cy5 modified dCTP.
Microarray fabrication
The microarrays used for this work (http://muscle.cribi.unipd.it/microarrayindex.html) were constructed by arraying polymerase chain reaction (PCR) amplified c-DNAs obtained from our archive of recombinant bacterial clones, on glass slides. This archive consists of 5000 different clones collected after systematic sequencing of skeletal muscle cDNA libraries containing only the 300–500 bp 3′ portions of muscle transcripts.23
Microarray hybridisation
Microarray hybridisation was carried out in a dual slide chamber (HybChamber; GeneMachines, San Carlos, California, USA), humidified with 160 μl of 3× SSC. Labelled cDNA was dissolved in 35 μl of the hybridisation buffer, denatured at 95°C for three minutes in a thermal cycler, and applied on the microarray slides presaturated by incubation with hybridisation buffer (Northern Max; Ambion, Austin, Texas, USA) for five minutes at 42°C. Microarrays were covered with a 22×50 mm coverslip and hybridised overnight at 42°C by immersion in a high precision water bath (W28; Grant, Cambridge, UK). Post-hybridisation washing was performed by serial incubations in buffers with decreasing SSC and SDS concentrations, at 42°C. Two replicates of each experiment were obtained using different microarray slides in which the sample and reference RNA was labelled either with Cy3 or Cy5; fluorochromes were crossed in both combinations.
Labelled total RNA targets prepared from NCM and CAPAN-1 CM myoblasts, at different time of growth (hours), were used in competitive hybridisations according to the following scheme:
0 hours NCM versus 16 hours CM myoblasts;
0 hours NCM versus 26 hours CM myoblasts;
16 hours NCM versus 16 hours CM myoblasts;
26 hours NCM versus 26 hours CM myoblasts.
Validation of the relative gene expression profiling by reverse transcription (RT)-PCR
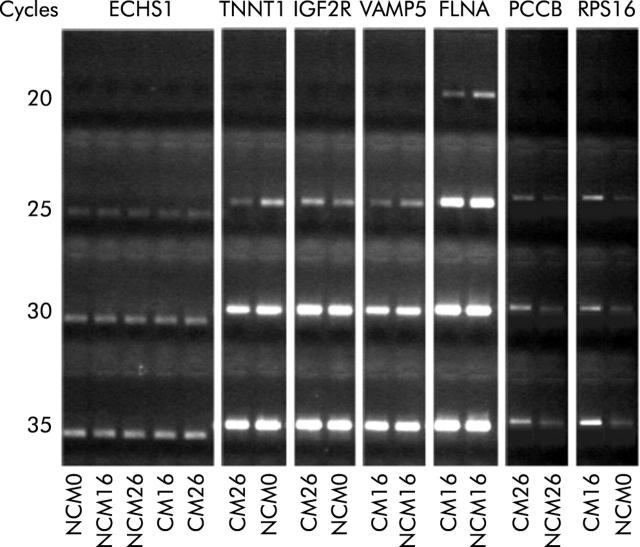
We used quantitative RT-PCR to validate the results obtained from microarray experiments. Total RNA (2 μg aliquots) from each sample was used to perform three independent cDNA synthesis experiments in a final volume of 20 μl using oligo-dT primer and SuperScript reverse transcriptase (Invitrogen, San Giuliano Milanese, Italy). Gene specific primers were designed using Primer 3 software in order to amplify fragments of approximately 500 bp in length, close to the 3′ end of the transcript. cDNA was amplified in 50 μl PCR reactions for a total of 20, 25, 30, and 35 PCR cycles. Each amplicon was electrophoresed on agarose gel and the intensity of the specific bands quantified using a densitometer (GelDoc 2000; BioRad Laboratories, Milano, Italy). Levels of expression were compared with an endogenous control transcript (enoyl CoA hydratase; ECHS1) (fig 1 ▶).
Figure 1.
Quantitative reverse transcription-polymerase chain reaction results. Agarose gel electrophoresis of enoyl coenzyme A hydratase (ECHS1), TNNT1, insulin-like growth factor 2 receptor (IGF2R), vesicle associated membrane protein 5 (VAMP5), filamin A (FLNA), propionyl coenzyme A carboxylase (PCCB), and ribosomal protein S16 (RPS16). The starting templates were myoblasts incubated with non-conditioned medium (NCM) or CAPAN-1 conditioned medium (CM) for 0, 16, and 26 hours.
Statistical analysis
Array scanning was carried out using a GSI Lumonics LITE dual confocal laser scanner with ScanArray Microarray Analysis Software, while raw scanner images were analysed with QuantArray Analysis Software (GSI Lumonics, Ottawa, Canada). Normalisation of expression levels was performed with a SNOMAD gene expression data analysis tool, a collection of algorithms directed at the normalisation and standardisation of DNA microarray data, available at http://pevsnerlab.kennedykrieger.org/snomadnput.html. Before any other statistical analysis, we performed global mean normalisation across microarray surfaces and local mean normalisation across element signal intensity. In single experiments, the mean of the ratio intensity measures of the two replication experiments was calculated and then, after normalisation, log2 transformation was performed for each expression level. In contrast, expression values of the two replicates of each experiment were considered as two separate values, and each was then converted by logarithmic transformation. Principal component analysis was applied using J-express, a Java tool available at www.molmine.com/index_p.html.
Results were statistically evaluated using one way ANOVA and Bonferroni’s test for pairwise comparisons. Repeated measures analysis of variance with interactions was performed using the general linear models procedure. The main effects were time and cell line CM. When the time by cell line interaction was significant (p<0.05), Bonferroni’s t tests of difference between means were performed at the global level of probability of 0.05 (SPSS, version 9.0).
Detection of differentially expressed genes
Trials of hybridisation with the same RNA labelled with Cy3 and Cy5 on a microarray slide were used as internal quality controls for the detection of a consistent threshold level. According to these experiments, we adopted a threshold level for the logarithmic transformation of the ratio intensity values of 2.5. Then, we considered as differentially expressed only those genes whose replicated spots resulted in expression values below −2.5 or above + 2.5, respectively.
RESULTS
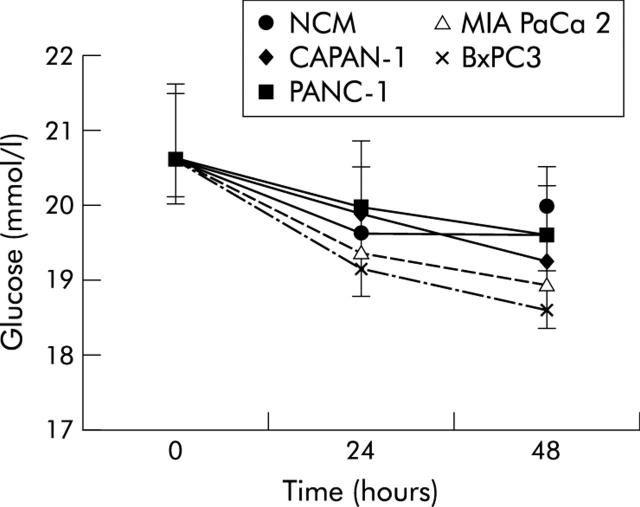
Figure 2 ▶ shows mean (SD) values and statistical analysis (repeated measures ANOVA) of glucose concentrations in NCM and pancreatic cancer CM myoblasts, obtained after 24 and 48 hours of incubation, compared with control myoblasts (time 0). Glucose concentrations declined slightly under all experimental conditions with time and were statistically significant in BxPC3 conditioned versus non-conditioned myoblasts after 48 hours of incubation.
Figure 2.
Mean (SD) values for glucose concentrations in non-conditioned (NCM) and pancreatic cancer cell line conditioned myoblasts, obtained after 24 and 48 hours of incubation. Repeated measures analysis of variance: time effects, p<0.001; cell lines effects, p<0.01; time × cell lines, p<0.01. Bonferroni’s t test: p<0.05 BxPC3 versus NCM.
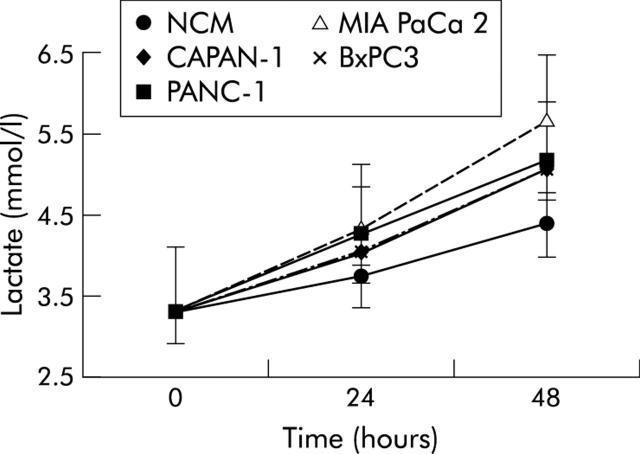
Figure 3 ▶ reports mean (SD) values and findings at statistical analysis (repeated measures ANOVA) for lactate concentrations in NCM and pancreatic cancer CM myoblasts, obtained after 24 and 48 hours of incubation compared with control myoblasts (time 0). Lactate concentration increased in both non-conditioned and pancreatic cancer cell line conditioned myoblasts but the magnitude of this increase was higher in conditioned than in NCM myoblasts (statistically significant in CAPAN-1, PANC-1, and MIA PaCa 2).
Figure 3.
Mean (SD) values for lactate concentrations in non-conditioned (NCM) and pancreatic cancer cell line conditioned myoblasts, obtained after 24 and 48 hours of incubation. Repeated measures analysis of variance: time effects, p<0.001; cell lines effects, p<0.001; time × cell lines, p<0.001. Bonferroni’s t test: p<0.05 CAPAN-1 and PANC-1 versus NCM; p<0.001 MIA PaCa 2 versus NCM.
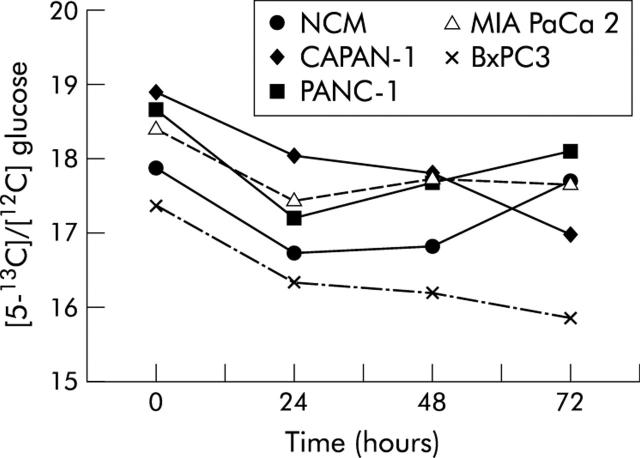
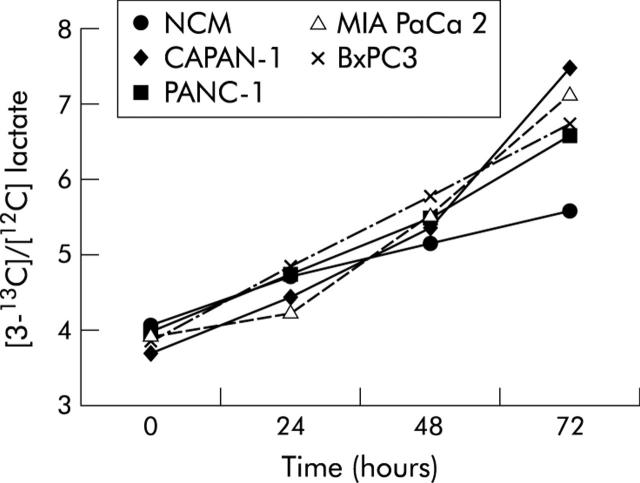
Figures 4 and 5 ▶ ▶ show the pattern of [5-13C]/[12C] glucose (expressed as 247/242 m/z enrichment) and of [3-13C]/[12C] lactate (expressed as 264/261 m/z enrichment) in non-conditioned and pancreatic cancer cell line conditioned myoblasts. The pattern of tracer lactate in conditioned and non-conditioned myoblasts overlapped that of total lactate, indicating that lactate in myoblast supernatants derived from glucose and not from other metabolic substrates.
Figure 4.
Pattern of [5-13C]/[12C] glucose (expressed as 247/242 m/z enrichment) measured from 0 to 72 hours after incubation in non-conditioned (NCM) and pancreatic cancer cell line conditioned myoblasts supernatants. Values are mean. Standard errors were less than 0.5 mmol/l.
Figure 5.
Pattern of [3-13C]/[12C] lactate (expressed as 264/261 m/z enrichment) measured from 0 to 72 hours after incubation in non-conditioned (NCM) and pancreatic cancer cell line conditioned myoblast supernatants. Values are mean. Standard errors were less than 0.5 mmol/l.
Table 1 ▶ shows lactate concentrations found in myoblast supernatants after incubation with NCM or fractioned CAPAN-1 CM. Lactate significantly increased in supernatants of CAPAN-1 conditioned myoblasts after 24 and, at a higher magnitude, after 48 hours of incubation. Overlapping results were obtained in myoblasts incubated with the two fractions of CAPAN-1 CM with a low (<10 000 Da) and high (>30 000 Da) molecular weight, but not with the fraction with a molecular weight of 10 000–30 000 Da, although statistical significance was reached only for the high molecular weight CAPAN-1 fraction.
Table 1.
Mean (SD) values and statistical analysis (repeated measures ANOVA) for lactate concentrations in myoblasts incubated with non-conditioned (NCM) and CAPAN-1 or fractioned CAPAN-1 conditioned media (CM)
| Lactate (mmol/l) | |||
| Basal | 24 hours | 48 hours | |
| NCM | 3.37 (0.2) | 3.56 (0.33) | 4.30 (0.52) |
| CAPAN-1 CM (*) | 3.20 (0.05) | 3.90 (0.12) | 4.96 (0.35) |
| CAPAN-1 CM >30 000 Da (*) | 3.30 (0.09) | 4.01 (0.09) | 4.91 (0.27) |
| CAPAN-1 CM 10–30 000 Da | 3.33 (0.16) | 3.78 (0.25) | 4.41 (0.62) |
| CAPAN-1 CM <10 000 Da | 3.33 (0.19) | 3.84 (0.24) | 4.74 (0.63) |
For each condition, eight experiments were done.
Repeated measures analysis of variance: time effects, p<0.001; cell lines effects, p<0.05; time × cell lines, p<0.05.
Bonferroni’s t test: *p<0.05 versus NCM.
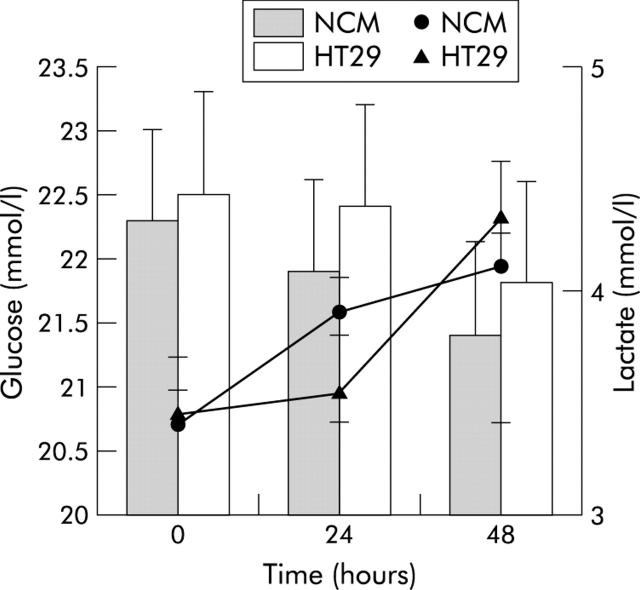
Figure 6 ▶ shows mean (SD) values for glucose and lactate concentrations in non-conditioned and colorectal cancer cell line HT29 conditioned myoblasts after 24 and 48 hours of incubation compared with control myoblasts (time 0). No significant difference was found for either analytes (repeated measures ANOVA: NS).
Figure 6.
Pattern of glucose (histogram) and lactate (lines) concentrations found in myoblast supernatants after incubation with non-conditioned medium (NCM) or the colorectal cancer cell line HT29 conditioned medium. Values are mean (SD).
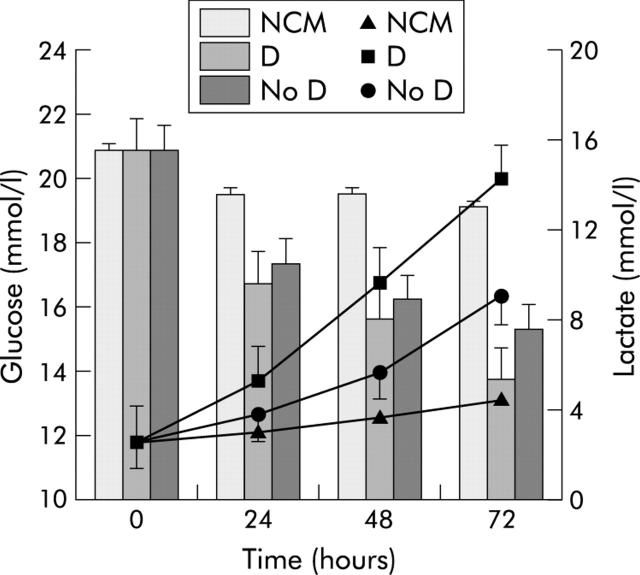
Figure 7 ▶ illustrates the pattern of supernatant glucose and lactate concentrations of myoblasts incubated with NCM or medium conditioned with pancreatic tumour homogenates from patient with or without type 2 diabetes. Pancreatic tumour homogenates in the medium of myoblasts caused a significant decline in glucose levels, independent of the presence of type 2 diabetes; lactate concentrations increased in all conditioned myoblasts but significantly in CM tumours from type 2 diabetic patients.
Figure 7.
Pattern of glucose (histogram) and lactate (lines) concentrations found in myoblast supernatants after incubation with non-conditioned medium (NCM) or with media conditioned with pancreatic cancer tumour homogenates obtained from patients with (D) or without (No D) type 2 diabetes. Values are mean (SD). Repeated measures analysis of variance: time effects, p<0.01 for glucose and p<0.001 for lactate; diabetes effects, p<0.05 for glucose and p<0.001 for lactate; time × diabetes, p<0.01 for glucose and p<0.001 for lactate. Bonferroni’s t test: p<0.05 D and No D versus NCM for glucose; p<0.05 D versus NCM for lactate.
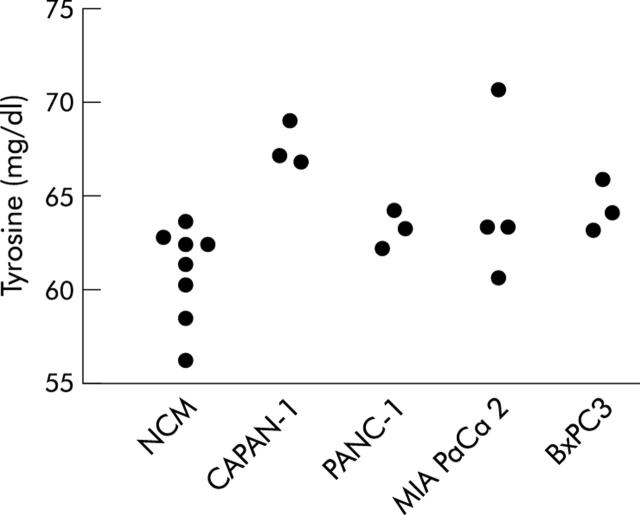
Figure 8 ▶ illustrates the pattern of tyrosine concentrations in non-conditioned and pancreatic cancer cell line conditioned myoblasts after 48 hours of incubation. No significant differences were recorded in tyrosine levels at time 0 (ANOVA one way: F = 0.38, NS) or after 24 hours of incubation (F = 1.09, NS) (data not shown).
Figure 8.
Tyrosine levels measured in supernatants of myoblasts after 48 hours of incubation with non-conditioned medium (NCM) or pancreatic cancer cell line conditioned media. ANOVA one way: F = 4.23, p<0.05. Bonferroni’s test for pairwise comparisons: p<0.05 CAPAN-1 versus NCM.
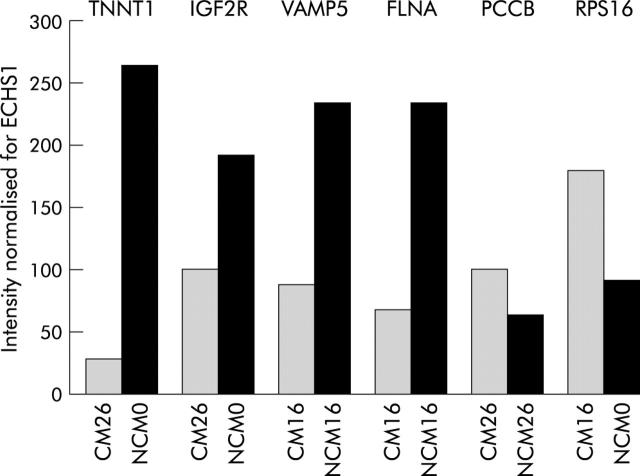
To validate our 3′-cDNA array platform, quantitative RT-PCR was undertaken to quantify the level of expression of some muscle transcripts. To this aim, we selected a set of six genes, four of which were underexpressed (TNNT1, IGF2R, VAMP5, FLNA) while two were overexpressed (PCCB and RPS16) in CAPAN-1 conditioned compared with non-conditioned myoblasts, from microarray experiments. The housekeeping gene ECHS1 was used as an internal control. We found a correlation between the results of the array analysis and that of RT-PC (fig 9 ▶).
Figure 9.
Reverse transcription-polymerase chain reaction results. The housekeeping gene ECHS1 was used as an internal control. Conditioned media (CM) downregulated genes from microarray experiments: TNNT1, IGF2R, VAMP 5, and FLNA. CM overexpressed genes from microarray experiments: PCCB and RPS16. NCM, non-conditioned medium; ECHS1, enoyl coenzyme A hydratase; IGF2R, insulin-like growth factor 2 receptor; VAMP5, vesicle associated membrane protein 5; FLNA, filamin A; PCCB, propionyl coenzyme A carboxylase; RPS16, ribosomal protein S16.
Expression levels of several enzymes involved in glycolysis were not altered in CAPAN-1 conditioned compared with non-conditioned myoblasts (hexokinase 1 (HK1), glycogen synthase kinase 3 alpha (GSK3A), glycogen phosphorylase, pyruvate kinase (PKM2), enolase 3 (ENO3), aldolase A (ALDOA), GAPDH, phosphofructokinase (PFKM), pyruvate dehydrogenase, isocitrate dehydrogenase 2 (IDH2), glycogenin (GYG), isocitrate dehydrogenase 3 gamma (IDH3G), succinyl CoA synthetase, succinate dehydrogenase, malate dehydrogenase 1 (MDH1), and phosphoglycerate mutase 2).
Table 2 ▶ reports overexpressed and table 3 ▶ underexpressed genes in CAPAN-1 conditioned versus non-conditioned myoblasts. Only genes with a known biological function are reported. Expression levels at 16 or 26 hours in comparison with baseline control myoblasts gave the following results: eight genes were overexpressed, nine genes were underexpressed. Expression levels found in 16 or 26 hour conditioned myoblasts versus those of 16 and 26 hour control myoblasts were as follows: a total of 14 genes were overexpressed and nine were underexpressed in conditioned myoblasts .
Table 2.
Overexpressed genes with known biological functions in CAPAN-1 conditioned compared with non-conditioned myoblasts
| Muscle cDNA archive ID | Gene names | Biological process | Expression ratio | |
| Overexpressed after 16 h with respect to NCM at time 0 | 2-001A01 | Ribosomal protein S16 (RPS16) | Protein biosynthesis | 3.72 |
| 2-007E12 | Fibrillarin (FBL) | rRNA processing | 2.69 | |
| 2-009C09 | APOBEC2 | rRNA processing | 2.50 | |
| 2-026B06 | BCL-2 associated athanogene | Antiapoptosis, cell surface receptor linked signal transduction | 2.57 | |
| 2-031A06 | Transcriptional coactivator (ALY) | Protein complex assembly | 2.42 | |
| 2-039D12 | Peroxisome receptor 1 (PXR1) | Protein-peroxisome targeting | 2.41 | |
| Overexpressed after 26 h with respect to NCM at time 0 | 2-009A02 | PAFAH1B1 | Neurogenesis, cell motility, lipid metabolism, signal transduction | 3.34 |
| BL-001H08 | Cathepsin G (CTSG) | Immune response, proteolysis | 5.46 | |
| Overexpressed after 16 h with respect to NCM after 16 h | 2-001A07 | Alpha one globin (HBA1) | Oxygen transport | 2.84 |
| 2-005G10 | Isocitrate dehydrogenase 3 beta (IDH3B) | Isocitrate metabolism, carbohydrate metabolism | 2.95 | |
| 2-015D05 | Ribosomal protein L22 (RPL22) | Protein biosynthesis | 3.06 | |
| 2-022G02 | ARP1 actin-related protein 1 homolog A (ACTR1A) | Vesicle transport | 2.55 | |
| 2-034C09 | U4/U6 associated RNA splicing factor (HPRP3P) | mRNA splicing, mRNA processing | 3.04 | |
| BL-009A02 | Torsin A (DYT1) | Protein folding, heat shock response | 2.95 | |
| BL-010F10 | NFKB2 | Oncogenesis | 3.37 | |
| Overexpressed after 26 h with respect to NCM after 26 h | 2-010C12 | S100 Calcium binding protein A6 (S100A6) | Cell cycle, cell-cell signalling | 2.50 |
| 2-018A07 | ATP synthase (ATP5B) | Energy pathways | 2.47 | |
| 2-018C04 | Bridging-integrator protein-1 isoform BIN1+12A (BIN1) | Cell cycle control, cell proliferation, non-selective vesicle transport | 3.47 | |
| 2-018C10 | Ribosomal protein S3A (RPS3A) | Protein biosynthesis | 2.63 | |
| 2-021E09 | Ribosomal protein S21 (RPS21) | Protein biosynthesis | 3.42 | |
| 2-028D10 | Propionyl coenzyme A carboxylase | Fatty acid catabolism | 2.61 | |
| BL-003G08 | MEM-102 glycoprotein | Defence response | 3.71 |
The table lists the transcripts that were found to be upregulated in myoblasts after 16 or 26 hours of incubation with CAPAN-1 conditioned medium in comparison with myoblasts incubated with control medium (NCM).
Table 3.
Underexpressed genes with known biological functions in CAPAN-1 conditioned compared with non-conditioned myoblasts
| Muscle cDNA archive ID | Gene name | Biological process | Expression ratio | |
| Underexpressed both after 16 and 26 h with respect to NCM at time 0 | 2-001H02 | Ribosomal protein S12 (RPS12 | Protein biosynthesis | −2.96/−3.93 |
| Underexpressed after 16 h with respect to NCM at time 0 | 2-028H06 | Actin alpha | Control of heart, muscle contraction | −2.75 |
| 2-029C09 | Sorcin (SR1) | Control of heart and muscle development, small molecule transport, intracellular iron storage, action potential regulation, striated muscle contraction regulation | −2.67 | |
| Underexpressed after 26 h with respect to NCM at time 0 | 2-002H11 | Thymosin beta 10 (TMSB10) | Spermatid development | −2.88 |
| 2-023F10 | Troponin T1 | Muscle contraction regulation | −4.33 | |
| 2-027F02 | IGF2R | Signal transduction, receptor mediated endocytosis | −5.44 | |
| 2-029D01 | Ribosomal protein L14 (RPL14) | Protein biosynthesis | −2.56 | |
| BL-010C12 | PET112L | Protein biosynthesis | −2.73 | |
| BL-010F12 | Ribosomal protein L8 (RPL8) | Protein biosynthesis | −3.18 | |
| Underexpressed after 16 h with respect to NCM after 16 h | 2-010G10 | VAMP5 | Muscle development, non-selective vesicle transport | −2.53 |
| 2-017G02 | Low density lipoprotein related protein 1 (LRP1) | Pathogenesis, lipid metabolism, cell proliferation | −2.67 | |
| 2-018F04 | Endothelial differentiation related factor 1 (EDF1) | Developmental processes, cell growth and maintenance | −2.85 | |
| 2-036G04 | Filamin A, alpha (actin binding protein 280) (FLNA) | Neurogenesis, cell motility, cell shape and cell size control, actin cytoskeleton reorganisation, cell surface receptor linked signal transduction | −3.26 | |
| Underexpressed after 26 h with respect to NCM after 26 h | 2-005F09 | NADUFS2 | Complex I (NADH to ubiquinone) | −2.66 |
| BL-003C11 | Dual specificity phosphatase 1 (DUSP1) | Oxidative stress response | −4.01 |
The table lists the transcripts that were found to be downregulated in myoblasts after 16 or 26 hours of incubation with CAPAN-1 conditioned medium in comparison with myoblasts incubated with control medium (NCM).
DISCUSSION
It has been suggested that skeletal muscle mass is targeted by tumour derived substances. These can induce glucose intolerance and atrophy, which is responsible, in part, for the marked cachexia and diabetes frequently encountered in pancreatic cancer patients.9,15,18–21 We verified the effects of pancreatic cancer cell conditioned media on glucose metabolism of cultured mice myoblasts and, using a microarray experiment with a platform of 5000 skeletal muscle cDNA, on myoblast gene expression.
Supernatant glucose concentrations slightly declined in conditioned compared with non-conditioned myoblasts, indicating that glucose consumption is higher in conditioned than in non-conditioned myoblasts. The experiments with pancreatic tumour homogenates confirmed and supported this observation. In common with Li and Adrian,24 we found that conditioned myoblasts released higher amounts of lactate in cell culture medium than non-conditioned myoblasts. A very significant increase in lactate production was obtained from myoblasts conditioned with tumour homogenates from diabetic patients, supporting the hypothesis that pancreatic cancer clinically associated with diabetes can cause an increase in lactate production by myoblasts. This finding seems to be peculiar to pancreatic cancer as no effect on glucose or lactate concentrations was found in myoblasts conditioned with a colorectal cancer cell line (HT29).
To confirm that lactate was derived from glucose and not from other metabolic substrates (for example, amino acids), we performed a series of experiments with stable labelled glucose. All lactate derived from glucose, indicating that most of the glucose taken up into the cell was metabolised to lactate rather than undergoing oxidative phosphorylation or being used for glycogen synthesis. The altered glucose metabolism in myoblasts was different from that previously described by us in conditioned hepatocytes where a reduction in lactate production was found.14 Tumour products may evoke different metabolic alterations strictly linked to the metabolic pattern of the target cell.25,26
The effect on myoblasts was reproduced not only with the low molecular weight fraction of pancreatic cancer cell conditioned media (<10 000 Da)26 but also with the fraction with a high molecular weight (>30 000 Da). Two hypotheses may be proposed: (1) in the low molecular weight fraction a “metabolically active” fragment from a larger molecule may be present; and (2) two different molecules may cooperate in modifying myoblast glucose metabolism.
To screen for which muscle genes expression was altered in conditioned myoblasts, we performed an experiment using microarray with a platform of 5000 skeletal muscle cDNA, which was validated by quantitative RT-PCR. In agreement with our hypothesis that glycolysis is not impaired in conditioned myoblasts, expression levels of many genes involved in this metabolic pathway did not vary. In contrast, we found a large number of over- and underexpressed genes in conditioned versus non-conditioned myoblasts (tables 2 ▶, 3 ▶). Some of these genes are potentially involved in modifying glucose metabolism: PCCB and isocitrate dehydrogenase 3 beta (IDH3B) genes, which encode enzymes of the tricarboxylic acid cycle, were overexpressed, and IGFIIR and VAMP5 were underexpressed. Propionyl coenzyme A is derived from oxidation of some amino acids (methionine, isoleucine, and valine) and of unpaired fatty acids27 and it is converted into succinyl coenzyme A by PCCB. IDH3B catalyses the oxidative decarboxylation of isocitrate to succinyl coenzyme A via the intermediate alpha-chetoglutarate. We suggest that the mitochondrial tricarboxylic acid cycle could be accelerated, independent of glycolysis, and the production of succinyl coenzyme A enhanced in conditioned versus non-conditioned myoblasts. An accelerated mitochondrial tricarboxylic acid cycle is associated with reduced muscle glycogen synthesis,28 an event already described in diabetic pancreatic cancer patients9,15 and it might cause accumulation of ATP and NADH, which are known inhibitors of pyruvate dehydrogenase.27 This event may explain the accumulation of lactate observed in our experimental model.
The biological function of the other genes whose expression was altered was not directly or indirectly correlated with lactate production, although some may be associated with insulin secretion and glucose transport. In this context, IGFIIR and VAMP5 downregulation in conditioned myoblasts is of particular interest as IGFIIR binds IGFII and, with less affinity, also insulin and IGFI.29 Although the effects of IGFIIR downregulation in muscle tissue are not yet known, it has been reported that glucose increases IGFIIR at the cell surface which promotes insulin exocytosis in insulin secreting cells.30,31 Alterations in gene expression observed by us may also occur in other target cells: insulin secreting cells, where decreased IGFIIR may reduce insulin secretion, as already been observed in patients with pancreatic cancer.16 VAMP5, which belongs to the family of SNARE proteins, may facilitates GLUT4 translocation from the intracellular pool to the plasma membrane.32 In this context, downregulation of VAMP5 might determine reduced GLUT4 membranal expression, followed by reduced glucose transport.
Overexpression, observed by us, of some genes involved in intracellular signal transduction, including PAFAH1B1 and BCL-2, modifying expression of several ribosomal proteins, may lead to alteration in protein biosynthesis.33–36 As we found overexpression in the serine protease, cathepsin G, which is involved in connective tissue degradation and caspase activation,37 we examined protein catabolism by measuring tyrosine in supernatants as tyrosine rapidly equilibrates between intracellular pools and the medium and is neither synthesised nor degraded.38 In our experimental model, tyrosine increased in conditioned myoblasts, indicating that proteolysis overcomes protein synthesis, and this may lead to muscle atrophy. Downregulation of sorcin, actin alpha, troponin T1, and filamin A may contribute towards this atrophy.39,40
In conclusion, our findings demonstrate that pancreatic cancer cell conditioned media enhanced lactate production and induced proteolysis, possibly by altering expression levels of a large number of genes—not only those involved in protein biosynthesis and degradation or glucose metabolism but also those involved in the tricarboxylic acid cycle and in vesicle traffic.
Acknowledgments
This study was supported by Ministero Università e Ricerca (Cofin 2001068593), Rome, Italy. The instrumentation for microarray construction and analysis used for this study were purchased thanks to a generous donation from the Fondazione della Cassa di Risparmio di Padova e Rovigo, Padova, Italy, to the CRIBI Biotechnology Centre. Caterina Millino, Chiara Romualdi, and Milena Bellin are research fellows sponsored by the Fondazione Telethon ONLUS, Italy (grant B.57 to GL).
Abbreviations
CM, conditioned media
DMEM, Dulbecco’s modified Eagle’s medium
FCS, fetal calf serum
PBS, phosphate buffered saline
NCM, non-conditioned medium
TC, tumour conditioned
MW, molecular weight
RT-PCR, reverse transcription-polymerase chain reaction
ECHS1, enoyl coenzyme A hydratase
IGF2R, insulin-like growth factor 2 receptor
VAMP5, vesicle associated membrane protein 5
FLNA, filamin A
PCCB, propionyl coenzyme A carboxylase
RPS16, ribosomal protein S16
REFERENCES
- 1.Fogar P , Pasquali C, Basso D, et al. Diabetes mellitus in pancreatic cancer follow-up. Anticancer Res 1994;14:2827–30. [PubMed] [Google Scholar]
- 2.Czyzyk A , Szczepanik Z. Diabetes mellitus and cancer. Eur J Int Med 2000;11:245–52. [DOI] [PubMed] [Google Scholar]
- 3.Gullo L , Tomassetti P, Migliori M, et al. Do early symptoms of pancreatic cancer exist that can allow an earlier diagnosis? Pancreas 2001;22:210–13. [DOI] [PubMed] [Google Scholar]
- 4.Silverman DT, Schiffman M, Everhart J, et al. Diabetes mellitus, other medical conditions and familial history of cancer as risk factors for pancreatic cancer. Br J Cancer 1999;80:1830–7. [DOI] [PMC free article] [PubMed] [Google Scholar]
- 5.Silverman DT. Risk factors for pancreatic cancer: a case-control study based on direct interviews. Terat Carcinogen Mutagen 2001;21:7–25. [DOI] [PubMed] [Google Scholar]
- 6.Lin Y , Tamakoshi A, Kawamura T, et al. Risk of pancreatic cancer in relation to alcohol drinking, coffee consumption and medical history: findings from the Japan collaborative cohort study for evaluation of cancer risk. Int J Cancer 2002;99:742–6. [DOI] [PubMed] [Google Scholar]
- 7.Gullo L , Pezzilli R, Morselli-Labate AM, and the Italian Pancreatic Cancer Study Group. Diabetes and the risk of pancreatic cancer. N Engl J Med 1994;331:81–4. [DOI] [PubMed] [Google Scholar]
- 8.La Vecchia C , Negri E, Franceschi S, et al. A case-control study of diabetes mellitus and cancer risk. Br J Cancer 1994;70:950–3. [DOI] [PMC free article] [PubMed] [Google Scholar]
- 9.Permert J , Adrian TE, Jacobsson P, et al. Is profound peripheral insulin resistance in patients with pancreatic cancer caused by a tumor-associated factor? Am J Surg 1993;165:61–7. [DOI] [PubMed] [Google Scholar]
- 10.Basso D , Brigato L, Veronesi A, et al. The pancreatic cancer cell line MIA PaCa 2 produces one or more factors able to induce hyperglycemia in SCID mice. Anticancer Res 1995;15:2585–8. [PubMed] [Google Scholar]
- 11.Basso D , Valerio A, Brigato L, et al. An unidentified pancreatic cancer cell product alters some intracellular pathways of glucose metabolism in isolated rat hepatocytes. Pancreas 1997;15:132–8. [DOI] [PubMed] [Google Scholar]
- 12.Wang F , Larsson J, Abdiu A, et al. Dissociated secretion of islet amyloid polypeptide and insulin in serum-free culture media conditioned by human pancreatic adenocarcinoma cell lines. Int J Pancreatol 1997;21:157–64. [DOI] [PubMed] [Google Scholar]
- 13.Ding X , Flatt PR, Permert J, et al. Pancreatic cancer cells selectively stimulate islet b cells to secrete amylin. Gastroenterology 1998;114:130–8. [DOI] [PubMed] [Google Scholar]
- 14.Valerio A , Basso D, Brigato L, et al. Glucose metabolic alterations in isolated and perfused rat hepatocytes induced by pancreatic cancer conditioned medium: a low molecular weight factor possibly involved. Biochem Biophys Res Commun 1999;257:622–8. [DOI] [PubMed] [Google Scholar]
- 15.Liu J , Knezetic JA, Strömmer L, et al. The intracellular mechanism of insulin resistance in pancreatic cancer patients. J Clin Endocrinol Metab 2000;85:1232–8. [DOI] [PubMed] [Google Scholar]
- 16.Basso D , Plebani M, Fogar P, et al. β-cell function in pancreatic adenocarcinoma. Pancreas 1994;9:332–5. [DOI] [PubMed] [Google Scholar]
- 17.Mäkimattila S , Hietaniemi K, Kiviluoto T, et al. In vivo glucose-stimulated amylin secretion is increased in nondiabetic patients with pancreatic cancer. Metabolism 2001;50:1036–42. [DOI] [PubMed] [Google Scholar]
- 18.Todorov P , Cariuk P, McDevitt T, et al. Characterization of a cancer cachectic factor. Nature 1996;379:739–42. [DOI] [PubMed] [Google Scholar]
- 19.Wigmore SJ, Todorov PT, Barber MD, et al. Characteristics of patients with pancreatic cancer expressing a novel cancer cachectic factor. Br J Surg 2000;87:53–8. [DOI] [PubMed] [Google Scholar]
- 20.Brown DR, Berkowitz DE, Breslow MJ. Weight loss is not associated with hyperleptinemia in humans with pancreatic cancer. J Clin Endocrinol Metab 2001;86:162–6. [DOI] [PubMed] [Google Scholar]
- 21.Tisdale MJ. Cachexia in cancer patients. Nat Rev Cancer 2002;2:862–71. [DOI] [PubMed] [Google Scholar]
- 22.Avogaro A , Toffolo G, Valerio A, et al. Epinephrine exerts opposite effects on peripheral glucose disposal and glucose-stimulated insulin secretion. A stable label intravenous glucose tolerance test minimal model study. Diabetes 1996;45:998–1007. [DOI] [PubMed] [Google Scholar]
- 23.Campanaro S , Romualdi C, Fanin M, et al. Gene expression profiling in dysferlinopathies using a dedicated muscle microarray. Hum Mol Gen 2002;11:3283–98. [DOI] [PubMed] [Google Scholar]
- 24.Li J , Adrian TE. A factor from pancreatic and colonic cancer cells stimulates glucose uptake and lactate production in myoblasts. Biochem Biophys Res Commun 1999;260:626–33. [DOI] [PubMed] [Google Scholar]
- 25.Valerio A , Basso D, Mazza S, et al. Serum protein profiles of patients with pancreatic cancer and chronic pancreatitis: searching for a diagnostic protein pattern. Rapid Commun Mass Spectrom 2001;15:2420–5. [DOI] [PubMed] [Google Scholar]
- 26.Basso D , Valerio A, Seraglia R, et al. Putative pancreatic cancer-associated diabetogenic factor: 2030 MW peptide. Pancreas 2002;24:8–14. [DOI] [PubMed] [Google Scholar]
- 27.Stryer L .Biochemistry, 3rd edn. New York: WH Freeman & Company 1988.
- 28.Dicter N , Madar Z, Tirosh O. a-Lipoic acid inhibits glycogen synthesis in rat soleus muscle via its oxidative activity and the uncoupling of mitochondria. J Nutr 2002;132:3001–6. [DOI] [PubMed] [Google Scholar]
- 29.Fürstenberger G , Senn H-J. Insulin-like growth factors and cancer. Lancet Oncol 2002;3:298–302. [DOI] [PubMed] [Google Scholar]
- 30.Zhang Q , Berggren P-O, Tally M. Glucose increases both the plasma membrane number and phosphorylation of insulin-like growth factor II/mannose 6-phosphate receptors. J Biol Chem 1997;272:23703–6. [DOI] [PubMed] [Google Scholar]
- 31.Zhang Q , Tally M, Larsson O, et al. Insulin-like growth factor II signaling through the insulin-like growth factor II/mannose-6-phosphate receptor promotes exocytosis in insulin-secreting cells. Proc Natl Acad Sci USA 1997;94:6232–7. [DOI] [PMC free article] [PubMed] [Google Scholar]
- 32.Kido Y , Nakae J, Accili D. The insulin receptor and its cellular targets. J Clin Endocrinol Metab 2001;86:972–9. [DOI] [PubMed] [Google Scholar]
- 33.Arai H , Koizumi H, Aoki J, et al. Platelet-activating factor acetylhydrolase (PAF-AH). J Biochem 2002;131:635–40. [DOI] [PubMed] [Google Scholar]
- 34.Jansen B , Zangemeister-Wittke U. Antisense therapy for cancer—the time of truth. Lancet Oncol 2002;3:672–83. [DOI] [PubMed] [Google Scholar]
- 35.Ban N , Nissen P, Hansen J, et al. Placement of protein and RNA structures into a 5 A-resolution map of the 50S ribosomal subunit. Nature 1999;400:841–7. [DOI] [PubMed] [Google Scholar]
- 36.Kumar KU, Srivastava SP, Kaufman RJ. Double-stranded RNA-activated protein kinase (PKR) is negatively regulated by 60S ribosomal subunit protein L18. Mol Cell Biol 1999;19:1116–25. [DOI] [PMC free article] [PubMed] [Google Scholar]
- 37.Bird PI. Regulation of pro-apoptotic leucocyte granule serine proteinases by intracellular serpins. Immun Cell Biol 1999;77:47–57. [DOI] [PubMed] [Google Scholar]
- 38.Todorov PT, Deacon M, Tisdale MJ. Structural analysis of a tumor-produced sulphated glycoprotein capable of initiating muscle protein degradation. J Biol Chem 1997;272:12279–88. [DOI] [PubMed] [Google Scholar]
- 39.Berchtold MW, Brinkmeier H, Müntener M. Calcium ion in skeletal muscle: its crucial role for muscle function, plasticity, and disease. Physiol Rev 2000;80:1215–65. [DOI] [PubMed] [Google Scholar]
- 40.Maki M , Kitaura Y, Satoh H, et al. Structures, functions and molecular evolution of the penta-EF-hand Ca2+-binding proteins. Biochem Biophys Acta 2002;1600:51–60. [DOI] [PubMed] [Google Scholar]


