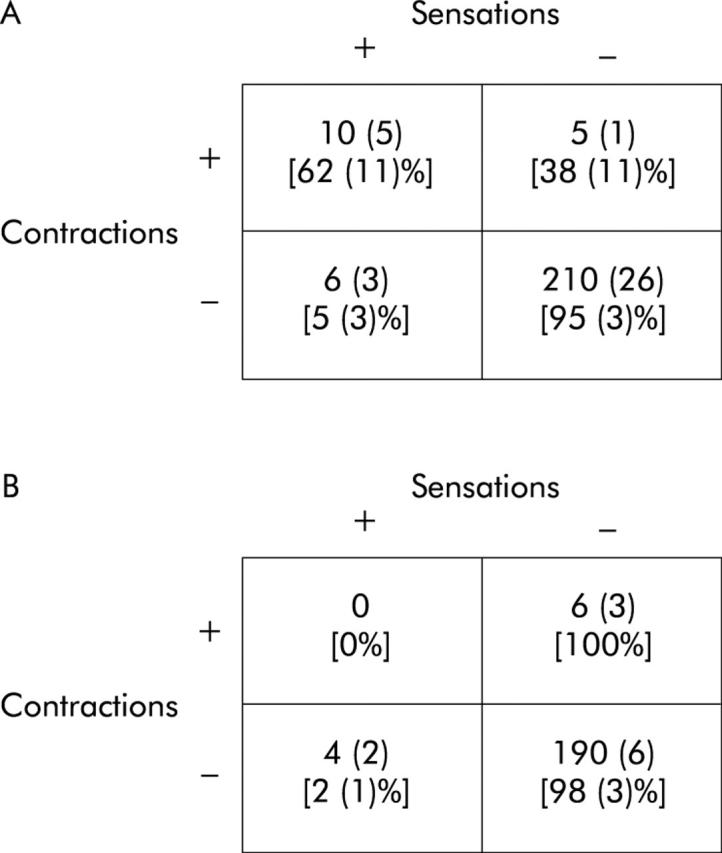
Figure 3.

(A) Contingency table reporting the mean (SEM) number of intervals with the four combinations of events in subjects with a significant association between contractions and sensation (n = 7). Numbers in parentheses are line percentages. (B) Contingency table reporting the mean (SEM) number of intervals with the four combinations of events in subjects without a significant association between contractions and sensation (n = 3). Numbers in parentheses are line percentages.
