

Abstract
Background: Hepatic stellate cells (HSCs) are a major fibrogenic cell type that contributes to collagen accumulation during chronic liver disease. With increasing interest in developing antifibrotic therapies, there is a need for cell lines that preserve the in vivo phenotype of human HSCs to elucidate pathways of human hepatic fibrosis. We established and characterised two human HSC cell lines termed LX-1 and LX-2, and compared their features with those of primary human stellate cells.
Methods and results: LX-1 and LX-2 were generated by either SV40 T antigen immortalisation (LX-1) or spontaneous immortalisation in low serum conditions (LX-2). Both lines express α smooth muscle actin, vimentin, and glial fibrillary acid protein, as visualised by immunocytochemistry. Similar to primary HSCs, both lines express key receptors regulating hepatic fibrosis, including platelet derived growth factor receptor β (βPDGF-R), obese receptor long form (Ob-RL), and discoidin domain receptor 2 (DDR2), and also proteins involved in matrix remodelling; matrix metalloproteinase (MMP)-2, tissue inhibitor of matrix metalloproteinase (TIMP)-2, and MT1-MMP, as determined by western analyses. LX-2 have reduced expression of TIMP-1. LX-2, but not LX-1, proliferate in response to PDGF. Both lines express mRNAs for α1(I) procollagen and HSP47. Transforming growth factor β1 stimulation increased their α1(I) procollagen mRNA expression, as determined by quantitative reverse transcription-polymerase chain reaction. LX-2, but not LX-1, cells are highly transfectable. Both lines had a retinoid phenotype typical of stellate cells. Microarray analyses showed strong similarity in gene expression between primary HSCs and either LX-1 (98.4%) or LX-2 (98.7%), with expression of multiple neuronal genes.
Conclusions: LX-1 and LX-2 human HSC lines provide valuable new tools in the study of liver disease. Both lines retain key features of HSCs. Two unique advantages of LX-2 are their viability in serum free media and high transfectability.
Keywords: fibrosis, wound healing, liver, myofibroblast, stellate cells
Hepatic stellate cells (HSCs) (previously known as Ito cells, lipocytes, or fat storing cells) are a major cell type responsible for liver fibrosis following their activation into fibrogenic myofibroblast-like cells.1–3 With accumulating insights into stellate cell biology, there is an increasing need for renewable cell culture models that faithfully recapitulate their in vivo phenotype. Indeed, much of our current knowledge of stellate cell behaviour has been gained through animal models and primary culture studies, particularly from the rat. When cultured on uncoated plastic, stellate cells undergo spontaneous activation that correlates closely with their response in vivo.4 However, it is essential to validate mechanisms elucidated from rodent models in human stellate cells in order to establish their relevance to human disease.
An important limitation of using human stellate cells has been the infrequent and unpredictable availability of human tissue suitable for cell isolation, as well as the modest yield and frequent impurities that characterise these isolates. One approach to overcome these difficulties has been to passage fibroblast-like outgrowths from whole tissue sections, which usually represent a heterogenous mixture of activated HSCs with other hepatic cell types, including large vessel endothelial cells and vascular smooth muscle cells. In addition to their heterogeneity, the utility of explant outgrowths has been limited by the finite number of passages the cells undergo unless immortalised.5 Moreover, isolates from human liver vary from prep to prep, making it difficult to directly compare findings.
To overcome these issues of species specificity and culture variability, and to provide a stable and unlimited source of human HSCs that are homogenous, we have established two new immortalised HSC cell lines, LX-1 and LX-2. These cell lines have been extensively characterised and retain key features of cytokine signalling, neuronal gene expression, retinoid metabolism, and fibrogenesis, making them highly suitable for culture based studies of human hepatic fibrosis.
METHODS
Materials
Pronase was obtained from Roche Molecular Biochemicals (Indianapolis, Indiana, USA). Medium 199 (M 199), bovine serum albumin (BSA), and collagenase type IV were obtained from Sigma-Aldrich Co. (St Louis, Missouri, USA). Dulbecco’s modified Eagle’s medium (DMEM), Ham’s F-12 medium, Nycodenz, and Trizol reagent were from Gibco BRL (Grand Island, New York, USA). Penicillin-streptomycin, fetal bovine serum, trypsin-EDTA, and l-glutamine were purchased from Fisher (Springfield, New Jersey, USA). Transforming growth factor β1 (TGF-β1) was from R&D Systems Inc. (Minneapolis, Minnesota, USA).
For immunocytochemistry, monoclonal antibodies for α smooth muscle actin (α-SMA), CD68, and factor VIII related antigen were from Dako Corporation (Carpinteria, California, USA). Monoclonal antibody for Simian Virus 40 large T antigen (SV40 T-antigen, mAb) was from Santa Cruz Biotechnology (Santa Cruz, California, USA). Antivimentin and antiglial fibrillary acid protein (GFAP) monoclonal antibodies were from NeoMarkers (Fremont, California, USA). Antirabbit IgG fluorescein and antimouse IgG (H+L) Texas Red were purchased from Vector Laboratories Inc. (Burligame, California, USA). DAPI was obtained from Molecular Probes (Eugene, Oregon, USA).
For western analysis, antibody for discoidin domain receptor 2 (DDR2; R2-JM) was described previously.6 The obese receptor long form (Ob-RL) antibody (H300) was obtained from Santa Cruz Biotechnology, matrix metalloproteinase (MMP)-2 antibody was from Sigma-Aldrich, and MT1-MMP, tissue inhibitor of matrix metalloproteinase (TIMP)-1, and TIMP-2 were obtained from Chemicon (Temecula, California, USA). A monoclonal antibody for the platelet derived growth factor receptor β (βPDGF-R) was from Transduction Laboratories (Newington, New Hampshire, USA).
HSC isolation and culture
HSCs were isolated as previously described.7 Isolated HSCs were cultured in M199 containing 10% fetal bovine serum (FBS) 24 hours later and every 3–4 days thereafter. When the cultures reached confluence, they were trypsinised (0.05% trypsin/0.53 mM EDTA) and passaged at a ratio of 1:3. Subsequent passages were performed every 7–10 days.
Transfection and immortalisation
HSCs subcultured to passage 3 were trypsinised and plated at a density of approximately 40% confluence in a 10 cm dish. The following day, the passage 4 cells were transfected with the plasmid pRSVTag that encodes the SV40 large T antigen under the control of a rous sarcoma virus (RSV) promoter. Plasmid DNA (10 μg) was mixed with 30 μl of Fugene (Roche) in 1 ml of serum free media for 15 minutes and then added to the HSC culture that was maintained in 4 ml of fresh M199 media containing 10% FBS. The transfection media were removed 24 hours later and replaced with M199 media containing 10% FBS after the cultures were washed three times with phosphate buffered saline (PBS) to remove any residual Fugene reagent. The culture was subsequently passaged seven times at which point the cells appeared morphologically distinct from normal passaged cells and were also more proliferative. The LX-1 cell line was established from an individual clone from the primary T antigen immortalised cultures. The LX-2 cell line was established by selecting for a subline of the LX-1 cells that was able to grow under reduced serum conditions (1% FBS). A single clone from the outgrowth was expanded and designated LX-2. The LX-2 cell line was cultured in DMEM with only 2% FBS. The LX-1 cell line was cultured in DMEM with 10% FBS.
To determine the transfection efficiency of LX-2 cells, 2.5 μg of a plasmid expressing enhanced green fluorescent protein pEGFP-C2 (Clontech, Palo Alto, California, USA) was mixed with 7.5 μl of Fugene in 0.25 ml serum free media for 15 minutes. This mixture was added to LX-2 cells cultured on six well dishes with 2 ml DMEM containing 2% FBS. Cells were visualised with an inverted microscope for bright field and green fluorescence images
Immunocytochemistry
Cells were plated on glass coverslips (Fisher Scientific) in 12 well culture dishes and grown to approximately 50% confluence for three days to promote the adherence of cells. Cells were then washed twice with cold serum free media (DMEM) and then fixed in 4% paraformaldehyde in PBS for 10 minutes. After fixation, cells were washed twice with PBS and then permeabilised with PBS containing 0.1% Triton X-100 for 15 minutes. They were next washed twice with PBS and incubated with blocking solution (5% BSA in PBS) for 30 minutes. Primary antibodies (diluted 1:100 in blocking solution) were incubated with the cells for one hour. After three washes with PBST (0.2% Tween 20 in PBS), cells were incubated with fluorescein labelled antimouse IgG (Vector Laboratories; diluted 1:200 in blocking buffer) for one hour. Cells were washed three times with PBST and then stained with DAPI (Molecular Probes; 1:5000 in PBS) for one minute, washed three times with PBST and then twice with PBS. Cells were viewed with a Nikon Eclipse E600 fluorescence microscope.
Protein analysis
HSCs and LX-1 cells were cultured in DMEM/10% FBS. LX-2 cells were cultured in DMEM/2% FBS. Cells grown in 10 cm dishes were washed three times with cold PBS and harvested in 0.4 ml of cold lysis buffer (20 mM Tris 7.4, 150 mM NaCl, 1% TX-100) with protease inhibitors (Complete, EDTA free; Roche) sonicated, and centrifuged. The supernatant was measured for protein concentration (DC Protein Assay; Biorad, Hercules, California, USA). Samples were adjusted to 1× Laemmli loading buffer and 30 μg of the samples were subjected to 10% sodium dodecyl sulphate-polyacrylamide gel electrophoresis and then transferred to nitrocellulose. Membranes were blocked and washed in TBS Tween buffer and then developed with Western Lightning Plus (Perkin Elmer, Boston, Massachusetts, USA).
For the detection of βPDGF-R, lysates were first immunoprecipitated with a monoclonal antibody for βPDGF-R prior to western blotting. For immunoprecipitation, cells from a 10 cm dish were harvested with 1 ml of cold lysis buffer. Cleared lysates were incubated with antibody and protein G sepharose (UltraLink; Pierce, Rockford, Illinois, USA) overnight at 4°C. After washing three times with lysis buffer, the resin was eluted by resuspension in 1× Laemmli loading buffer and boiling for 10 minutes. To determine the gelatinase (MMP-2) activity secreted by LX-2 cells, gelatin zymography was performed as previously described.8
Comparative quantitative real time RT-PCR
HSCs, LX-1 and LX-2 cells were plated in 60 mm diameter dishes and cultured to 70% confluence. Cells were serum starved and supplemented with 0.2% BSA for 48 hours prior to TGF-β1 treatment (2.5 ng/ml for 20 hours). LX-1 cells were additionally supplemented with 0.5% FBS. Control cells were also serum starved. Total RNA was extracted with TRIzol reagent (Invitrogen, Carlsbad, California, USA) according to the manufacturer’s instructions. Briefly, cells were lysed with the reagent, chloroform was added, and cellular RNA was precipitated by isopropyl alcohol. After washing with 75% ethanol, the RNA pellet was dissolved in nuclease free water.
Total RNA was reverse transcribed to complementary DNA (cDNA) using the Reverse Transcription System (Promega, Madison, Wisconsin, USA). RNA (1 μg) in 7.7 μl of nuclease free water was added to 2.5 μl of 10× reverse transcriptase buffer, 10 μl of 25 mM MgCl2, 2.5 μl of 10 mM dNTP, 1.0 μl of random primer, 0.5 μl of RNase inhibitor, and 0.8 μl of AMV reverse transcriptase in a total volume of 25 μl. The reaction was performed for 10 minutes at 25°C (annealing), 60 minutes at 42°C (cDNA synthesis), and five minutes at 95°C (enzyme denaturation).
Comparative quantitative real time polymerase chain reaction (PCR) was performed with an ABI Prism 7700 Sequence Detection System (Applied Biosystems, Foster City, California, USA). cDNA (1 μl) was used in each PCR reaction. The housekeeping gene β-actin was used as a reference gene for normalisation and H2O was used as a negative control. The primer pairs (sense/antisense) for α1(I) procollagen were 5′-AAC ATG ACC AAA AAC CAA AAG TG-3′ and 5′-CAT TGT TTC CTG TGT CTT CTG G-3′; for HSP47: 5′-ATG AGA AAT TCC ACC ACA AGA TG-3′ and 5′GAT CTT CAG CTG CTC TTT GGT TA-3′; and for β-actin: 5′-GAT GAG ATT GGC ATG GCT TT-3′ and 5′-GAG AAG TGG GGT GGC TT-3′. The PCR reaction was catalysed by Platinum Taq polymerase (Invitrogen) while SYBR Green I DNA binding dye (Molecular Probes) generated the fluorescence signals during each of the 40 cycles, in proportion to the quantities of double stranded DNA (denaturation 15 seconds at 95°C; annealing 15 seconds at 56°C; and extension 40 seconds at 72°C). Analysis of the PCR products by agarose gel electrophoresis confirmed the specificity of the PCR reaction and the homogeneity of the DNA products.
Cell proliferation assay
LX-2 cells were assayed for their proliferative response to BB-PDGF stimulation in serum free conditions by [3H] thymidine incorporation, as previously described.9
Analysis of retinoid biology
Retinol uptake and processing by LX-1 and LX-2 cells
Following plating and overnight incubation, cells were treated with two different concentrations (2 μM and 10 μM) of retinol for 24 hours in the dark. For this purpose, a concentrated stock solution of retinol was diluted in a small volume of ethanol (<1% of the aqueous volume), added to the media with 300 μM palmitic acid to aid esterification, and then vigorously mixed. Following incubation, media from triplicate cultures were removed and cells scraped into 2 ml of ice cold PBS. Samples were then stored at −20°C prior to analysis. Control cells were cultured in medium with ethanol vehicle.
HPLC analyses of retinol and retinyl esters
Retinol and retinyl esters were analysed by reversed phase high pressure liquid chromatography (HPLC), as described by Yamada and colleagues,10 using a Waters 510 HPLC pump (Waters Associates, Milford, Massachusetts, USA) operating at a flow of 1.8 ml/min, an Ultrasphere C18 column (5 μm; 4.6 mm×25 cm) (Beckman Instruments, Fullerton, California, USA), and a Waters 996 Photodiodearray detector. Retinol and retinyl esters were monitored at 325 nm and quantified using standard curves relating the known mass to mass ratio of retinol or retinyl esters to that of internal standard retinyl acetate. This HPLC method allows for detection and quantitation of different retinyl esters, including retinyl palmitate, oleate, stearate, linoleate, and myristate.
Microarray analyses
RNA preparation
RNA was extracted from HSC and LX cells grown to 80% confluence in DMEM containing 10% FBS using Qiagen (Valencia, California, USA) RNeasy column with on-column DNase treatment. RNA was eluted in RNase-free water, and A260/A280 ratios were >2.0. The integrity of the total RNA was verified by denaturing agarose gel electrophoresis (NorthernMax-Gly; Ambion, Austin Texas, USA).
Biotin labelled cRNA (target) preparation
For cDNA synthesis, 5 μg of total RNA were mixed with a T7 primer and Superscript II reverse transcriptase (Invitrogen) and incubated at 42°C for one hour. The second strand of cDNA was generated by mixing the first strand with Escherichia coli DNA polymerase I and RNase H, and incubating at 16°C for two hours. The double stranded cDNA was purified by the QIAquick kit (Qiagen), according to the manufacturer’s protocol. Purified cDNA was eluted in 10 mM Tris-HCl, pH 8.5, and dried in a Speed-Vac. For cRNA synthesis, purified cDNA was incubated with biotin labelled 11-UTP and 11-CTP in an overnight in vitro transcription reaction at 37°C. RNA was purified and recovered by Rneasy column purification (Qiagen) following the manufacturer’s protocol. RNA was eluted in RNase free water and quantified by UV spectrophotometry at 260 nm. The size distribution of the biotin labelled cRNA was verified on a Bioanalyzer (Agilent, Foster City, California, USA), and ranged from 500 to 2000 nucleotides in length (data not shown). The average yield of cRNA was approximately 100 μg per reaction. Biotin labelled cRNA was fragmented by heating at 94°C for 20 minutes in the presence of magnesium, yielding fragments approximately 50–200 nucleotides in length.
Hybridisation and processing
Fragmented biotin labelled cRNA (10 μg) was mixed with the CodeLink hybridisation buffer (260 μl total volume) and injected into replicate (2) CodeLink UniSet Human I bioarrays. Arrays were loaded onto a tray and hybridised overnight at 37°C shaking at 300 RPM in an Innova incubator. Arrays were rinsed individually and then placed in a stringency wash for one hour. Next, each slide was incubated in 3.4 ml of streptavidin-Alexa 647 (Molecular Probes) working solution for 30 minutes, after which the slides were washed four times in 240 ml of TNT buffer. For the final washes, slides were rinsed twice in 240 ml of reagent grade water. The slides were then dried with an N2 gas stream.
Data collection and image analysis
Spot detection was performed with the GenePix Series A scanner (Axon Instruments, Foster City, California, USA) and spot quantitation was performed using the CodeLink software. Key quantitation parameters are briefly described here: local background subtraction is carried out on individual spot intensities, followed by a scaling of each array individually based on the overall array intensity. After median normalisation, the negative control threshold is calculated using a set of negative control probes, as described previously.11,12
Statistical analysis
The normalised dataset was filtered to exclude clones with intensities below the negative threshold value for each array. Array experiments for each cell line were then further filtered to exclude clones that were differentially expressed greater than 1.5-fold between the two technical replicates. Intensities were averaged across technical replicates for each clone, and the SNOMAD (Standardisation and NOrmalisation of MicroArray Data) gene expression data analysis tool (available at http://pevsnerlab.kennedykrieger.org/snomadinput.html) was used to standardise the array data for pairs of cell lines in order to render them more comparable. Briefly, the datasets were log transformed and the R “lowess” function was used to correct for mean local variance. Finally, z scores (that is, standard deviation units relative to the amount of variance in the log values at particular expression levels) were calculated for each clone.13 Clones with z scores greater than 5 or less than −5 and with expression ratios greater than fivefold were considered differentially expressed. Several differentially expressed clones were validated using comparative quantitative reverse transcription (RT)-PCR.
RESULTS
Isolation and immortalisation of human hepatic stellate cells
HSCs were obtained from a ∼15 g wedge of normal liver tissue by collagenase/pronase treatment followed by fractionation on a Nycodenz density gradient to isolate the bouyant and lipid rich stellate cells, as described in the methods section. The primary culture isolate was plated onto an uncoated plastic dish, trypsinised after three days, and subcultured. These cells were passaged three more times in order to remove potential contaminating hepatocytes, endothelial cells, and Kupffer cells, which typically do not survive trypsinisation and subculturing. These passage 4 HSCs were then examined by immunocytochemistry for α-SMA, a marker for activated HSCs, to assess their purity. All cells were positive for α-SMA whereas there was no immunostaining for CD68 or factor VIII related antigen, which are markers for Kupffer and endothelial cells, respectively. Positive control immunostaining for CD68 and factor VIII related antigen in isolated Kupffer cells and endothelial cells confirmed the specificity of these markers (data not shown).
For immortalisation, a culture of the passage 4 cells was transfected with the plasmid pRSV-Tag that expresses the SV40 large T antigen under the control of a rous sarcoma virus promoter. To select for the immortalised cells, we took into account that primary passaged HSCs are viable for only a limited number of passages, and furthermore that they replicate slowly with a doubling time of approximately seven days. We further assumed that the immortalised cells would grow more rapidly than the primary passaged HSCs from which they derived as the SV40 large T antigen is capable of inhibiting G1 cell cycle growth arrest (reviewed by Ali and DeCaprio14). The T antigen transfected culture was subcultured at a 1:10 dilution for several passages with the expectation that immortalised cells would eventually dominate the culture population. After seven rounds of passaging, there was a noticeable morphological change in the culture. The cells were smaller in size, appearing less outstretched, and the proliferation rate markedly increased, with a culture doubling time of only 24 hours. By limiting dilution, single cell clones were isolated and amplified. One clone designated LX-1 was expanded for further investigation.
Another immortalised HSC cell line designated LX-2 was established by applying the selection pressure of growing a subset of early passaged LX-1 cells in reduced serum (1% FBS). The rationale was to establish a cell line that remained viable in the absence of serum growth factor support, characteristic of primary HSCs. Four separate pools of early passage LX-1 cells were grown in reduced serum, and nearly all of the cells detached from the culture dishes after a single day. Three days later, the remaining cells in the culture were reincubated in growth factor rich media (10% fetal bovine serum) for several weeks until they reached confluence, and were then subjected to growth in reduced serum again. After four sequential rounds of this selection procedure, we identified in one out of four original pools a culture of cells which grew stably in 1% FBS. These cells appeared morphologically homogenous and proliferated slowly regardless of the serum concentration, with a culture doubling time of approximately 3–4 days. The LX-2 cell line has since been maintained and expanded in low serum media for up to 50 passages.
To determine if the cell lines expressed the SV40 large T antigen, they were analysed by immunocytochemistry (fig 1 ▶). SV40 large T antigen was mostly localised in the nucleus of the LX-1 cells, whereas the LX-2 cells were negative, indicating the loss of T antigen expression (fig 1 ▶). Western analysis confirmed this finding (data not shown). As a control, cells were costained with DAPI to identify the nuclei (fig 1 ▶).
Figure 1.

Expression of SV40 large T antigen (TAg) in the LX-1 cell line. LX cells were subjected to immunocytochemical analysis (see methods). The SV40 large T antigen was detected in the nucleus of LX-1 cells but not in LX-2 cells. Cells were costained with DAPI to identify nuclei.
Expression of intermediate filaments
Cell lines were also examined by immunocytochemistry for expression of the intermediate filament proteins α-SMA, vimentin, and GFAP, which are typically expressed in HSCs (fig 2 ▶). Both LX-1 and LX-2 cells expressed α-SMA, a marker for activated HSCs. Vimentin, a marker for cell types of mesenchymal origin, and GFAP, a marker of a subpopulation of stellate cells, were present in both cell lines in a cytoskeletal network. Western analysis also confirmed expression of these proteins (data not shown).
Figure 2.

Expression of intermediate filaments by LX-1 and LX-2. LX cells were subjected to immunocytochemical analysis (see methods). Both LX-1 and LX-2 cells expressed and formed a cytoskeletal network of α-smooth muscle actin (α-SMA), vimentin, and glial fibrillary acid protein (GFAP). Cells were costained with DAPI to identify nuclei.
Expression of receptors: PDGF-R, OB-RL, and DDR2
The most potent mitogen towards activated HSCs is PDGF which is a dimer of two polypeptide chains, the A and B chains. Of the three possible dimeric forms (AA, AB, and BB), BB-PDGF, is most potent in stimulating HSC proliferation and migration, consistent with predominant expression of the PDGF receptor β subunit, which responds preferentially to PDGF B chain.15 Both LX cell lines expressed the βPDGF-R subunit, which comigrated with the β subunit of the PDGF receptor expressed by primary human HSCs and with the higher molecular weight form expressed in NIH3T3 cells (fig 3 ▶). This finding suggests that the cell lines represent activated HSCs since the PDGF-R β subunit is not expressed in quiescent cells.9,15 Although both cell lines expressed βPDGF-R, stimulation with BB-PDGF ligand increased proliferation of only LX-2 (fig 3 ▶) but not LX-1 in serum free medium (data not shown), as determined by 3H-thymidine incorporation.
Figure 3.

Expression of the platelet derived growth factor receptor β (βPDGF-R) and response of LX-2 cells to BB-PDGF. (Top) Immunoprecipitation/western analysis (see methods) detected expression of the βPDGF-R subunit in both LX-1 and LX-2 cells. NIH3T3 cells and passaged human hepatic stellate cells (HSC) were used as controls. (Bottom) BB-PDGF ligand (1 and 10 ng/ml) stimulated proliferation of LX-2 cells in serum free medium, as determined by 3H-thymidine incorporation (cpm).
In addition to the PDGF receptor, we identified two other receptors, DDR2 and Ob-RL, in both LX lines (fig 4 ▶). DDR2 is a receptor tyrosine that we previously documented in rat stellate cells.6,16 Human HSCs express DDR2, as determined by western blot (fig 4 ▶). The DDR2 protein appeared as a doublet from both cell lines whereas primary HSCs primarily expressed the higher molecular weight species only. The lower band may represent a form of the receptor that is not tyrosine phosphorylated, as we have previously documented in rat HSCs.6,16
Figure 4.

Expression of receptors and matrix remodelling proteins detected by western analyses. LX cell lines and primary passaged hepatic stellate cells (HSC) were compared side by side for their expression of the receptors discoidin domain receptor 2 (DDR2) and obese receptor long form (Ob-RL), and also for the matrix remodelling proteins MT1-MMP, tissue inhibitor of matrix metalloproteinase (TIMP)-2 and TIMP-1 (see methods): 40 μg of protein from cell lysates were loaded per sample.
Western blot also demonstrated expression of an approximately 200 kDa Ob-RL protein in human HSCs and in the cell lines (fig 4 ▶). Signalling through Ob-RL, the long and signalling competent isoform of the leptin receptor, enhances the fibrogenic response of rodent HSCs.17–19 Moreover, a recent study from our laboratory has documented expression of Ob-RL protein in rat HSCs.19
Matrix remodelling proteins: MMP-2, MT1-MMP, TIMP-1, and TIMP-2
Expression of matrix metalloproteinases (MMPs) and their tissue inhibitors (TIMPs) are increased in liver fibrosis and contribute to both the progression and regression of fibrosis.20 MMP-2 (also known as gelatinase A) is expressed and secreted by HSCs as they become activated in culture.21 MMP-2 proteinase activity is regulated at the cell surface and involves the formation of a tri-molecular complex that associates pro-MMP2 with MT1-MMP (also known as MMP-14) and TIMP-2. All three components of this complex are expressed by activated HSCs.
We examined LX-1 and LX-2 cell lines for expression of this tri-molecular protein complex which regulates MMP-2 activity. Western analysis of whole cell lysates demonstrated all three components (figs 4 ▶, 5 ▶). However, for MMP-2, both the pro- and active forms were both detected in primary HSCs whereas mostly the pro-MMP2 form was detected in both LX cell lines. Secretion of MMP-2 by LX-2 cells was also evaluated but could not be assessed in LX-1 cells as they underwent rapid cell death in the serum free conditions required to determine MMP-2 secretion (serum contains large amounts of MMP-2). LX-2 cultures were serum starved for 16 hours and the harvested conditioned media were subjected to gelatin zymography. This method of analysis can detect gelatinase activity, even of proenzymes, due to sodium dodecyl sulphate induced protein conformational changes that reveal latent activities. Gelatinase activity was detected which corresponds to the higher molecular weight form (pro-MMP-2) detected by western blot (fig 5 ▶).
Figure 5.

Matrix metalloproteinase (MMP)-2 protein expression and activity. (Top) Western analysis detected the pro- and active form of MMP-2 in primary hepatic stellate cells. In LX cells, pro-MMP-2 was mostly detected: 40 μg of protein from cell lysates were loaded per sample. (Bottom) Gelatin zymography of conditioned media from LX-2 cells indicated secretion of pro-MMP2.
Expression of TIMP-1 protein, which inhibits collagen degradation, was also evaluated. Both TIMP-1 and TIMP-2 expression increase dramatically as HSCs become activated in culture. In contrast with LX-1 and primary HSCs, LX-2 cells expressed only a small amount of TIMP-1 protein (fig 4 ▶). However, we only examined TIMP expression in cell lysates, and as TIMPs are usually secreted, there may be a considerable amount in the culture media. For TIMP-2, its detection in cell lysates may be due to its association with MT1-MMP at the cell surface. It is unclear why TIMP-1 is abundant in HSC and LX-1 cell lysates, but not in those of LX-2 cells (fig 4 ▶). However, TIMP-1 production in LX-2 was stimulated in response to leptin, a profibrogenic hormone in the liver.22
Expression of α1(I) procollagen and HSP47 mRNA
To evaluate the ability of the cell lines to produce fibrillar type I collagen that is associated with fibrosis, comparative quantitative real time RT-PCR was performed for α1(I) procollagen and HSP47 mRNAs. HSP47 is a collagen specific chaperone protein that is required for collagen biosynthesis and is involved in procollagen processing, maturation, and secretion.23 HSP47 mRNA is expressed in human HSCs and in the LX-1 and LX-2 cell lines, with 50% greater expression in LX-1 than LX-2. LX cells also expressed much more HSP47 mRNA than the hepatoma cell lines Huh7 and HepG2, which were used as a negative control (fig 6 ▶). Expression of α1(I) procollagen paralleled the level of HSP47 expression across primary HSCs and LX cell lines (fig 6 ▶).
Figure 6.

HSP47 (A) and α1(I) procollagen (B) mRNA expression. Primary hepatic stellate cells (HSC), LX cells, and the hepatoma cells Huh7 and HepG2 were examined and compared for their expression of HSP47 (A) and α1(I) procollagen (B) mRNA. using quantitative real time reverse transcription-polymerase chain reaction (see methods). Expression levels of primary HSC were used as a reference point set at 1 and the fold differences are indicated. Error bars represent mean (SEM) (n = 3). All cells were cultured in Dulbecco’s modified Eagle’s medium (DMEM)/10% fetal bovine serum (FBS) except for LX-2 cells which were cultured in DMEM with only 1% FBS.
TGF-β1 stimulates α(1)I procollagen mRNA in LX cell lines
TGF-β1 is a potent profibrogenic cytokine of primary HSCs that stimulates expression of α(1)I procollagen mRNA. TGF-β1 treatment of LX-1 and LX-2 cells increased expression of α1(I) procollagen mRNA by 3–4-fold, as assessed by comparative real time RT-PCR (fig 7 ▶).
Figure 7.
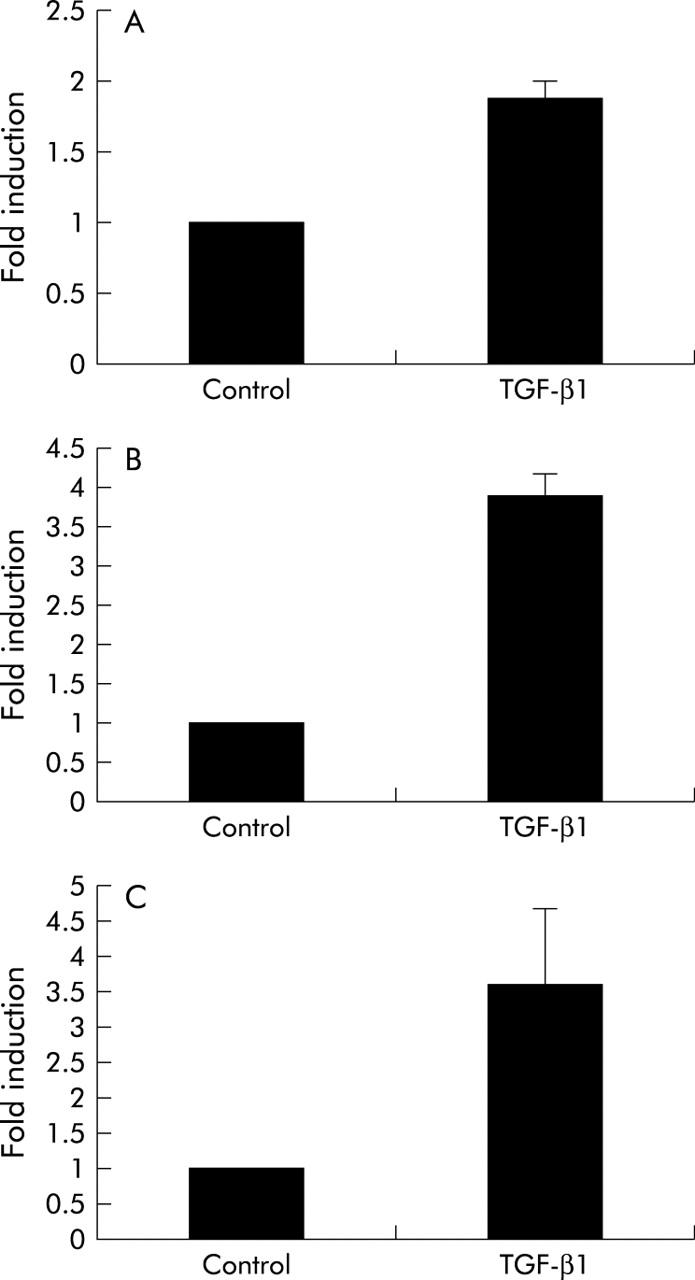
Transforming growth factor β1 (TGF-β1) increases α1(I) procollagen mRNA in hepatic stellate cells (HSC) (A), and LX-1 (B) and LX-2 (C) cells. Primary HSCs and LX cells were examined for their responsiveness to TGF-β1, as measured by its effects on α1(I) procollagen mRNA levels using quantitative real time reverse transcription-polymerase chain reaction (see methods). Untreated controls were used as a reference point set at 1 and the fold induction after TGF-β1 treatment (2.5 ng/ml for 20 hours) is shown. Error bars represent mean (SEM) (n = 3).
LX-2 cells are highly transfectable
A major technical limitation to studying cultured stellate cells has been their consistently very low transfection efficiency, typically less than 1%. This has imposed significant limitations in the study of this cell type, as molecular genetic manipulation by ectopic overexpression of genes (and dominant negatives thereof) could not be performed. Viral infection of HSCs has been reported24,25 but is time consuming. In contrast, LX-2 cells displayed a relatively high transfection efficiency of >30% using a commercial reagent, Fugene (fig 8 ▶). LX-1 and primary human HSCs displayed <1% efficiency with Fugene (data not shown).
Figure 8.

Transfection efficiency of LX-2 cells. LX-2 cells plated to 80% confluence in six well culture dishes were transfected with Fugene and 2.5 μg of pEGFP-C2 (Clontech), a plasmid that expresses enhanced green fluorescent protein. (A) Bright field image of transfected LX-2 cells. (B) Fluorescence image of the same field of cells.
LX-1 and LX-2 cell lines metabolise retinoids
LX-1 and LX-2 stellate cells were analysed for their ability to take up and esterify retinol (2 μM and 10 μM). In untreated cells, no retinyl esters and only very low levels of retinol could be detected. (Concentration of retinol in medium containing 10% FBS is approximately 0.1 μM, which is well below the physiological concentration of retinol (2 μM).) As depicted in fig 9 ▶, both retinol and retinyl esters accumulated in LX-1 and LX-2 stellate cells on retinol incubation, which was greater at higher concentrations of added retinol. Both cell lines accumulated retinol and converted it to retinyl ester to a similar extent. Retinyl esters were present only intracellularly and none could be detected in the medium. Thus retinoid metabolism by LX-1 and LX-2 lines is similar to that reported in rat liver stellate cells.26
Figure 9.
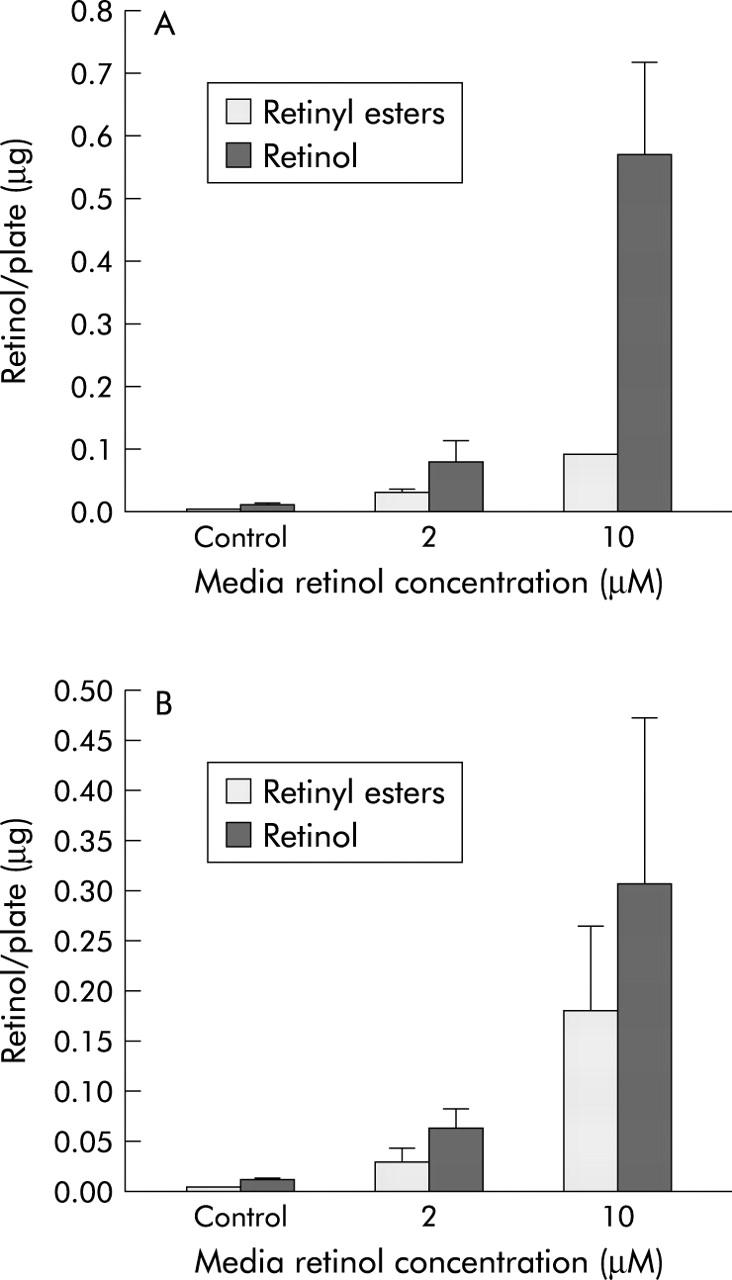
LX-1 and LX-2 cells accumulate and esterify retinol. LX-1 (A) and LX-2 (B) cell culture media were supplemented with 0 (control), 2, or 10 μM retinol for 24 hours. Cells were then washed with ice cold phosphate buffered saline and harvested. Cell levels of retinol and retinyl esters were measured by high pressure liquid chromatography, as described in the methods section.
Gene expression analysis of LX-1 and LX-2 cell lines by microarray compared with primary HSCs
To achieve a more global characterisation of gene expression by LX-1 and LX-2, we compared their mRNA profiles to primary HSCs by microarray analysis using Amersham Codelink to scan approximately 10 000 gene probes (clones). Of the 2211 clones detected with expression above negative thresholds for both LX-1 and primary HSCs, 36 were differentially expressed (98.4% similarly expressed), and of the 2240 clones detected with expression above negative thresholds for both LX-2 and primary HSCs, 28 were differentially expressed (98.7% similarly expressed). Of the 2692 clones expressed above negative thresholds for both LX-1 and LX-2 cell lines, 18 were differentially expressed (99.3% similarly expressed). Therefore, there were even fewer differentially expressed genes between the two LX cell lines.
Eighteen genes were similarly differentially expressed in both LX-1 and LX-2 when compared with primary HSCs (tables 1 ▶–3 ▶). Both LX-1 and LX-2 cell lines showed reduced expression of p21, as might be expected given their immortalised phenotype, which was confirmed by real time PCR (not shown). Also consistent with an immortalised phenotype is the increased expression of CDC2, thymidine kinase 1, TGF-βI induced 68 kDa protein, CSE1L (chromosome segregation 1-like), and survivin, all of which have been shown to either promote proliferation or are antiapoptotic. Differential expression of these genes is not simply a consequence of T antigen overexpression as LX-2 cells do not express T antigen. Both LX cell lines also had reduced expression of LTBP2 (latent TGF-β binding protein 2) and ITGA7 (integrin alpha 7).
Table 1.
Differential gene expression by LX-1 and LX-2 cell lines compared with primary hepatic stellate cells (HSCs): genes similarly expressed in LX-1 and LX-2 but differentially expressed in comparison with primary HSCs
| ↑ | NM_014501 | Ubiquitin carrier protein (E2-EPF) |
| ↑ | NM_001316 | Chromosome segregation 1 (CSE1L) |
| ↑ | NM_005496 | Chromosome associated polypeptide C (CAP-C) |
| ↑ | NM_006342 | Transforming, acidic coiled-coil containing protein 3 |
| ↑ | NM_014791 | Maternal embryonic leucine zipper kinase |
| ↑ | NM_000358 | Transforming growth factor β induced (TGFBI) |
| ↑ | NM_004221 | Natural killer cell transcript 4 (NK4) |
| ↑ | NM_001786 | Cell division cycle 2 (CDC2) |
| ↑ | NM_003752 | Eukaryotic translation initiation factor 3, subunit 8 |
| ↑ | NM_014390 | EBNA-2 co-activator |
| ↑ | NM_001168 | Baculoviral IAP repeat containing 5 (survivin) (BIRC5) |
| ↑ | NM_003258 | Thymidine kinase 1 (TK1) |
| ↑ | NM_018131 | Unknown |
| ↑ | NM_031299 | Unknown |
| ↓ | AK026920 | Unknown |
| ↓ | NM_000389 | Cyclin dependent kinase inhibitor 1A (p 21, CIP1) |
| ↓ | NM_000428 | Latent transforming growth factor β binding protein 2 (LTBP2) |
| ↓ | NM_002206 | Integrin, alpha 7 (ITGA7) |
DNA microarray analyses of LX-1 cells versus primary HSCs and of LX-2 cells versus primary HSCs were performed as described in the methods section. The resulting datasets were normalised and compared pairwise using the SNOMAD (Standardisation and NOrmalisation of MicroArray Data) gene expression data analysis tool available at http://pevsnerlab.kennedykrieger.org/snomadinput.html.12 Genes with z scores >5 or ⩽5 and expression ratios greater than fivefold were considered differentially expressed. A selection of genes that were differentially expressed in the cell lines when compared with primary HSCs are listed (upregulated genes (↑); downregulated genes (↓)). Designations (“NM_”) refer to GenBank accession numbers.
Table 3.
Differential gene expression by LX-1 and LX-2 cell lines compared with primary hepatic stellate cells (HSCs): genes differentially expressed only in LX-2 compared with primary HSCs
| ↑ | NM_007085 | Follistatin-like 1 (FSTL1) |
| ↑ | NM_004526 | Minichromosome maintenance deficient 2 |
| ↑ | NM_000916 | Oxytocin receptor (OXTR) |
| ↑ | NM_016139 | Unknown |
| ↓ | AI207579 | Unknown |
| ↓ | AA708326 | Unknown |
| ↓ | AY027862 | Mammalian ependymin related protein 1 (MERP1) |
| ↓ | NM_030777 | Solute carrier family 2 (facilitated glucose transporter) |
| ↓ | NM_002705 | Periplakin (PPL) |
| ↓ | NM_007361 | Nidogen 2 (NID2) |
See footnote to table 1 ▶.
Genes that are specifically differentially expressed in LX-1 compared with primary HSCs include PIG11 (p53 induced gene 11), CTGF (connective tissue growth factor), and decorin (tables 1 ▶–3 ▶). Reduced expression of PIG11 in LX-1 is consistent with inactivation of p53 by T antigen. Genes that are specifically differentially expressed in LX-2 cells include the oxytocin receptor and follistatin-like 1.
Increasing evidence points to a neuronal phenotype of hepatic stellate cells.27 Indeed, a large number of neuronal related genes were expressed in primary human stellate cells as well as in LX-1 and LX-2 cells (table 4 ▶).
Table 4.
Expression of neural genes by primary human stellate cells and LX-1 and LX-2 cell lines
| NM_000681 | Adrenergic alpha 2a receptor (ADRA2A) |
| NM_004886 | Amyloid beta (a4) binding protein |
| NM_006317 | Brain acid soluble protein (BASP1) |
| NM_012109 | Brain specific membrane anchored protein (BSMAP) |
| NM_014171 | Cript (postsynaptic protein) |
| NM_000099 | Cystatin C |
| NM_020806 | Gephyrin (postsynaptic protein) (GPHN) |
| NM_004124 | Glia maturation factor beta |
| NM_002499 | Neogenin (NEO1) |
| NM_016592 | Neuroendocrine secretory protein 55 (NESP55) |
| NM_013962 | Neuregulin 1 (NRG1) |
| NM_015678 | Neurobeachin (NBEA) |
| NM_006176 | Neurogranin (NRGN) |
| NM_003717 | Neuropeptide FF amide peptide precursor (NPFF) |
| NM_003619 | Neurotrypsin (PRSS12) |
| NM_002545 | Opioid binding protein (OPCML) |
| NM_012486 | Presenilin 2 (PSEN2) |
| NM_000311 | Prion protein (P27–30) |
| NM_021947 | Serine racemase (SRR) |
| NM_000865 | Serotonin receptor 1E (HTR1E) |
| NM_014232 | Synaptobrevin 2 |
| NM_007286 | Synaptopodin |
| NM_006754 | Synaptophysin-like protein (SYPL) |
DISCUSSION
We established two human hepatic stellate cell lines and characterised their global gene expression by microarray. These cell lines provide important tools to study mechanisms of hepatic fibrogenesis and the testing of antifibrotic compounds. LX-1 cells express SV40 large T antigen whereas LX-2 cells are immortalised without sustained T antigen; both are stable for at least 50 passages thus far. The phenotype of both LX lines is most similar to that of “activated” cells in vivo. For example, expression of GFAP by LX lines is more typical of chronic liver disease in which both HSCs and portal myofibroblasts express this intermediate filament28 whereas in normal liver the majority of human HSCs are not immunoreactive for this intermediate filament.29 In addition to GFAP, LX cells express the receptors βPDGF-R, DDR2, and Ob-RL that are expressed in activated HSCs but not in quiescent cells. Despite this activated phenotype, LX-1 and LX-2 lines can be quiesced by growth in matrigel (not shown) or low serum30 which is similar to results that we have reported for an immortalised rat stellate cell line HSC-T6.15
Both cell lines express the β subunit of the PDGF receptor but only the LX-2 cells are responsive to BB-PDGF induced proliferation. One potential explanation for this insensitivity in LX-1 is that the cells are already maximally stimulated by either serum derived or autocrine PDGF. Similar to primary activated HSCs, LX-2 cells remain viable in serum free medium with 0.2% BSA in contrast with LX-1 cells. LX-1 and LX-2 cells are responsive to TGF-β1, a major fibrogenic cytokine in liver disease. TGF-β1 is increased in animal models of liver fibrosis and in patients with chronic liver disease.31,32
HSCs have been characterised by their expression of specific marker genes, yet in vivo there is considerable heterogeneity and plasticity of their phenotype.28,29,33–35 Such heterogeneous patterns of expression are likely to reflect local influences of the microenvironment that include extracellular matrix, soluble autocrine and paracrine factors, and cell-cell communication.
Established cell lines will, by definition, differ to some extent in their molecular phenotype from cultured primary cells as they are immortal. Of the three other human stellate cell lines (besides LX-1 and LX-2) described to date, only the hTERT-HSC cell line is derived from density gradient purified HSCs, similar to the LX lines. The hTERT-HSC cell line was developed by immortalisation with retroviral expression of human telomerase.5 Interestingly, like LX cells, the hTERT-HSC cell line expresses GFAP which is also expressed by a majority but not all activated human HSCs in vivo. The two other human stellate cell lines represent spontaneous outgrowths from diseased livers: the LI90 cell line was derived from an outgrowth of a hepatic mesenchymal tumour36 and the GREF-X cell line was obtained by spontaneous immortalisation of cultured liver myofibroblasts from a cirrhotic liver explant outgrowth.37 Importantly, of all human stellate cell lines generated to date, only the LX-2 cell line remains viable in the absence of serum. In addition to validating fibrogenic pathways in LX-1 and LX-2 cells, we have also demonstrated that the LX cell lines express the components of a matrix degrading complex. Specifically, they express the gelatinase A matrix remodelling complex, comprised of pro-MMP-2, MT1-MMP, and TIMP-2. Moreover, LX-2 cells secrete pro-MMP2, making them an important potential tool for exploring matrix degradative pathways in a human cell model. Recently, LX-2 cells were shown to be migratory due to increased MMP-2 activity from cytokine stimulation.38 Increasing evidence also links matrix degradation directly to apoptosis in stellate cells,39 and the unique capacity of LX-2 cells to withstand serum deprivation not only provides a means to assay MMP-2 by zymography without the confounding effects of serum but also to explore pathways of apoptosis. Recently, LX-2 cells were shown to be capable of undergoing TRAIL mediated apoptosis, as do primary HSCs.30
A unique advantage of LX-2 cells is their relative high transfectability, with efficiencies of transfection of ∼30% using commercial reagents (Fugene), compared with efficiencies of less than 1% for LX-1 cells and all other stellate cell culture systems reported to date.
The microarray analysis also unearthed potential therapeutic targets described for other pathological conditions, and also confirmed expression of several neuronal genes in this cell type. For example, progranulin (also called granulin or PC derived growth factor) was expressed equally in the cell lines and primary HSCs, and is a novel growth factor induced in cutaneous wound healing.40 Both LX-1 and LX-2 lines display increased expression of survivin. This molecule belongs to a family of genes known as inhibitors of apoptosis, and has also been implicated in the control of mitosis and regulation of smooth muscle cell biology in vascular injury.41,42 Expression of follistatin-like 1 (FSTL1, FRP, TSC-36) by stellate cells is intriguing as the protein that it shares likeness to (follistatin) has been shown to enhance liver regeneration and also has antifibrotic effects on pancreatic stellate cells.43–45
Current antifibrotic drug development focuses on target gene identification using array technologies, and validation of lead compounds using high throughput analysis in cell based assays. Human rather than rodent cells are absolutely essential for such approaches, and the availability of cell lines that faithfully maintain the in vivo phenotype are a vital component. The LX-1 and LX-2 lines represent such reagents, and the LX-2 line in particular, with its high transfectability and ability to withstand serum free conditions, provide important new tools in the elucidation of stellate cell biology and the discovery of antifibrotic therapies.
Table 2.
Differential gene expression by LX-1 and LX-2 cell lines compared with primary hepatic stellate cells (HSC)s: genes differentially expressed only in LX-1 compared with primary HSCs
| ↑ | NM_031844 | Heterogeneous nuclear ribonucleoprotein |
| ↑ | NM_001813 | Centromere protein E (CENPE) |
| ↑ | NM_017458 | Major vault protein (MVP) |
| ↑ | NM_001070 | Tubulin, gamma 1 (TUBG1) |
| ↑ | NM_021947 | Serine racemase (SRR) |
| ↑ | NM_017613 | Downstream neighbour of SON (DONSON) |
| ↑ | NM_006397 | Ribonuclease HI, large subunit (RNASEHI) |
| ↑ | NM_005110 | Glutamine-fructose-6-phosphate transaminase 2 (GFPT2) |
| ↑ | NM_004077 | Citrate synthase (CS) |
| ↑ | AB014599 | Unknown |
| ↓ | NM_023037 | Unknown |
| ↓ | NM_001920 | Decorin (DCN) |
| ↓ | NM_004624 | Vasoactive intestinal peptide receptor 1 (VIPR1) |
| ↓ | NM_006034 | P53 induced protein (PIG11) |
| ↓ | NM_001901 | Connective tissue growth factor (CTGF) |
| ↓ | NM_002373 | Microtubule associated protein 1A (MAP1A) |
| ↓ | NM_020404 | Tumour endothelial marker 1 precursor (TEM1) |
| ↓ | NM_002514 | Nephroblastoma overexpressed gene (NOV) |
See footnote to table 1 ▶.
Acknowledgments
This work was supported by grants from the NIH to SLF (DK37340 and DK56621) and WB (DK068437), the US Department of Defense to WB (DOD BC031116), the Artzt Family Primary Biliary Cirrhosis Program, the Feld Fibrosis Fund, and an American Liver Foundation Liver Scholar Award to FE. Technical assistance from Michael Cooreman and Jose Walewski is gratefully acknowledged.
Abbreviations
HSC, hepatic stellate cell
PDGF, platelet derived growth factor
βPDGF-R, PDGF receptor β
DDR2, discoidin domain receptor 2
Ob-RL, obese receptor long form
MMP, matrix metalloproteinase
TIMP, tissue inhibitor of matrix metalloproteinase
TGF-β1, transforming growth factor β1
BSA, bovine serum albumin
DMEM, Dulbecco’s modified Eagle’s medium
α-SMA, α smooth muscle actin
GFAP, antiglial fibrillary acid protein
FBS, fetal bovine serum
PBS, phosphate buffered saline
RT-PCR, reverse transcription-polymerase chain reaction
HPLC, high pressure liquid chromatography
Conflict of interest: None declared.
REFERENCES
- 1.Friedman SL. Molecular regulation of hepatic fibrosis, an integrated cellular response to tissue injury. J Biol Chem 2000;275:2247–50. [DOI] [PubMed] [Google Scholar]
- 2.Schuppan D , Ruehl M, Somasundaram R, et al. Matrix as modulator of stellate cell and hepatic fibrogenesis. Semin Liver Dis 2001;21:351–72. [DOI] [PubMed] [Google Scholar]
- 3.Rockey DC. Hepatic blood flow regulation by stellate cells in normal and injured liver. Semin Liver Dis 2001;21:337–50. [DOI] [PubMed] [Google Scholar]
- 4.Friedman SL, Roll FJ, Boyles J, et al. Maintenance of differentiated phenotype of cultured rat hepatic lipocytes by basement membrane matrix. J Biol Chem 1989;264:10756–62. [PubMed] [Google Scholar]
- 5.Schnabl B , Choi YH, Olsen JC, et al. Immortal activated human hepatic stellate cells generated by ectopic telomerase expression. Lab Invest 2002;82:323–33. [DOI] [PubMed] [Google Scholar]
- 6.Olaso E , Ikeda K, Eng FJ, et al. DDR2 receptor promotes MMP-2-mediated proliferation and invasion by hepatic stellate cells. J Clin Invest 2001;108:1369–78. [DOI] [PMC free article] [PubMed] [Google Scholar]
- 7.Friedman SL, Rockey DC, McGuire RF, et al. Isolated hepatic lipocytes and Kupffer cells from normal human liver: morphological and functional characteristics in primary culture. Hepatology 1992;15:234–43. [DOI] [PubMed] [Google Scholar]
- 8.Olaso E , Santisteban A, Bidaurrazaga J, et al. Tumor-dependent activation of rodent hepatic stellate cells during experimental melanoma metastasis. Hepatology 1997;26:634–42. [DOI] [PubMed] [Google Scholar]
- 9.Friedman SL, Arthur MJ. Activation of cultured rat hepatic lipocytes by Kupffer cell conditioned medium. Direct enhancement of matrix synthesis and stimulation of cell proliferation via induction of platelet-derived growth factor receptors. J Clin Invest 1989;84:1780–5. [DOI] [PMC free article] [PubMed] [Google Scholar]
- 10.Yamada M , Blaner WS, Soprano DR, et al. Biochemical characteristics of isolated rat liver stellate cells. Hepatology 1987;7:1224–9. [DOI] [PubMed] [Google Scholar]
- 11.Ramakrishnan R , Dorris D, Lublinsky A, et al. An assessment of Motorola CodeLink microarray performance for gene expression profiling applications. Nucleic Acids Res 2002;30:e30. [DOI] [PMC free article] [PubMed] [Google Scholar]
- 12.Dorris DR, Nguyen A, Gieser L, et al. Oligodeoxyribonucleotide probe accessibility on a three-dimensional DNA microarray surface and the effect of hybridization time on the accuracy of expression ratios. BMC Biotechnol 2003;3:6. [DOI] [PMC free article] [PubMed] [Google Scholar]
- 13.Colantuoni C , Henry G, Zeger S, et al. SNOMAD (Standardization and NOrmalization of MicroArray Data): web-accessible gene expression data analysis. Bioinformatics 2002;18:1540–1. [DOI] [PubMed] [Google Scholar]
- 14.Ali SH, DeCaprio JA. Cellular transformation by SV40 large T antigen: interaction with host proteins. Semin Cancer Biol 2001;11:15–23. [DOI] [PubMed] [Google Scholar]
- 15.Wong L , Yamasaki G, Johnson RJ, et al. Induction of beta-platelet-derived growth factor receptor in rat hepatic lipocytes during cellular activation in vivo and in culture. J Clin Invest 1994;94:1563–9. [DOI] [PMC free article] [PubMed] [Google Scholar]
- 16.Ikeda K , Wang LH, Torres R, et al. Discoidin domain receptor 2 interacts with Src and Shc following its activation by type I collagen. J Biol Chem 2002;277:19206–12. [DOI] [PubMed] [Google Scholar]
- 17.Honda H , Ikejima K, Hirose M, et al. Leptin is required for fibrogenic responses induced by thioacetamide in the murine liver. Hepatology 2002;36:12–21. [DOI] [PubMed] [Google Scholar]
- 18.Ikejima K , Takei Y, Honda H, et al. Leptin receptor-mediated signaling regulates hepatic fibrogenesis and remodeling of extracellular matrix in the rat. Gastroenterology 2002;122:1399–410. [DOI] [PubMed] [Google Scholar]
- 19.Saxena NK, Ikeda K, Rockey DC, et al. Leptin in hepatic fibrosis: evidence for increased collagen production in stellate cells and lean littermates of ob/ob mice. Hepatology 2002;35:762–71. [DOI] [PMC free article] [PubMed] [Google Scholar]
- 20.Iredale JP. Stellate cell behavior during resolution of liver injury. Semin Liver Dis 2001;21:427–36. [DOI] [PubMed] [Google Scholar]
- 21.Arthur MJ, Friedman SL, Roll FJ, et al. Lipocytes from normal rat liver release a neutral metalloproteinase that degrades basement membrane (type IV) collagen. J Clin Invest 1989;84:1076–85. [DOI] [PMC free article] [PubMed] [Google Scholar]
- 22.Cao Q , Mak KM, Ren C, et al. Leptin stimulates tissue inhibitor of metalloproteinase-1 in human hepatic stellate cells: Respective roles of the JAK/STAT and JAK-mediated H2O2 dependent MAPK pathways. J Biol Chem 2004;279:4292–304. [DOI] [PubMed] [Google Scholar]
- 23.Hendershot LM, Bulleid NJ. Protein-specific chaperones: the role of hsp47 begins to gel. Curr Biol 2000;10:R912–15. [DOI] [PubMed] [Google Scholar]
- 24.Hellerbrand C , Jobin C, Licato LL, et al. Cytokines induce NF-kappaB in activated but not in quiescent rat hepatic stellate cells. Am J Physiol 1998;275:G269–78. [DOI] [PubMed] [Google Scholar]
- 25.Gao R , McCormick CJ, Arthur MJ, et al. High efficiency gene transfer into cultured primary rat and human hepatic stellate cells using baculovirus vectors. Liver 2002;22:15–22. [DOI] [PubMed] [Google Scholar]
- 26.Vogel S , Piantedosi R, Frank J, et al. An immortalized rat liver stellate cell line (HSC-T6): a new cell model for the study of retinoid metabolism in vitro. J Lipid Res 2000;41:882–93. [PubMed] [Google Scholar]
- 27.Cassiman D , Denef C, Desmet VJ, et al. Human and rat hepatic stellate cells express neurotrophins and neurotrophin receptors. Hepatology 2001;33:148–58. [DOI] [PubMed] [Google Scholar]
- 28.Cassiman D , Libbrecht L, Desmet V, et al. Hepatic stellate cell/myofibroblast subpopulations in fibrotic human and rat livers. J Hepatol 2002;36:200–9. [DOI] [PubMed] [Google Scholar]
- 29.Levy MT, McCaughan GW, Abbott CA, et al. Fibroblast activation protein: a cell surface dipeptidyl peptidase and gelatinase expressed by stellate cells at the tissue remodelling interface in human cirrhosis. Hepatology 1999;29:1768–78. [DOI] [PubMed] [Google Scholar]
- 30.Taimr P , Higuchi H, Kocova E, et al. Activated stellate cells express the TRAIL receptor-2/death receptor-5 and undergo TRAIL-mediated apoptosis. Hepatology 2003;37:87–95. [DOI] [PubMed] [Google Scholar]
- 31.Nakatsukasa H , Nagy P, Evarts RP, et al. Cellular distribution of transforming growth factor-beta 1 and procollagen types I, III, and IV transcripts in carbon tetrachloride-induced rat liver fibrosis. J Clin Invest 1990;85:1833–43. [DOI] [PMC free article] [PubMed] [Google Scholar]
- 32.Castilla A , Prieto J, Fausto N. Transforming growth factors beta 1 and alpha in chronic liver disease. Effects of interferon alfa therapy. N Engl J Med 1991;324:933–40. [DOI] [PubMed] [Google Scholar]
- 33.Geerts A , Lazou JM, De Bleser P, et al. Tissue distribution, quantitation and proliferation kinetics of fat-storing cells in carbon tetrachloride-injured rat liver. Hepatology 1991;13:1193–202. [PubMed] [Google Scholar]
- 34.Zou Z , Ekataksin W, Wake K. Zonal and regional differences identified from precision mapping of vitamin A-storing lipid droplets of the hepatic stellate cells in pig liver: a novel concept of addressing the intralobular area of heterogeneity. Hepatology 1998;27:1098–108. [DOI] [PubMed] [Google Scholar]
- 35.Wake K , Sato T. Intralobular heterogeneity of perisinusoidal stellate cells in porcine liver. Cell Tissue Res 1993;273:227–37. [DOI] [PubMed] [Google Scholar]
- 36.Murakami K , Abe T, Miyazawa M, et al. Establishment of a new human cell line, LI90, exhibiting characteristics of hepatic Ito (fat-storing) cells. Lab Invest 1995;72:731–9. [PubMed] [Google Scholar]
- 37.Weill FX, Blazejewski S, Blanc JF, et al. Characterization of a new human liver myofibroblast cell line: transcriptional regulation of plasminogen activator inhibitor type I by transforming growth factor beta 1. Lab Invest 1997;77:63–70. [PubMed] [Google Scholar]
- 38.Yang C , Zeisberg M, Mosterman B, et al. Liver fibrosis: Insights into migration of hepatic stellate cells in response to extracellular matrix and growth factors. Gastroenterology 2003;124:147–59. [DOI] [PubMed] [Google Scholar]
- 39.Murphy FR, Issa R, Zhou X, et al. Inhibition of apoptosis of activated hepatic stellate cells by tissue inhibitor of metalloproteinase-1 is mediated via effects on matrix metalloproteinase inhibition: implications for reversibility of liver fibrosis. J Biol Chem 2002;277:11069–76. [DOI] [PubMed] [Google Scholar]
- 40.He Z , Ong CH, Halper J, et al. Progranulin is a mediator of the wound response. Nat Med 2003;9:225–9. [DOI] [PubMed] [Google Scholar]
- 41.O’Driscoll L , Linehan R, Clynes M. Survivin: role in normal cells and in pathological conditions. Curr Cancer Drug Targets 2003;3:131–52. [DOI] [PubMed] [Google Scholar]
- 42.Blanc-Brude OP, Yu J, Simosa H, et al. Inhibitor of apoptosis protein survivin regulates vascular injury. Nat Med 2002;8:987–94. [DOI] [PubMed] [Google Scholar]
- 43.Kogure K , Zhang YQ, Shibata H, et al. Immediate onset of DNA synthesis in remnant rat liver after 90% hepatectomy by an administration of follistatin. J Hepatol 1998;29:977–84. [DOI] [PubMed] [Google Scholar]
- 44.Takabe K , Wang L, Leal AM, et al. Adenovirus-mediated overexpression of follistatin enlarges intact liver of adult rats. Hepatology 2003;38:1107–15. [DOI] [PubMed] [Google Scholar]
- 45.Ohnishi N , Miyata T, Ohnishi H, et al. Activin A is an autocrine activator of rat pancreatic stellate cells: potential therapeutic role of follistatin for pancreatic fibrosis. Gut 2003;52:1487–93. [DOI] [PMC free article] [PubMed] [Google Scholar]