

Abstract
Introduction: Soluble cytokine receptors (sCRs) modulate the in vivo activity of cytokines. Deficient sCR production could participate in the pathogenesis and course of Crohn’s disease (CD). The aim of the study was to examine the profile of sCRs in CD patients and their modulation by infliximab and corticosteroids.
Methods: We prospectively examined active CD patients (aCD) treated with either infliximab (n = 21) or corticosteroids (n = 9), CD patients in clinical remission (rCD, n = 20), ulcerative colitis patients (UC, n = 24), and healthy subjects (HS, n = 15). Cultures of colonic biopsies were also examined from CD inflamed (n = 8), CD non-inflamed (n = 7), and healthy mucosa (n = 8). Levels of tumour necrosis factor α (TNF-α), soluble TNF receptor I (sTNFRI), soluble TNF receptor II (sTNFRII), interleukin 1β (IL-1β), soluble IL-1 receptor I (sIL-1RI), soluble IL-1 receptor II (sIL-1RII), IL-6, soluble IL-6 receptor (sIL-6R), and sgp130 were measured using ELISA.
Results: Higher levels of sTNFRI (p<0.05, p<0.01), sTNFRII (p<0.01, p<0.01), sIL-1RI (p<0.05, NS), IL-6 (p<0.01, p<0.01), and sIL-6R (p<0.05, NS) were observed in aCD compared with rCD and HS. Interestingly, sIL-1RII (p<0.05, p<0.01) and sgp130 (p<0.01, p<0.01) were profoundly decreased in aCD compared with rCD and HS, and were negatively correlated with CRP. Deficient production of sIL-1RII was specific to CD (not observed in ulcerative colitis), and was further confirmed at the mucosal level. Infliximab decreased sTNFRII at one and four weeks (p<0.05) and enhanced sIL-6R levels at one week (p<0.05). Corticosteroids increased sIL-1RII levels at one week (p<0.05).
Conclusion: CD is associated with dysregulated production of sCRs. Deficiency in sIL-1RII and sgp130 may be essential to CD pathogenesis. Their replacement through the use of fusion proteins could represent future alternative therapeutic strategies for CD.
Keywords: cytokine receptors, Crohn’s disease, acute phase response, sIL-1-RII, sgp130
Cytokines are key players in the triggering of inflammation and development of the acute phase response (APR). Their effects are mediated through binding to specific membrane bound receptors expressed on target cells.1 Soluble forms of these receptors are generated in vivo, either by proteolytic cleavage of their membrane forms or by alternative splicing,2 and act as cytokine scavengers. Most soluble cytokine receptors (sCRs) prevent cytokines from binding to their cognate membrane receptors and thereby inhibit cytokine signalling. An important exception to this rule is trans-signalling where a soluble receptor promotes cytokine signalling. For example, soluble interleukin 6 receptor (sIL-6R) potentiates IL-6 mediated signal transduction on IL-6R− and gp130+ expressing cells.3 Conversely, the soluble form of gp130 can bind to sIL-6R/IL-6 complexes and prevent their interactions with membrane gp130 on target cells.4 Thus sCRs actively control feedback regulatory loops during inflammation.
Crohn’s disease (CD) results from an inappropriate innate immune response to the gut lumen microflora. Recognition of bacterial products through toll-like receptors expressed on intestinal epithelial cells and mucosal macrophages induces the release of a large amount of proinflammatory mediators.5,6 Interleukin 1β (IL-1β), tumour necrosis factor α (TNF-α), and IL-6 orchestrate the APR, which can lead to a selective innate immune response.7 These cytokines in turn stimulate the adrenal release of cortisol and induce reprioritisation of hepatic protein synthesis. This leads to increased production of acute phase proteins, of which C reactive protein (CRP) is the most representative. While very little is known about the role of sCRs in CD, it is likely that their production may ultimately influence CD activity.
The aim of this study was to characterise the profile of sCRs (sIL-6R, sgp130, soluble IL-1 receptor I (sIL-1RI), soluble IL-1 receptor II (sIL-1RII), soluble TNF receptor I (sTNFRI), and soluble TNF receptor II (sTNFRII)) in quiescent and active CD. Furthermore, we prospectively examined the pattern of sCRs production after corticosteroid and infliximab administration in these CD patients in order to understand their regulation and role during the course of the disease.
MATERIALS AND METHODS
Selection of patients and study design
Fifty patients with CD, diagnosed on the basis of accepted clinical, radiological, endoscopic, and pathological criteria, were recruited from one centre at Erasme Hospital, Brussels, Belgium. Thirty of these 50 patients had active disease (aCD), as defined by a Crohn’s disease activity index (CDAI)8 >150. They received either infliximab (5 mg/kg; n = 21)9 or intravenous corticosteroids (methylprednisolone 0.5 mg/kg; n = 9)10 according to standard recommendations. These 30 CD patients were prospectively followed for four weeks after treatment. Blood samples were drawn at baseline, and one and four weeks after treatment. Patients who were treated with infliximab received either a single infusion of infliximab (5 mg/kg) or the three dose regimen, with infusions on weeks 0, 2, and 6. All CD patients treated with infliximab went into clinical remission (CDAI <150) during the follow up period. Twenty of these 50 patients were in clinical remission (rCD), as defined by a CDAI <150. They had normal CRP levels and were not receiving immunosuppressive therapies. The clinical characteristics of these patients are shown in table 1 ▶. CD location (upper gastrointestinal tract, ileum, colon, and ileocolon) and behaviour (non-stricturing non-penetrating, stricturing, and penetrating) were assessed according to the Vienna classification (table 1 ▶).11
Table 1.
Clinical characteristics of Crohn’s disease (CD) patients
| CD patients in remission (rCD, n = 20) | CD patients on infliximab (aCD, n = 21) | CD patients on iv corticosteroids (aCD, n = 9) | |
| Male sex | 11 | 12 | 3 |
| Disease duration (y) | 9.7 (7.7) | 9.9 (7.7) | 6.6 (9.3) |
| Age (y) at diagnosis | 32.2 (14.3) | 26.5 (9.4) | 33.4 (12) |
| A1 | 15 | 18 | 7 |
| A2 | 5 | 3 | 2 |
| Disease location | |||
| Ileum only (L1) | 7 | 3 | 1 |
| Colon only (L2) | 5 | 9 | 5 |
| Ileum and colon (L3) | 7 | 5 | 3 |
| Upper GI (L4) | 1 | 4 | 0 |
| Disease type | |||
| Non-strict, non-penetr (B1) | 4 | 10 | 3 |
| Stricturing (B2) | 12 | 2 | 2 |
| Penetrating (B3) | 4 | 9 | 4 |
| EIM | 2 | 7 | 4 |
| Medications | |||
| 5-ASA | 14 | 9 | 6 |
| Prednisone | – | 8 | – |
| Methotrexate | – | 0 | 2 |
| Azathioprine | – | 12 | 1 |
| Budesonide | – | 7 | 1 |
| Infliximab | |||
| Indications (lum/fistul) | – | 15/6 | – |
| Schedule (1inf/3inf) | – | 6/15 | – |
| CRP (mg/dl) | 0.5 (0.1–0.5) | 4.275 (0.3–21.9) | 5 (0.8–47.9) |
rCD, Crohn’s disease in clinical remission; aCD, active Crohn’s disease; upper GI, upper gastrointestinal tract; EIM, extraintestinal manifestations; 5-ASA, 5 aminosalicylates; indications for infliximab (lum/fistul), luminal or fistulising disease; schedule of infliximab infusion (1 inf/3 inf), single or three dose regimen infusions; CRP, C reactive protein.
Twenty four patients suffering from ulcerative colitis (UC), diagnosed on the basis of clinical, radiological, endoscopic, and pathological criteria, were recruited from our centre, Erasme Hospital. The severity of the disease was assessed according to the criteria of Truelove-Witt.12,13 Thirteen patients had active disease while 11 patients were in clinical remission (no symptoms, normal CRP levels, and no immunosuppressive drugs). Clinical characteristics of the UC patients are shown in table 2 ▶.
Table 2.
Clinical characteristics of patients with ulcerative colitis (UC)
| UC in remission (n = 11) | Active UC (n = 13) | |
| Male sex | 9 | 5 |
| Age at diagnosis (y) | 30 (10.3) | 32.1 (11.1) |
| Disease duration (y) | 14.8 (17.9) | 9.1 (7.8) |
| Location | ||
| Rectitis | 1 | 0 |
| Rectosigmoiditis | 2 | 1 |
| Left colitis | 5 | 6 |
| Pancolitis | 3 | 6 |
| Medications | ||
| Aminosalicylates | 0 | 0 |
| Prednisone | – | 5 |
| Methotrexate | – | 1 |
| Azathioprine | – | 2 |
| Budesonide | – | 1 |
| CRP (mg/dl) | 0.16 (0.1–0.5) | 2.35 (0.13–13.95) |
CRP, C reactive protein.
Plasma was aliquoted and stored at −20°C until assay. CRP levels were measured automatically in the hospital’s laboratory, according to standard procedures. The study was carried out after approval of the ethics committee of Erasme Hospital.
Intestinal biopsies
Colonic biopsies were obtained from 15 CD patients from macroscopically and microscopically non-inflamed (n = 7) or inflamed (n = 8) mucosa during colonoscopy. The control group included eight patients without inflammatory bowel disease who underwent colonoscopy for irritable bowel syndrome or polyp/cancer screening. All controls were free of intestinal disease. All patients required colonoscopy for medical reasons and the protocol was approved by the ethics committee of Liège University Hospital and the ethics committee of Erasme Hospital.
Tissue culture
Biopsy specimens were obtained, transferred to the laboratory, and immediately handled within three hours of biopsy. They were gently washed three times in CMF-Hank’s medium (Gibco, Invitrogen, Merelbeke, Belgium) supplemented with antibiotics, blotted carefully, weighed, and individually placed in 24 well tissue culture plates in triplicate. Intestinal tissues were cultured in RPMI 1640 (Gibco) supplemented with 10% heat inactivated fetal calf serum, 2 mM L-glutamine, 100 U/ml penicillin, and 100 µg/ml streptomycin at 37°C in humidified 95% air/5% CO2, as previously described.14 After overnight culture, the supernatants were collected, centrifuged, and stored at −80°C until assay. Lactate dehydrogenase levels were also measured to assess the amount of tissue necrosis. Histological analyses were performed in parallel to demonstrate structural integrity.15
Immunoassays
TNF-α, sTNFRI, sTNFRII, IL-1β, sIL-1RII, IL-6, sIL-6R, and sgp130 were measured using quantitative sandwich enzyme immunoassays (Quantikine; R&D systems, Abingdon, UK). sIL-1RI was measured using a specific immunoassay (Duoset; R&D systems). The sensitivity of the assays was 15.6 pg/ml (TNF-α), 7.8 pg/ml (sTNFRI, sTNFRII), 3.9 pg/ml (IL-1β), 31.2 pg/ml (sIL-1RII, sIL-6R), 3.12 pg/ml (IL-6), 0.25 ng/ml (sgp130), and 62.5 pg/ml (sIL-1RI). Plasma samples were diluted before assay. Cytokine receptors and their ligands were measured according to the manufacturer’s recommendations. When measuring cytokine and sCR levels in the supernatant of colonic biopsy cultures, their concentrations were always corrected for tissue weight (concentrations are shown per ml of supernatant and per mg of tissue).
Statistical analysis
Data are expressed as median (min−max). sCR systemic levels were first compared between the three groups (healthy subjects, and rCD and aCD patients), using the Kruskal-Wallis test. The Mann-Whitney U test was then used for post-hoc analysis; p values were corrected for multiple comparisons. The results are shown as box plots. Correlations between parameters were performed using Spearman’s rank correlation coefficient. Comparison of sCR levels at baseline and one and four weeks after drug administration was performed by the Wilcoxon signed rank test. Analyses were realised using the SPSS 11.0 software.
RESULTS
Levels of soluble cytokine receptors and their ligands in healthy subjects and in aCD and rCD
To examine the influence of CD and its activity on systemic levels of sCRs, we compared levels of sCRs in aCD with those in rCD patients and healthy subjects.
Soluble TNFRI (1709 (552–4046) v 1087 (461–2500) v 922 (420–1645) pg/ml; p<0.05 and p<0.01, respectively) and sTNFRII (2353 (1760–6726) v 853 (413–1849) v 675 (371–1385) pg/ml; p<0.01 and p<0.01, respectively) levels were significantly higher in aCD patients than in rCD patients and healthy subjects (fig 1A ▶). In rCD patients, soluble TNFRI levels were similar to those of healthy subjects (NS, p = 0.537). However, levels of sTNFRII were significantly increased in rCD patients compared with those of healthy subjects (853 (413–1849) v 675 (371–1385) pg/ml; p<0.05). TNF-α was not detectable in the plasma of any subject or patient.
Figure 1.

Circulating soluble cytokine receptor levels in 15 healthy subjects (HS), 20 patients in Crohn’s disease remission (rCD), and 30 active Crohn’s disease patients (aCD). (A) Soluble tumour necrosis factor receptor I (sTNFRI) and receptor II (sTNFRII) levels. (B) Soluble interleukin 1 receptor I (sIL-1RI) and receptor II (sIL-1RII) levels. (C) Interleukin 6 (IL-6), soluble IL-6 receptor (sIL-6R), and sgp130 levels. aCD v HS: *p<0.05, **p<0.01; aCD v rCD: †p<0.05, ††p<0.01; rCD v HS: ‡p<0.05. Results are shown as box plots; the line within the box represents the median value with the outer limits of the box representing the 25th and 75th percentile values; whiskers above and below the box indicate the 90th and 10th percentile values. Statistical comparisons were performed using the Kruskal-Wallis test.
Interestingly, circulating levels of sIL-1RII were significantly decreased in rCD patients compared with those of healthy subjects (16007 (9855–25 507) v 20073 (14537–28 505) pg/ml; p<0.05). This decrease was even more pronounced in aCD (12516 (6270–23 996) pg/ml) compared with rCD (16007 (9855–25 507) pg/ml; p<0.05) and healthy subjects (20073 (14537–28 505); p<0.01) (fig 1B ▶). Conversely, sIL-1RI levels were higher in aCD patients (647 pg/ml (198–1485)) than in rCD (377 (63–1495); p<0.05) and not significantly different to those in healthy subjects (544 (73–2761) pg/ml; NS, p = 0.081) (fig 1B ▶). Circulating IL-1β was only detected in a few patients (data not shown) with no differences between groups.
Higher levels of IL-6 were observed in aCD patients (15.1 (0–69) pg/ml) than in rCD patients (2.6 (0–7) pg/ml; p<0.01) and healthy subjects (1.6 (0–4) pg/ml; p<0.01). Four aCD patients (4/30), six rCD patients (6/20), and six healthy subjects (6/15) had no detectable systemic levels of IL-6. Soluble IL-6R was significantly higher in aCD patients than in rCD patients (38 225 (30 527–56 236) v 28 956 (19 467–50 000) pg/ml; p<0.05) but this difference was not observed between aCD and healthy subjects (NS, p = 0.783). Interestingly, the level of the soluble form of the subunit gp130 was significantly lower in aCD patients than in healthy subjects and rCD (220 (138–310) v 273 (213–375) v 278 (229–449) ng/ml; p<0.01 and p<0.01, respectively) (fig 1C ▶). No differences were observed between circulating levels of IL-6, sIL-6R (28 956 (19 467–50 000) v 32 722 (20 604–50 000) pg/ml; NS, p = 0.36), and sgp130 (NS, p = 1) of rCD patients and healthy subjects.
Correlations between baseline levels of CRP, soluble cytokine receptors, and IL-6 in aCD, rCD, and healthy subjects
As sCR and IL-6 levels varied among the three study groups and they are considered major regulators of the APR, we attempted to determine whether their levels were associated with systemic inflammation, as defined by the CRP level. As expected, there was a strong association between IL-6 and CRP plasma levels (ρ = 0.548, p<0.001). Soluble TNFRI and sTNFRII levels also positively correlated with CRP levels (ρ = 0.606, p<0.001; ρ = 0.636, p<0.001, respectively). A weaker but significant correlation was also observed between sIL-1RI and CRP levels (ρ = 0.281, p = 0.031). No correlation was found between sIL-6R and CRP levels. A significant correlation between circulating levels of sIL-6R and CRP was observed only in aCD and rCD patients (ρ = 0.332, p = 0.028). Interestingly, sgp130 and sIL-1RII plasma levels negatively correlated with CRP levels (ρ = −0.365, p = 0.004; and ρ = −0.444, p<0.001, respectively) (fig 2A ▶, B). While a positive correlation was demonstrated between CDAI and CRP levels (ρ = 0.392, p<0.05), a negative correlation was observed between CDAI and sIL-1RII levels (ρ = −0.38, p<0.05). There was no correlation between CDAI and others sCRs.
Figure 2.
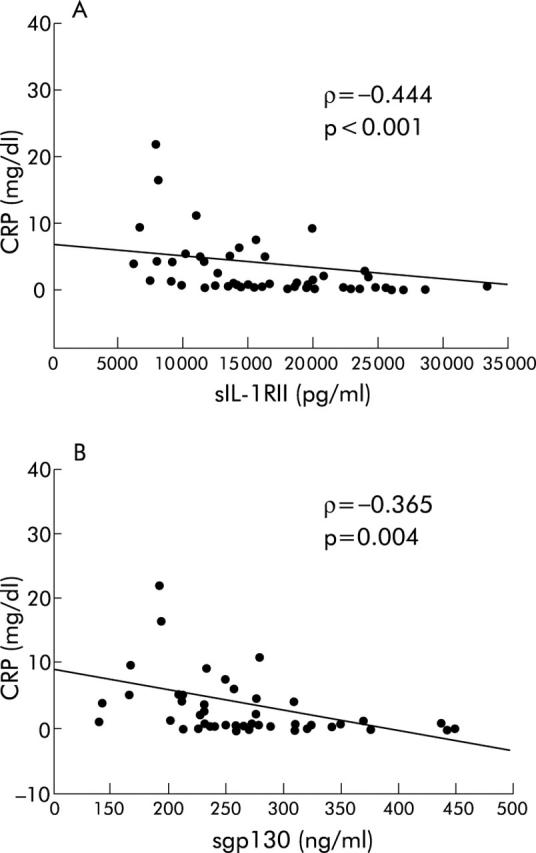
Correlations between soluble interleukin 1 receptor II (sIL-1RII), sgp130, and C reactive protein (CRP) levels in active Crohn’s disease patients before treatment (infliximab or corticosteroids), in Crohn’s disease patients in remission, and in healthy subjects. (A) sIL-1RII and CRP levels. (B) sgp130 and CRP levels. ρ, Spearman’s correlation coefficient; p, significance.
IL-6 is known to induce counterregulatory mechanisms in APR and to increase expression of sTNFRI and sTNFRII.16,17 In this study, a positive association between IL-6 levels and sTNFRI and sTNFRII levels was observed (ρ = 0.46, p<0.001 and ρ = 0.542, p<0.001, respectively). Finally, we found that IL-6 levels correlated negatively with those of sIL-1RII and sgp130 (ρ = −0.267, p = 0.031 and ρ = −0.327, p = 0.008).
Levels of soluble cytokine receptors and their ligands in healthy subjects, in active UC (aUC), and UC in clinical remission (rUC)
To determine whether the pattern of regulation of sCRs described above was specific to CD, we looked at production of sCRs in UC patients. Regulation of sTNFRI and sTNFRII was very similar to that in CD patients. sTNFRI (2046 (1006–4412) v 922 (420–1645) pg/ml; p<0.01) and sTNFRII (2373 (1298–4815) v 675 (371–1385) pg/ml; p<0.01) levels were significantly higher in aUC patients than in healthy subjects. Soluble TNFRII levels were also higher in aUC patients than in rUC patients (2373 (1298–4815) v 1250 (1021–2359) pg/ml; p<0.01). However, levels of sTNFRI were similar in both rUC and aUC patients (2184 (1547–3699) v 2046 (1006–4412) pg/ml; p = 1, respectively). There were positive correlations between CRP, sTNFRI, and sTNFRII levels (sTNFRI: ρ = 0.39, p<0.05 and sTNFRII: ρ = 0.468, p<0.01, respectively) and positive correlations between IL-6 and sTNFRs (sTNFRI: ρ = 0.537, p<0.01; sTNFRII: ρ = 0.627, p<0.01).
In patients with UC, whether active or in remission, there were no significant differences in circulating levels of sIL-1RI (533 (295–623) and 376 (261–569) v 523 (73–2761) pg/ml; p = 1 and p = 0.058, respectively) and sIL-1RII (19 888 (10 986–29 015) and 21 479 (13 734–41 708) v 19 944 (14 537–28 505) pg/ml; p = 1 and p = 1, respectively) compared with those observed in healthy subjects (fig 3 ▶). This is in contrast with what was demonstrated in CD. Indeed, there was no negative correlation between sIL-1RII and CRP levels in UC patients (ρ = −0.12, p = 0.467).
Figure 3.
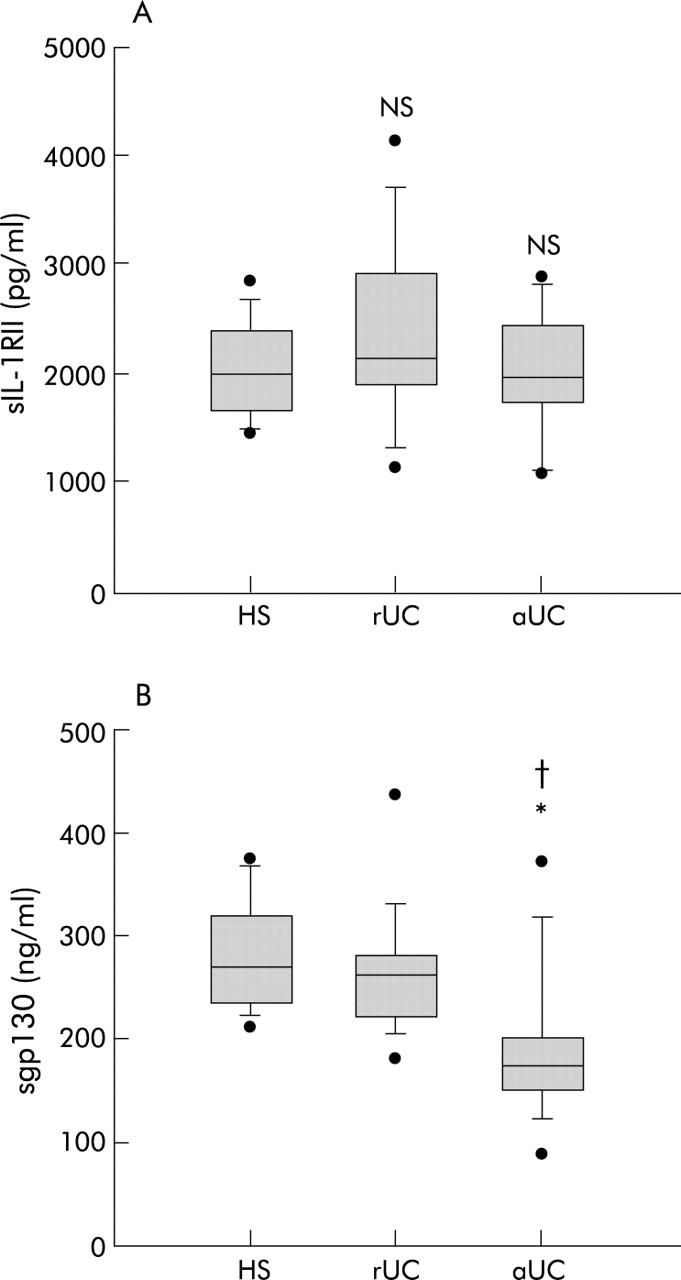
Circulating soluble interleukin 1 receptor II (sIL-1RII) (A) and sgp130 (B) levels in 15 healthy subjects (HS), in 11 patients with ulcerative colitis in clinical remission (rUC), and in 13 patients with active UC (aUC). aCD v HS: *p<0.05; aCD v rCD: †p<0.05. Results are shown as box plots; the line within the box represents the median value with the outer limits of the box representing the 25th and 75th percentile values; whiskers above and below the box indicate the 90th and 10th percentile values. Statistical comparisons were performed using the Kruskal-Wallis test.
Higher levels of IL-6 (20.62 (0–293.31) v 5.67 (0–12.42) v 1.6 (0–4) pg/ml; p<0.01 and p<0.01, respectively) and lower levels of sgp130 (176 (96–374) v 265 (182–437) v 273 (213–375) ng/ml; p<0.05 and p<0.05, respectively) were also observed in aUC patients compared with rUC patients or healthy subjects (fig 3 ▶). Interestingly, sgp130 levels seemed to be negatively correlated with CRP levels (ρ = −0.32, p<0.05), as reported in CD. No difference was observed in sIL-6R levels between the three groups (aUC: 36 710 (22 349–71 718) v healthy subjects: 32 722 (20 604–50 000) v rUC: 35 367 (20 877–59 313) pg/ml; p = 0.882 and p = 1, respectively).
Mucosal levels of sIL-1RII and sgp130 in Crohn’s disease
To examine if systemic dysregulation of the production of sIL-1RII and sgp130 in CD patients also occurred at the mucosal level, these two sCRs were measured in the supernatant of primary cultures of colonic biopsies from macroscopically and microscopically inflamed (CDinf) and non-inflamed (CDnon-inf) mucosa of CD patients. Levels were compared with those from colonic biopsies from normal mucosa (healthy colonic mucosa (HCM)). Soluble IL-1RII levels were lower in the supernatant of primary cultures of CDnon-inf (70 (41–129) v 172 (81–690) pg/ml×mg; p<0.05) and CDinf (56 (11–152) v 172 (81–690) pg/ml×mg; p<0.01) mucosa than in the supernatant of HCM. No significant difference was observed in the production of sIL-1RII by CDnon-inf and CDinf mucosa (fig 4 ▶). Interestingly, this lower production of sIL-1RII by CDinf mucosa was associated with higher levels of IL-1β than in HCM and CDnon-inf mucosa (186 (61–1508) v 4 (1–48) v 13 (2–68) pg/ml×mg; p<0.01 and p<0.01, respectively). However, there were no significant differences in sgp130 levels in the supernatant of primary cultures of CDnon-inf, CDinf, and HCM mucosa (76 (12–308) v 116 (36–163) v 143 (91–480) pg/ml×mg; p = 0.139 and p = 0.426, respectively) while higher levels of IL-6 were observed in the CDinf supernatant compared with the HCM and CDnon-inf supernatants (704 (148–3589) v 109 (11–270) v 117 (24–246) pg/ml×mg; p<0.01 and p<0.05, respectively) (fig 4 ▶).
Figure 4.

Interleukin 1β (IL-1β) (A), IL-6 (B), soluble interleukin 1 receptor II (sIL-1RII) (C), and sgp130 (D) levels in 18 hour culture media of colonic biopsies of healthy (HCM, n = 8), non-inflamed Crohn’s disease (CDnon-inf, n = 7), and inflamed Crohn’s disease mucosa (CDinf, n = 8). CDinf v HCM: **p<0.01; CDinf v CDnon-inf: †p<0.05, ††p<0.01; CDnon-inf v HCM: ‡p<0.05. Results are shown as box plots; the line within the box represents the median value with the outer limits of the box representing the 25th and 75th percentile values; whiskers above and below the box indicate the 90th and 10th percentile values. Statistical comparisons were performed using the Kruskal-Wallis test.
Effect of infliximab on sCRs in patients with active CD
We assessed the effect of infliximab on sCRs circulating levels in aCD patients. Infliximab induced clinical remission at four weeks (mean CDAI 268 (SEM 26) v 135 (17); p = 0.003) and a rapid decrease in CRP at one week (0.7 (0–8.8) v 4.3 (0.3–11.3) mg/dl; p<0.01) and four weeks (2.9 (0–11.16) mg/dl; p<0.05) (fig 5A ▶). Similarly, IL-6 plasma levels decreased significantly at one (6.2 (0–42) v 24.3 (3.8–69) pg/ml; p<0.05) and four weeks (4.5 (0–49.9) v 24.3 (3.8–69) pg/ml; p<0.05) (fig 5B ▶) after infliximab administration. Soluble TNFRII levels decreased slightly at one (1924.4 (594–7288) v 2570 (656–6726) pg/ml; p<0.05) and four weeks (2055 (509–6746) v 2570 (656–6726) pg/ml; p<0.05) (fig 5D ▶). Infliximab had no effect on sTNFRI levels. Soluble IL-1RI, sIL-1RII, and sgp130 levels were not altered by infliximab. Interestingly, infliximab induced an increase in sIL-6R at one week (41 220 (24 957–71 737) v 38 022 (22 188–56 236) pg/ml; p<0.05) before returning to pretreatment levels at four weeks (39 525.5 (26 554.7–51 747.1) v 38 022 (22 188–56 236) pg/ml; NS, p = 0.879) (fig 5C ▶).
Figure 5.

Plasma levels of C reactive protein (CRP) (A), interleukin 6 (IL-6) (B), soluble IL-6 receptor (sIL-6R) (C), and soluble tumour necrosis factor receptor II (sTNFRII) of Crohn’s disease patients with active disease after infliximab administration. Results are expressed as mean (SEM) and statistical comparisons were performed using the Wilcoxon signed rank test. *p<0.05, **p<0.01.
Effect of corticosteroids on sCRs in patients with active CD
In common with infliximab, corticosteroids induced a biological response with a decrease in CRP levels at one week (0.9 (0.1–7.5) v 3.1 (0.8–41.7) mg/dl; p<0.05) and four weeks (0.4 (0.1–1) v 3.1 (0.8–41.7) mg/dl; p<0.05) (fig 6A ▶). IL-6 plasma levels significantly decreased at one week (6.6 (0–26.2) v 26 (0–52.4) pg/ml; p<0.05) and slightly decreased at four weeks (6.5 (0–32.6) v 26 (0–52.4) pg/ml; NS, p = 0.062) after corticosteroid administration (fig 6B ▶). Corticosteroids had no significant effect on plasma levels of sTNFRI or sTNFRII. However, corticosteroids induced a significant increase in sIL-1RII at one week (13 120 (9156–15 096) to 17 348 (10 792–21 577) pg/ml; p<0.05) and of sIL-1RI at four weeks (664 (620–1256) to 772 (709–1396) pg/ml; p<0.05) (fig 6C, 6D ▶ ▶). Levels of sIL-6R and sgp130 were unchanged by corticosteroid administration.
Figure 6.

Plasma levels of C reactive protein (CRP) (A), interleukin 6 (IL-6) (B), soluble IL-1 receptor II (sIL-1RII) (C), and soluble IL-1 receptor I (sIL-1RI) (D) in nine Crohn’s disease patients with active disease after corticosteroid administration. Results are expressed as mean (SEM) and statistical comparisons were performed using the Wilcoxon signed rank test. *p<0.05.
DISCUSSION
The complex regulation of sCRs may bring further insight into the pathogenesis and course of Crohn’s disease. This present study conveys two new important messages. Firstly, plasma levels of the anti-inflammatory soluble type II IL-1 receptor (sIL-1RII) were significantly decreased in CD patients, whether in clinical remission or active disease. Deficient production of sIL-1RII appeared to be specific to CD as it was not observed in UC, and was further confirmed at the mucosal level. Secondly, plasma levels of the soluble form of the gp130 subunit (sgp130) were decreased in active CD patients. This decrease was not specific to CD as it was also demonstrated in UC patients with active disease, and appeared to be only systemic as it was not observed at the intestinal mucosa level.
Soluble IL-1RII represents a major counterregulatory mechanism of IL-1β. Importantly, a significant decrease in sIL-1RII was observed in rCD patients compared with healthy subjects, independent of systemic inflammation. This decrease was even more dramatic in active CD and negatively correlated with the magnitude of systemic inflammation, as reflected by CRP plasma levels. Soluble IL-1RII functions as an inhibitor of the IL-1β pathway either by capturing IL-1 and preventing its interaction with the “real” type I IL-1 receptor (IL-1RI) or by inhibiting the processing of the pro-IL-1β molecule and the formation of the active cytokine.18 This deficit in a major counterregulatory mechanism of IL-1β may play a role in the pathogenesis of CD. Importantly, corticosteroids significantly increased sIL-1RII levels in active CD patients. Inhibition of IL-1β activity due to increasing levels of sIL-1RII may constitute a mechanism of action by which corticosteroids induce clinical remission in CD. If true, this would be in contrast with the effect observed with infliximab, which did not change sIL-1RII levels in aCD patients although it did trigger resolution of the inflammatory process, as demonstrated by the decrease in CRP and IL-6 levels. The regulation of sIL-1RII contrasted with the regulation of sIL-1RI which increased in active CD compared with rCD, as previously reported in endotoxaemia.19 Soluble IL-1RI has been reported to enhance IL-1β activity through a phenomenon called “reverse signalling” in which non-specific membrane fixed IL-1 triggers activation of the AcP subunit and intracellular transduction by binding to sIL-1RI.20,21 Thus regulation of sIL-1 receptors in CD and induction of sIL-1RII by corticosteroids may underscore the influence of sIL-1 receptors on the course of the disease.
The soluble form of gp130 acts as a potent antagonist of the complex sIL-6R/IL-6 by preventing this complex from signalling via membrane bound gp130.22 Its dramatic decrease in active CD and its negative correlation with CRP levels, together with high concentrations of IL-6 and sIL-6R, as previously shown,23,24 highlighted the deficient inhibitory regulatory effect of sgp130 on the sIL-6R/IL-6 complex. Importantly, the sIL-6R/IL-6 complex prevents apoptosis of lamina propria T cells by inducing expression of the antiapoptotic genes bcl-2 and bcl-x1, which explains T cell resistance to apoptosis in CD.25 Thus sgp130 deficiency could result in stronger activation of the IL-6 transduction pathway and may be essential for CD activity. In line with this hypothesis, Atreya and colleagues25 demonstrated that administration of a gp130-Fc fusion protein induced suppression of colitis activity in an experimental model of murine colitis. Absence of regulation of sgp130 by infliximab and corticosteroids suggests that these therapies act on IL-6 signalling, mostly by decreasing IL-6 plasma concentrations. Surprisingly, infliximab induced a significant increase in sIL-6R at one week. Soluble IL-6R enhances IL-6 activity by activating gp130+ cells (trans-signalling phenomenon), and increases the circulating half life of IL-6.26 Both IL-1 and IL-6 decrease IL-6R mRNA expression in lipopolysaccharide activated monocytes.27 Similarly, TNF-α diminishes the interferon γ induced increase in IL-6R in human monocytes.28 Therefore, the decrease in IL-6 or specific neutralisation of TNF-α could explain the infliximab mediated increase in sIL-6R observed here, in aCD patients. The therapeutic advantage of this upregulation remains to be explored.
Soluble TNFRs act as inhibitors of TNF-α activity and represent a natural protective mechanism against the toxic effects of TNF-α,29 mostly by preventing the interaction of TNF-α with their membrane bound receptors.30,31 Both sTNFRs (I: p55 and II: p75) levels were increased in active CD patients and were significantly correlated with CRP levels.32–34 TNF-α was not detectable in the plasma of our CD patients. Detection of soluble TNF-α in the plasma of aCD patients appears highly variable; some studies demonstrated a systemic increase35,36 while others did not.37 This discrepancy could be explained by the different immunoassays used and their sensitivity. Interestingly, this circulating TNF-α seems to be biologically inactive, as shown by bioassays,37 and may be neutralised by sTNFRs. Infliximab decreased plasma levels of sTNFRII, underscoring the important role of TNF-α as a potent inducer of sTNFRII expression in vitro and in vivo.38 The observation that sTNFRI was poorly regulated by infliximab emphasises the different regulation of expression of the two soluble receptors in vivo.39,40 Thus regulation of sTNFRs did not seem to be beneficial to CD treatment as both corticosteroids and infliximab did not appear to enhance their production as patients went into disease remission.
Overall, corticosteroids and infliximab demonstrated very different effects on sCRs. Unfortunately, the role of concomitant therapies such as azathioprine, methotrexate, and budesonide could not be assessed because of the small size of the treatment groups.
In conclusion, active CD is associated with dysregulation of sCRs production and, especially, with a decrease in systemic and mucosal levels of the anti-inflammatory sIL-1RII and in systemic levels of sgp130. Our findings suggest that these decreases might be essential to the pathogenesis and course of CD. Furthermore, a striking finding was the specific regulation of sIL-1RII in CD compared with UC. This indicates that common generic signalling pathways of inflammation can be specifically dysregulated in CD or UC. Thus targeting common biological pathways may not always be appropriate to treat both diseases. This study suggests that the use of a sIL-1RII fusion protein in CD could represent a future alternative therapeutic strategy for CD patients.
Acknowledgments
This work was supported by the National Fund for Scientific Research (FNRS). T Gustot is a research fellow of the FNRS. D Franchimont is a qualified researcher of the FNRS. We thank Nathalie Schoofs, Axel Hittelet, and Felicien Dinu for the biopsy specimens.
Abbreviations
sCRs, soluble cytokine receptors
CD, Crohn’s disease
aCD, active CD
rCD, clinical remission of CD
CDinf, inflamed mucosa of CD patients
CDnon-inf, non-inflamed mucosa of CD patients
HCM, healthy colonic mucosa
CDAI, Crohn’s disease activity index
TNF-α, tumour necrosis factor α
sTNFRI, soluble TNF receptor I
sTNFRII, soluble TNF receptor II
IL-1β, interleukin 1β
sIL-1RI, soluble IL-1 receptor I
sIL-1RII, soluble IL-1 receptor II
IL-6, interleukin 6
sIL-6R, soluble IL-6 receptor
APR, acute phase response
CRP, C reactive protein
UC, ulcerative colitis
aUC, active UC
rUC, UC in clinical remission
Conflict of interest: None declared.
REFERENCES
- 1.Miyajima A, Kitamura T, Harada N, et al. Cytokine receptors and signal transduction. Annu Rev Immunol 1992;10:295–331. [DOI] [PubMed] [Google Scholar]
- 2.Fernandez-Botran R, Chilton K, Ma Y. Soluble cytokine receptors: their roles in immunoregulation, disease and therapy. Adv Immunol 1996;63:269–336. [DOI] [PubMed] [Google Scholar]
- 3.Mackiewicz A, Wiznerowicz M, Roeb E, et al. Soluble interleukin-6 receptor is biogically active in vivo. Cytokine 1995;7:142–9. [DOI] [PubMed] [Google Scholar]
- 4.Narazaki M, Yasukawa K, Saito T, et al. Soluble forms of the interleukin-6 signal-transducing receptor component gp130 in human serum possessing a potential to inhibit signals through membrane-anchored gp130. Blood 1993;82:1120–6. [PubMed] [Google Scholar]
- 5.Cario E, Podolsky DK. Differential alteration in intestinal epithelial cell expression of Toll-like receptor 3 (TLR3) and TLR4 in inflammatory bowel disease. Infect Immun 2000;68:7010–17. [DOI] [PMC free article] [PubMed] [Google Scholar]
- 6.Allison MC, Poulter LW. Changes in phenotypically distinct mucosal macrophage populations may be prerequisite for the development of inflammatory bowel disease. Clin Exp Immunol 1991;85:504–9. [DOI] [PMC free article] [PubMed] [Google Scholar]
- 7.Baumann H, Gauldie J. The acute phase response. Immunol Today 1994;15:74–80. [DOI] [PubMed] [Google Scholar]
- 8.Best W, Becktel JM, Singleton JW. Rederived values of the eight coefficients of the CDAI. Gastroenterology 1979;77:843–6. [PubMed] [Google Scholar]
- 9.Sandborn WJ, Hanauer SB. Infiximab in the treatment of Crohn’s disease: a user’s guide for clinicians. Am J Gastroenterol 2002;97:2962–72. [DOI] [PubMed] [Google Scholar]
- 10.Hanauer SB. Inflammatory bowel disease. N Engl J Med 1996;334:841–8. [DOI] [PubMed] [Google Scholar]
- 11.Gasche C, Scholmerich J, Brynskov J, et al. A simple classification of Crohn’s disease: report of the World Party for the World Congresses of Gastroenterology, Vienna 1998. Inflamm Bowel Dis 2000;6:8–15. [DOI] [PubMed] [Google Scholar]
- 12.Truelove SC, Witts LJ. Cortisone in ulcerative colitis: final report on a therapeutic trial. Br Med J 1955;2:1041–8. [DOI] [PMC free article] [PubMed] [Google Scholar]
- 13.Edwards FC, Truelove SC. The course and prognosis of ulcerative colitis. Gut 1963;4:299–315. [DOI] [PMC free article] [PubMed] [Google Scholar]
- 14.Reimund JM, Wittersheim C, Dumont S, et al. Increased production of tumor necrosis factor-α, interleukin-1β, and interleukin-6 by morphologically normal intestinal biopsies from patients with Crohn’s disease. Gut 1996;39:684–9. [DOI] [PMC free article] [PubMed] [Google Scholar]
- 15.Wardle TD, Hall L, Turnberg LA. Use of coculture of colonic biopsies to investigate the release of eicosamoids by inflamed and uninflamed mucosa from patients with inflammatory bowel disease. Gut 1992;33:1644–51. [DOI] [PMC free article] [PubMed] [Google Scholar]
- 16.Tilg H, Trehu E, Atkins MB, et al. Interleukin-6 (IL-6) as an anti-inflammatory cytokine: induction of circulating IL-1 receptor antagonist and soluble tumor necrosis factor receptor p55. Blood 1994;83:113–18. [PubMed] [Google Scholar]
- 17.Tilg H, Dinarello CA, Meir JW. IL-6 and APPs: anti-inflammatory and immunosuppressive mediators. Immunol Today 1997;18:428–32. [DOI] [PubMed] [Google Scholar]
- 18.Symons JA, Young PR, Duff GW. Soluble type II interleukin-1 (IL-1) recetor binds and blocks processing of IL-1β precursor and loses affinity IL-1 receptor antagonist. Proc Natl Acad Sci USA 1995;92:1714–18. [DOI] [PMC free article] [PubMed] [Google Scholar]
- 19.Arend WP. Inhibiting the effects of cytokines in human diseases. Adv Intern Med 1995;40:365–94. [PubMed] [Google Scholar]
- 20.Spörri B, Bickel M, Dobbelaere D, et al. Soluble interleukin-1 receptor-reverse signaling in innate immunoregulation. Cytokine Growth Factor Rev 2001;12:27–32. [DOI] [PubMed] [Google Scholar]
- 21.Svenson M, Hansen MB, Heegaard P, et al. Specific binding of interleukin-1 (IL-1) (and IL-1 receptor antagonist (IL-1ra)) to human serum. High-affinity binding of IL-1ra to soluble IL-1 receptor type I. Cytokine 1993;5:427–35. [DOI] [PubMed] [Google Scholar]
- 22.Narazaki M, Yasukawa K, Saito T, et al. Soluble forms of the interleukin-6 signal-transducing receptor component gp130 in human serum possessing a potential to inhibit signals through membrane-anchored gp130. Blood 1993;82:1120–6. [PubMed] [Google Scholar]
- 23.Mitsuyama K, Toyonaga A, Sasaki E, et al. Soluble interleukin-6 receptors in inflammatory bowel disease: relation to circulating interleukin-6. Gut 1995;36:45–9. [DOI] [PMC free article] [PubMed] [Google Scholar]
- 24.Louis E, Belaiche J, Van Kenseke C, et al. A high serum concentration of interleukin-6 is predictive of relapse in quiescent Crohn’s disease. Eur J Gastroenterol Hepatol 1997;9:939–44. [DOI] [PubMed] [Google Scholar]
- 25.Atreya R, Mudter J, Finotto S, et al. Blockade of interleukin 6 trans signaling suppresses T-cell resistance against apoptosis in chronic intestinal inflammation: Evidence in Crohn disease and experimental colitis in vivo. Nature Med 2000;6:583–8. [DOI] [PubMed] [Google Scholar]
- 26.Schöbitz B, Pezeshki G, Pohl T, et al. Soluble interleukin-6 receptor augments central effects of Il-6 in vivo. FASEB J 1995;9:659–64. [DOI] [PubMed] [Google Scholar]
- 27.Bauer J, Martin Bauer T, Kalb T, et al. Regulation of interleukin-6 receptor expression in human monocytes and monocyte-derived macrophages. Comparison with the expression of human hepatocytes. J Exp Med 1989;170:1537. [DOI] [PMC free article] [PubMed] [Google Scholar]
- 28.Sanceau J, Wijdenes J, Revel M, et al. IL-6 and IL-6 receptor modulation by IFNγ and tumor necrosis factor-α in human monocytic cell line (THP-1). J Immunol 1991;147:2630–7. [PubMed] [Google Scholar]
- 29.Dayer JM, Burger D. Interleukin-1, tumor necrosis factor and their specific inhibitors. Eur Cytokine Netw 1994;5:563–71. [PubMed] [Google Scholar]
- 30.Bazzoni F, Beutler B. The tumor necrosis factor ligand and receptor families. N Engl J Med 1996;334:1717–25. [DOI] [PubMed] [Google Scholar]
- 31.Van Zee KJ, Kohno T, Fischer E, et al. Tumor necrosis factor soluble receptors circulate during experimental and clinical inflammation and can protect against excessive tumor necrosis factor (in vitro and in vivo). Proc Natl Acad Sci USA 1992;89:4845–9. [DOI] [PMC free article] [PubMed] [Google Scholar]
- 32.Gardiner KR, Halliday MI, Barclay GR, et al. Significance of systemic endotoxemia in inflammatory bowel disease. Gut 1995;36:897–901. [DOI] [PMC free article] [PubMed] [Google Scholar]
- 33.Hudson M, Gallati H, Ryff JC, et al. Serum TNF receptors p55 and p75 in Crohn’s disease. Gastroenterology 1993;104 (suppl) :A715. [Google Scholar]
- 34.Noguchi M, Hiwatashi N, Liu Z, et al. Secretion imbalance between tumor necrosis factor and its inhibitor in inflammatory bowel disease. Gut 1998;43:203–9. [DOI] [PMC free article] [PubMed] [Google Scholar]
- 35.Martinez-Borra J, Lopez-Larrea C, Gonzalez S, et al. High serum tumor necrosis factor-α are associated with lack of response to infliximab in fistulizing Crohn’s disease. Am J Gastroenterol 2002;97:2350–6. [DOI] [PubMed] [Google Scholar]
- 36.Murch SH, Lamkin VA, Savage MO, et al. Serum concentrations of tumor necrosis factor alpha in childhood chronic inflammatory bowel disease. Gut 1991;32:913–17. [DOI] [PMC free article] [PubMed] [Google Scholar]
- 37.Hyans JS, Treem WR, Eddy E, et al. Tumor necrosis factor-alpha is not elevated in children with inflammatory bowel disease. J Pediatr Gastroenterol Nutr 1991;12:233–6. [DOI] [PubMed] [Google Scholar]
- 38.Lantz M, Malik S, Selvin ML, et al. Infusion of tumor necrosis factor (TNF) causes an increase in circulating TNF-binding protein in human. Cytokine 1990;2:402. [DOI] [PubMed] [Google Scholar]
- 39.Cope AP, Aderka D, Wallach D, et al. Soluble TNF receptor production by activated T lymphocytes: differential effects of acute and chronic exposure to TNF. Immunology 1995;84:21–30. [PMC free article] [PubMed] [Google Scholar]
- 40.Leeuwenberg JF, Dentener MA, Buurman WA. Lipopolysaccharide LPS-mediated soluble TNF receptor release and TNF receptor expression by monocytes. J Immunol 1994;152:5070–6. [PubMed] [Google Scholar]