

Abstract
Background: Overexpression of vascular endothelial growth factor (VEGF) correlates with vascularity, metastasis, and proliferation in colorectal cancer but the role of its homologue, placenta growth factor (PlGF), is unknown. The aim of this study was to evaluate expression and clinical implications of PlGF in colorectal cancer.
Methods: We investigated 74 tumour/non-tumour pairs of colorectal cryosections. Clinical staging was based on the UICC-TNM classification. Expression levels of mRNA for PlGF and VEGF were analysed with quantitative real time reverse transcription-polymerase chain reaction. Proteins were analysed by immunohistochemical staining and enzyme linked immunoabsorbant assay. Analysis of the differences in PlGF and VEGF levels between tumour and non-tumour tissues in the same patient were performed by paired t test; differences between localised and advanced disease patients by the Mann-Whitney, χ2, and Fisher’s exact tests and survival curves by the Kaplan-Meier method.
Results: Expression levels for both growth factors were significantly higher in tumour than in non-tumour tissues (p⩽0.001). The ratio of PlGF expression in tumour to non-tumour in the advanced disease group was significantly higher than for the localised disease group (p = 0.009). Patients with more tumour PlGF mRNA had shorter survival (p = 0.028). The majority of PlGF was expressed in tumour cells.
Conclusions: Our results suggest that PlGF expression correlates with disease progression and patient survival and may be used as a prognostic indicator for colorectal cancer.
Keywords: colon cancer, placenta growth factor, vascular endothelial growth factor
Angiogenesis, the process of new blood vessel formation, is a critical step in tumour growth and progression and is regulated by tumour cell derived growth factors that act specifically on vascular endothelial cells.1 It has been shown that rapid exponential growth of tumours does not begin until neovascularisation occurs. Many angiogenic factors have been identified that regulate angiogenesis in colon cancer. Vascular endothelial growth factor (VEGF) has been shown to be upregulated in the progression from non-metastatic to metastatic colon cancers.2–7 Shiraishi et al showed that levels of VEGF were highest in carcinomas followed by those in adenomas, with the lowest in non-neoplastic mucosa.3 Takahashi et al demonstrated that expression levels of VEGF and vessel counts in primary metastatic tumours were higher than those in non-metastatic neoplasms and these two factors directly correlated with the extent of neovascularisation and degree of proliferation.5 Furthermore, high levels of VEGF expression and elevated vessel counts were found to correlate with recurrence and metastasis of colon cancer, suggesting that VEGF expression could serve as an indicator of colorectal cancer prognosis. However, most studies showed that VEGF expression is not a good predictor of prognosis.4,8,9
Placenta growth factor (PlGF), a dimeric glycoprotein with 53% homology to VEGF,10,11 binds to VEGF receptor 1, but not to VEGF receptor 2, and may function by modulating VEGF activity.12 Exogenous PlGF stimulates angiogenesis and induces vascular permeability when coinjected with VEGF.13,14 The angiogenic activity of PlGF may be initiated by displacement of VEGF from the VEGF receptor 1 sink, thus increasing the VEGF available for activation of VEGF receptor 2.13,15 Absence of PlGF had a negligible effect on vascular development and normal embryogenesis, as demonstrated in PlGF knockout mice, but such a deficiency could reduce collateral vascular growth under pathological conditions, such as ischaemia, inflammation, and cancer.15
PlGF expression has been reported in hypervascular renal cell carcinomas and in some thyroid and germ cell tumours.16 Donnini et al demonstrated that PlGF was highly upregulated in a subset of human meningiomas.17 Recently, Adini et al found that overexpression of PlGF leads to tumour growth as well as vascular formation, induces expression of survival genes, and inhibits apoptosis in vitro. They proposed that PlGF contributes to tumour angiogenesis by providing functions needed for endothelial cell survival.18 However, the correlations between PlGF, angiogenesis, metastasis, and prognosis in colon cancer are not clear. The goal of our study was to evaluate correlations among these factors.
MATERIALS AND METHODS
Materials
Seventy four tumour and non-tumour pairs of colorectal cryosections were included from samples collected from September 2000 to June 2003, following the rules set forth by the ethics committee of the National Taiwan University Hospital. All tissues were freshly frozen or immersed in OCT, and kept at −80°C until use. Expression levels of PlGF or VEGF were analysed by quantitative reverse transcription-polymerase chain reaction (RT-PCR) and the ratio of expression levels in the tumour tissue to those in non-tumour tissue was calculated. Clinical staging of cancers was determined based on the UICC-TNM classification. All patients received identical treatment programmes in this study. No preoperation chemotherapy or radiotherapy had been given while stage III and IV patients were subjected to postoperative chemotherapy with 5-fluorouracil and leucovorin. Stages I and II were collectively termed as the localised disease group and stages III and IV as the advanced disease group in this study. Follow up duration was defined as the period between the operation date and day of the last visit, according to the patient’s chart.
Quantitative RT-PCR
Total RNA was isolated using an RNA extraction kit (Qiagen Inc., California, USA) from tissue homogenised with Trizol (Invitrogen Inc., Carlsbad, California, USA), according to the manufacturer’s instructions. For confirming expression levels of PlGF in tumour tissue, cells were collected from 15 stage III/IV patients by laser capture microdissection (LCM), as previously reported.19 Briefly, 5 mm sections tissue were mounted on silicon coated slides. Slides were cleared in xylene and dehydrated in graded alcohols. After staining with haematoxylin-eosin, LCM using a PixCell I system (Arcturus Engineering, Mountain View, California, USA) was used to separate tumours and normal cells. LCM parameters included a laser power of 90 mW, laser pulse duration of 1.2 ms, and laser spot size of 7.5–15 μm in diameter. A cap devised by Arcturus Engineering was used for the transfer film. RNA was extracted and isolated using the PicoPure RNA Isolation kit (Arcturus Engineering) according to the manufacturer’s instructions.
Primers and probes were designed using the Primer Express program (Perkin-Elmer Applied Biosystems, California, USA) and purchased from the same vendor. The primers used, based on the cDNA sequence of PlGF, were as follows: forward primer 5′-GCG ATG AGA ATC TGC ACT GTG T-3′; reverse primer 5′-TCC CCA GAA CGG ATC TTT AGG-3′. The sequence of the probe used to detect and quantify the RT-PCR product was 5′-AGA CGG CCA ATG TCA CCA TGC AGC-3′. The primers and probe used for VEGF mRNA were as follows: forward primer 5′-TAC CTC CAC CAT GCC AAG TG -3′; reverse primer 5′-GAT GAT TCT GCC CTC CTC CTT-3′; probe 5′-TCC CAG GCT GCA CCC ATG GC-3′. The primers and probe used for the GAPDH (internal control) mRNA were as follows: forward primer 5′-GAA GGT GAA GGT CGG AGT -3′; reverse primer 5′-GAA GAT GGT GAT GGG ATT TC-3′; probe 5′-CAA GCT TCC CGT TCT CAG CC- 3′.
Samples to produce the standard curve for real time RT-PCR were prepared by serial dilution of a specific RNA sample to cover the range 100 ng to 0.1 ng. Aliquots of the serially diluted samples were saved and stored at −80°C until use. Expression levels of the target gene were measured using quantitative real time RT-PCR in the ABI Prism 7700 Sequence Detection System (Applied Biosystems) following the manufacturer’s protocol. The amplification mixture (25 µl) contained 10 ng of sample RNA (5 µl), 2× Master Mix without UNG (12.5 µl), 40× MultiScribe and RNase inhibitor mix (0.625 µl), 9 µM forward and reverse primers (5 µl), and 2 µM probe (2.5 µl) (Perkin-Elmer Applied Biosystems). Thermal cycling parameters were as follows: one cycle of 30 minutes at 48°C, one cycle of 10 minutes at 95°C for deactivation, and 40 cycles at 95°C for 15 seconds and at 60°C for one minute for the melting, annealing, and extending phases of the PCR reaction, respectively. Each assay included standard curve samples in duplicate, a no template control, and approximately 10 ng of sample total RNA in triplicate. Any sample with a coefficient of variation above 10% was retested. Fluorescence emitted by the reporter dye (FAM-6-carboxy-fluorescein, fluorescence emission peak at 518 nm) was detected online in real time with the ABI Prism 7700 Sequence Detection System. Threshold cycle (CT) is the fractional cycle number at which the fluorescence generated by cleavage of the probe exceeds a fixed level above baseline. For a chosen threshold, a smaller starting copy number results in a higher CT value. In this study, we chose GAPDH mRNA as an internal control. The relative amount of tissue PlGF mRNA, standardised against the amount of GAPDH mRNA, was expressed as –ΔCT = – [CT(PlGF) – CT(GAPDH)]. The ratio of the number of PlGF mRNA copies to the number of GAPDH mRNA copies was then calculated as 2−ΔCT ×K, where K is a constant.
Immunohistochemical staining
Serial sections of frozen colon tissues were mounted on poly-L-lysine coated slides and allowed to dry for 30 minutes before fixation in 100% acetone for 15 minutes. Tissue sections were washed for five minutes, three times, in phosphate buffered saline (PBS), immersed in 2% H2O2 in methanol for 25 minutes to inactivate endogenous peroxidase, and blocked with 1% bovine serum albumin. Blocked sections were incubated with antibodies against PlGF, VEGF, or Flt-1 (Santa Cruz Biotechnology, Inc., Heidelberg, Germany) at dilutions of 1:25, 1:50, and 1:25, respectively, for two hours at room temperature, washed with PBS, reacted with biotinylated secondary antibody with antigoat antibody (dilution of 1:500; Santa Cruz Biotechnology, Inc.) for PlGF, and antirabbit antibody (dilution of 1:500; Vector Laboratories Inc, Burlingame, California, USA) for VEGF and Flt-1 for one hour, followed by incubation with streptavidin conjugated horseradish peroxidase (peroxidase substrate kit, DAB; Vector Laboratories Inc.) which was used to reveal localisation of the antibodies, and tissues were counterstained with Mayer’s haematoxylin.
ELISA (enzyme linked immunoabsorbant assay)
Protein lysate from each specimen was prepared using 10 mg tissue cut into tiny pieces, suspended in cell lysis buffer (0.15 M Nacl; 0.1 M Tris, pH 8.0; 1 mM EDTA, pH 8.0; 1 mM PMSF) and mechanically homogenised with a polytron PT 3000 (30 000 rpm for one minute). Protein lysate was kept at −80°C until use. Concentrations of PlGF in tumour and non-tumour tissues were quantified using a “Quantikine” human PlGF immunoassay (R&D Systems, Inc., Minneapolis, Minnesota, USA). Diluted protein lysate was incubated in triplicates overnight at 4°C on microtitre plates coated with a murine monoclonal antibody against human PlGF. Unbound proteins were washed off, and an enzyme linked polyclonal antibody specific for PlGF was added to “sandwich” the PlGF immobilised during the first incubation. A substrate solution for horseradish peroxidase was added, and colour developed in proportion to the amount of antibody bound PlGF. Absorbance of the colour was read at 450 nm. A standard curve, consisting of known amounts of PlGF, was carried through the above procedure, and concentrations of PlGF in the unknown samples were determined from this standard curve. Concentrations of PlGF were expressed as pg/mg of protein.
Data analysis
Differences in PlGF and VEGF mRNA levels, and PlGF protein levels between tumour and non-tumour tissues in the same patient were analysed using a paired t test while differences between localised disease and advanced disease patients were analysed using the Mann-Whitney, χ2, and Fisher’s exact tests. Correlations between PlGF or VEGF expression levels and clinical stages, and PlGF expression levels between mRNA and protein, were analysed by Spearman’s correlation coefficient. A survival curve was obtained using the Kaplan-Meier method. Differences in cancer specific survival time for patients with tumours with high or low expression levels of PlGF or VEGF were analysed using the Breslow test.
RESULTS
Basic data
A total of 74 colorectal cancer patients, 39 males and 35 females, were included in the study (table 1 ▶). There were 14 rectal cancers and 60 colon cancers. However, there were no significant differences in PlGF, VEGF expression level (either tumour tissue or tumour to non-tumour ratio), age, sex, or cancer specific survival between the rectal and colon cancer groups. Age at first diagnosis ranged from 26 to 94 years (mean 68.4). Follow up for these 74 patients ranged from 1 to 47 months (mean 26.0). During follow up, 14 patients died of colorectal cancer. According to the UICC-TNM classification, there were 14 stage I patients, 27 stage II patients, 22 stage III patients, and 11 stage IV patients. Among these patients, there were three with synchronous colorectal cancers and six with metachronous colorectal cancers.
Table 1.
Summary of the demographic data, placenta growth factor (PlGF), vascular endothelial growth factor (VEGF) mRNA expression, and survival
| Localised disease | Advanced disease | Total (n = 74) | p Value¶ | |||
| Stage I (n = 14) | Stage II (n = 27) | Stage III (n = 22) | Stage IV (n = 11) | |||
| Sex | 0.222 | |||||
| Male | 6 | 13 | 13 | 7 | 39 | |
| Female | 8 | 14 | 9 | 4 | 35 | |
| Age (y)† | 74.9 (3.0) | 68.8 (3.1) | 69.6 (2.6) | 62.2 (4.9) | 69.2 (1.7) | 0.181 |
| Follow up period (month)† | 24.6 (2.4) | 29.6 (2.1) | 25.4 (2.7) | 20.1 (4.5) | 26.0 (1.4) | 0.150 |
| Survival‡* | 0.001 | |||||
| Yes | 14 | 24 | 18 | 4 | 60 | |
| No | 0 | 3 | 4 | 7 | 14 | |
| −ΔCT of PlGF | ||||||
| T* | 0.19 (0.32) | 1.11 (0.42) | 0.013 | |||
| T/NT ratio* | 0.42 (0.31) | 1.66 (0.30) | 0.009 | |||
| −ΔCT of VEGF | ||||||
| T | 0.65 (0.23) | 0.91 (0.30) | 0.418 | |||
| T/NT ratio | 0.62 (0.28) | 1.07 (0.35) | 0.302 | |||
| PlGF ⩾median§ | 5 | 12 | 12 | 9 | 38 | |
| Survival* | ||||||
| Yes | 28 | |||||
| No | 10 | |||||
| PlGF <median§ | 9 | 15 | 10 | 2 | 36 | |
| Survival* | ||||||
| Yes | 32 | |||||
| No | 4 | |||||
†Age and follow up period are presented as means (SEM).
‡Differences in survival among different stages was statistically significant.
§Survival between PlGF ⩾ median and PlGF <median was statistically significant with p = 0.028 by the χ2 test.
¶Comparison of localised and advanced disease groups. Sex and survival were analysed using the χ2 method and Fisher’s exact test; age, follow up period, −ΔCT of PlGF, and −ΔCT of VEGF were analysed using the Mann-Whitney test.
*p<0.05.
Both PlGF and VEGF mRNA expression were upregulated in colorectal cancer and the extent of upregulation correlated with disease progression
Expression levels of PlGF and VEGF in tumour tissues were higher than in non-tumour tissues (p<0.001 and p = 0.001, respectively). In addition, in 15 patients, RNA extracted from tumour cells collected by LCM also confirmed the finding that expression levels of PlGF in tumour cells were higher than in non-tumour cells. Mean (SEM) −ΔCT for tumour tissue was −3.22 (0.35) compared with −0.25 (0.23) for non-tumour tissue (p<0.001). Tumour to non-tumour ratios for PlGF and VEGF levels were much higher for the three synchronous cancer patients than for the mean of all of the other patients (p<0.001, for both factors). In contrast, the difference in ratios between metachronous patients and all patients was not significant. Expression levels of PlGF in colon cancer tumour tissues increased gradually from stages I to IV, with −ΔCT mean values for each stage of −0.40, 0.50, 0.77, and 1.79, respectively. Expression levels of VEGF in colon cancer tumour tissues increased gradually from stages II to IV, with mean values for each stage (−ΔCT) of 0.54, 0.73, and 1.28, respectively. Tumour to non-tumour ratios for PlGF and VEGF also increased gradually from stages I to III (fig 1A ▶, B). Considering the relationship between histological type and PlGF and VEGF expression, all 74 tumours were reviewed and classified. There were seven poorly differentiated, two well differentiated, and 65 moderately differentiated tumours and there were no statistically significant differences in PlGF or VEGF expression among these three groups.
Figure 1.

Distribution of ratios between expression levels in tumour tissues and expression levels in non-tumour tissues in different stages of colorectal cancer. Placenta growth factor (PlGF) (A) and vascular endothelial growth factor (VEGF) (B) ratios are presented here as 2X, where X = (−ΔCT of tumour) − (−ΔCT of non-tumour). (C) Correlation between ratios of expression levels in tumour tissues and expression levels in non-tumour tissues. Ratios of VEGF levels from different patients versus ratios of PlGF levels from the respective patients. PlGF and VEGF ratio are presented as 2X, where X = (−ΔCT of tumour) − (−ΔCT of non-tumour).
A positive correlation was observed between expression levels of PlGF and VEGF in tumour tissues (r = 0.747, P<0.001) as well as in non-tumour tissues (r = 0.67, p<0.001). The ratio of PlGF level in tumour tissue to PlGF level in non-tumour tissue showed a positive correlation (r = 0.744, p<0.001) with the ratio of VEGF level in tumour tissue to VEGF level in non-tumour tissue, as shown in fig 1C ▶.
PlGF, but not VEGF, mRNA expression is a prognostic marker for colorectal cancer
In this study, −ΔCT value of PlGF for the tumour samples ranged from −6.56 to 4.58, with a median value of 0.87, whereas values for VEGF ranged from −2.72 to 4.34 (median 0.79). Patients were divided into low and high expression groups, based on whether they were above or below the median value. Patients in the high PlGF mRNA expression group were more likely to have advanced disease than those in the low expression group (stage IV, p = 0.047) (table 1 ▶). The probability of cancer specific survival was significantly lower in the high PlGF mRNA expression group (mean survival 35.8 months (95% confidence interval (CI) 30.5–41.1) than that of the low PlGF mRNA expression group (mean survival 43.3 months (95% CI 39.8–46.7); Breslow test, p = 0.040) (fig 2A ▶). In contrast, the difference between the probabilities of cancer specific survival in the high VEGF mRNA expression group and the low VEGF mRNA expression group was not statistically significant (p = 0.41) (fig 2B ▶).
Figure 2.
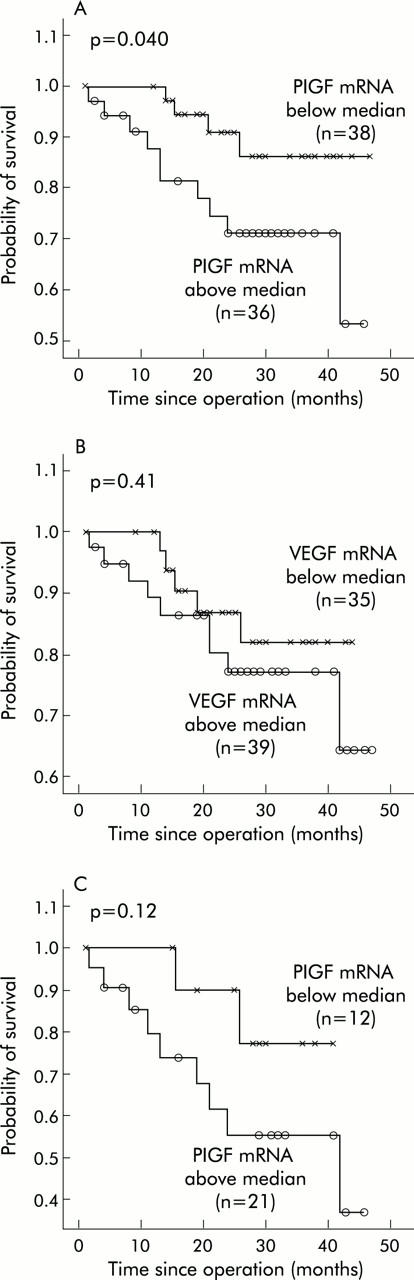
Survival curves in patients with colorectal cancer. (A) Survival curves of patients with placenta growth factor (PlGF) expression levels higher or lower than the median value. (B) Survival curves of patients with vascular endothelial growth factor (VEGF) expression levels higher or lower than the median value. (C) Survival curves for the advanced disease group with PlGF expression levels higher or lower than the median value.
For further comparison, patients with stages I and II were categorised as the localised disease group and patients with stages III and IV as the advanced disease group. Table 1 ▶ also shows that PlGF expression levels, the ratio between PlGF levels in tumour tissues and PlGF levels in non-tumour tissues, and cancer specific survival were significantly different between the localised disease and advanced disease groups (p = 0.013 and 0.001, respectively). Differences in sex, age, follow up period, VEGF expression, and ratio between VEGF levels in tumour tissues and VEGF levels in non-tumour tissues were not statistically significant. As deaths were mostly observed for the advanced disease group, we tried to determine whether there was any independent factor for predicting outcome in these advanced disease patients. We found that there was a trend for PlGF expression as a predictor of survival as the probability of survival was lower in the high PlGF mRNA expression group (mean survival 30.7 months) than in the low PlGF mRNA expression group (mean survival 36.5 months; Breslow test, p = 0.12) (fig 2C ▶). However, the difference was not significant due to the small sample size and short follow up period.
PlGF, VEGF, and Flt-1 localisation in colorectal cancer
Immunohistochemical staining analysis (fig 3 ▶) showed that both PlGF and VEGF were expressed mainly in tumour cells. In contrast, Flt-1, the receptor for PlGF and VEGF, was expressed in both tumour cells as well as in endothelial cells.
Figure 3.

Immunohistochemical stain showed a positive placenta growth factor (PlGF) (A) and vascular endothelial growth factor (VEGF) (B) reaction, mainly in tumour cells, while Flt-1 (C) protein was expressed in both tumour cells and endothelial cells. A–C, 200×; stage III; arrows, tumour cells; arrowhead, endothelial cell.
PlGF protein levels correlated with mRNA levels
Protein levels of PlGF in tumour tissues ranged from 26.6 to 2498.4 pg/mg (mean (SEM) 281.3 (38.8) pg/mg). In corresponding non-tumour tissues, protein levels of PlGF ranged from 26.6 to 358.4 pg/mg (mean (SEM) 128.7 (8.5) pg/mg). PlGF protein levels in tumours were significantly higher than those of corresponding non-tumour tissues (p<0.001) (fig 4A ▶). PlGF protein expression correlated well with mRNA from the same tissue (r = 0.308, p<0.001) (fig 4B ▶).
Figure 4.
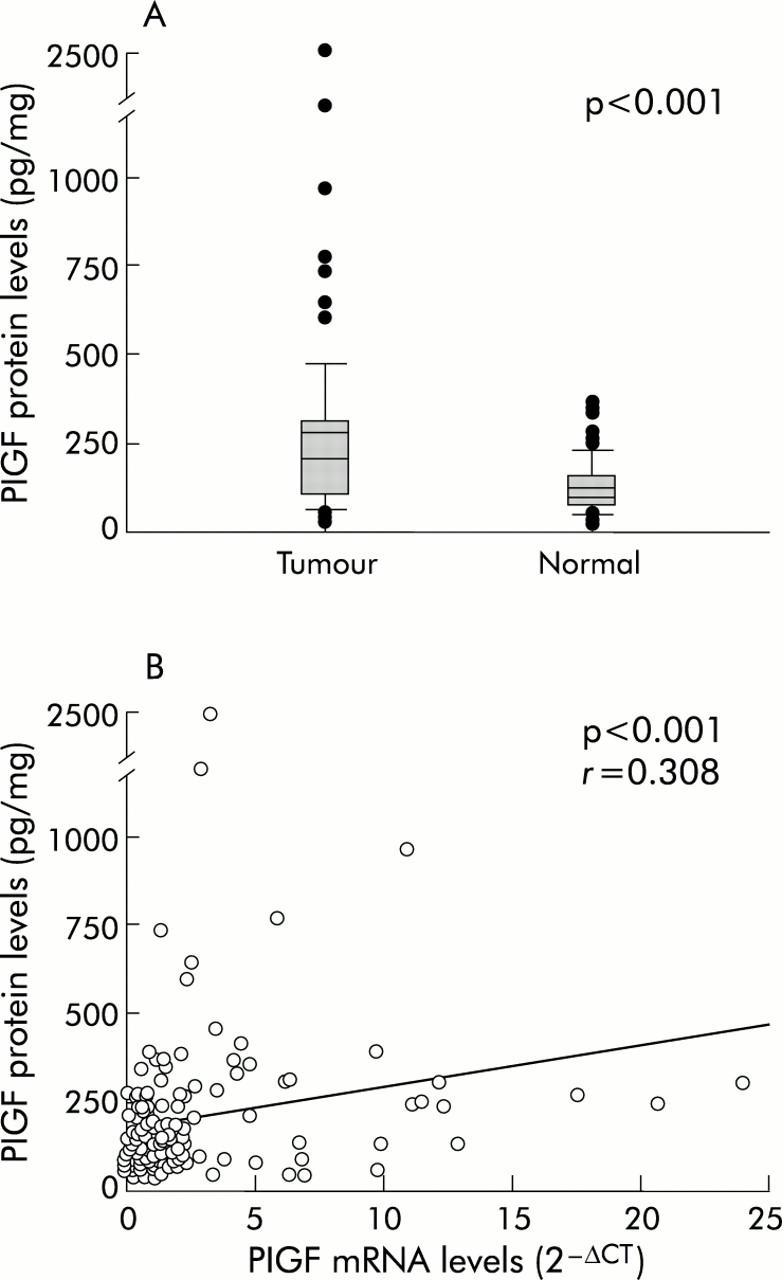
(A) Protein levels of placenta growth factor (PlGF) were significantly higher in colorectal tumour tissues than in corresponding non-tumour tissues, measured by an ELISA method. (B) PlGF protein expression levels were significantly correlated with mRNA expression levels.
DISCUSSION
Angiogenesis is required for tumour growth and metastasis.20–22 Recently, PlGF has been shown to be a key molecule in the angiogenic switch under pathological conditions, including cancer.15 In the present study, we demonstrated that PlGF expression levels were significantly higher in tumour tissues compared with non-tumour tissues. The ratio between PlGF levels in tumour tissues and PlGF levels in the non-tumour tissue correlated well with the stage of colon cancer. Furthermore, higher PlGF expression in the tumour, as well as a higher ratio of PlGF levels in tumour tissues to PlGF levels in non-tumour tissues, correlated with a poorer prognosis. It has been proposed that PlGF stimulates angiogenesis through displacement of VEGF from the Flt-1 sink, thereby increasing the fraction of VEGF available for activation of Flk-1.13,15 Alternatively, PlGF can modulate the function of VEGF by regulating intermolecular and intramolecular crosstalk between Flt-1 and Flk-1.23 Moreover, PlGF alone can trigger its own signalling, independent of the VEGF/Flk-1 pathway, and can trigger Flt-1 dependent functions such as proliferation, apoptosis, and angiogenesis.23 In addition, loss of PlGF activity impaired angiogenesis in pathological conditions such as ischaemia, inflammation, and cancer.15 These results suggest that PlGF may be a key molecule in regulating the angiogenic switch under pathological conditions. These data are consistent with our results that PlGF expression levels are significantly higher in tumour tissues than in non-tumour tissues and that the ratio between PlGF levels in tumour tissues and PlGF levels in non-tumour tissues correlates with colon cancer stage.
Several studies have demonstrated that VEGF and PlGF expression correlate with tumour growth and angiogenesis.2,4,5,7,13–15,18 In our study, we showed that expression levels of PlGF and VEGF in tumour tissues were higher than in non-tumour tissues of the same colorectal cancer patients. These results suggest that both PlGF and VEGF may play roles in colorectal cancer formation and tumour progression, consistent with the hypothesis of Carmeliet et al that PlGF exerts a synergistic effect on VEGF driven angiogenesis under pathological conditions.15 VEGF stimulates growth of new vessels that are fragile, leaky, and prone to regression. PlGF can recruit smooth muscle cells/precursors, and thereby stimulate vessel maturation and stabilisation.24,25 Therefore, PlGF and VEGF should be upregulated in parallel during angiogenesis to stimulate the formation of mature non-leaky vessels. PlGF expression could be regulated by oxygen tension and cytokines.26 However, the mechanism of increased PlGF expression in colorectal cancer remains unclear.
Elevated expression of VEGF in tumour tissues of colorectal cancer patients was observed in many studies. There was generally no correlation between elevated VEGF expression and patient survival,4–8,18 with only one exception, that of Lee et al who reported that VEGF correlated with survival. However, it did not emerge as an independent risk factor in a multivariate analysis.2 Our studies also showed that VEGF expression increased in tumour tissues but did not correlate with survival. In contrast, PlGF expression levels not only increased in colorectal cancer but also correlated with survival. This indicates that PlGF, in addition to its synergistic effect on VEGF driven angiogenesis, may have its own distinct effect on colorectal cancer. The clinical implication is that PlGF may be useful as a prognostic indicator, especially important in TNM stage III and IV patients. For stage III and IV patients with low PlGF levels, aggressive treatment is still recommended.
Immunohistochemical localisation studies showed that PlGF, VEGF, and their receptor, Flt-1, were all localised in tumour cells. We hypothesised that colon cancer cells secrete PlGF as well as VEGF and that both factors serve paracrine and autocrine functions in stimulating angiogenesis as well as cancer growth and metastasis.
Several clinical efforts are currently underway to evaluate the therapeutic potential of inhibitors of VEGF or VEGFR-2. In recent studies, the VEGF specific antibody bevacizumab prolonged survival of colorectal cancer patients and had a direct and rapid antivascular effect in human rectal cancer.27,28 However, VEGF and VEGFR-2 are not only involved in pathological angiogenesis but also in normal vessel growth and maintenance.29 Furthermore, VEGF has a direct effect on motor neurone survival,30 lung maturation,31 liver regeneration,32 control of blood pressure,33 and glomerular development.34 This raises the question of whether long term inhibition of VEGF may also affect these processes.35 PlGF, in contrast with VEGF, affects blood vessel formation only under pathological and not under physiological conditions,15 except during normal physiological angiogenesis in the placenta.36,37 Our results showed that PlGF, but not VEGF, was significantly upregulated in colorectal cancer and correlated with survival. Thus PlGF may be a safer therapeutic target for colorectal cancer.
In summary, we demonstrated that both PlGF and VEGF expression levels in tumour tissues are higher than in non-tumour tissues in patients with colorectal cancer. The ratio of PlGF levels in tumour tissues to PlGF levels in non-tumour tissues, but not the analogous ratio for VEGF, correlated with stage of colorectal cancer. We conclude that PlGF expression correlates with disease progression and survival status, and may be used as a prognostic indicator for colorectal cancer.
Acknowledgments
This study was supported by a grant from the National Taiwan University Hospital (93-M012). We thank Mr Hwai-I Yang for his kind help in statistical analysis.
Abbreviations
VEGF, vascular endothelial growth factor
PlGF, placenta growth factor
LCM, laser capture microdissection
PBS, phosphate buffered saline
ELISA, enzyme linked immunoabsorbant assay
Conflict of interest: None declared.
Part of the results were presented at the 95th AACR (American Association for Cancer Research) in March 2004.
REFERENCES
- 1.Klagsbrun M, D’Amore PA. Regulators of angiogenesis. Annu Rev Physiol 1991;53:217–39. [DOI] [PubMed] [Google Scholar]
- 2.Lee JC, Chow NH, Wang ST, et al. Prognostic value of vascular endothelial growth factor expression in colorectal cancer patients. Eur J Cancer 2000;36:748–53. [DOI] [PubMed] [Google Scholar]
- 3.Shiraishi A, Ishiwata T, Shoji T, et al. Expression of PCNA, basic fibroblast growth factor, FGF-receptor and vascular growth factor in adenomas and carcinomas of human colon. Acta Histochem Cytochem 1995;28:21–9. [Google Scholar]
- 4.Wong MP, Cheung N, Yuen ST, et al. Vascular endothelial growth factor is up-regulated in the early pre-malignant stage of colorectal tumour progression. Int J Cancer 1999;81:845–50. [DOI] [PubMed] [Google Scholar]
- 5.Takahashi Y, Kitadai Y, Bucana CD, et al. Expression of vascular endothelial growth factor and its receptor, KDR, correlates with vascularity, metastasis, and proliferation of human colon cancer. Cancer Res 1995;55:3964–8. [PubMed] [Google Scholar]
- 6.Takahashi Y, Bucana CD, Cleary KR, et al. p53, vessel count, and vascular endothelial growth factor expression in human colon cancer. Int J Cancer 1998;79:34–8. [DOI] [PubMed] [Google Scholar]
- 7.Landriscina M, Cassano A, Ratto C, et al. Quantitative analysis of basic fibroblast growth factor and vascular endothelial growth factor in human colorectal cancer. Br J Cancer 1998;78:765–70. [DOI] [PMC free article] [PubMed] [Google Scholar]
- 8.Khorana AA, Ryan CK, Cox C, et al. Vascular endothelial growth factor, CD68, and epidermal growth factor receptor expression and survival in patients with stage II and stage III colon carcinoma: a role for the host response in prognosis. Cancer 2003;97:960–8. [DOI] [PubMed] [Google Scholar]
- 9.Andre T, Kotelevets L, Vaillant JC, et al. Vegf, Vegf-B, Vegf-C and their receptors KDR, FLT-1 and FLT-4 during the neoplastic progression of human colonic mucosa. Int J Cancer 2000;86:174–81. [DOI] [PubMed] [Google Scholar]
- 10.Maglione D, Guerriero V, Viglietto G, et al. Isolation of a human placenta cDNA coding for a protein related to the vascular permeability factor. Proc Natl Acad Sci U S A 1991;88:9267–71. [DOI] [PMC free article] [PubMed] [Google Scholar]
- 11.Hauser S, Weich HA. A heparin-binding form of placenta growth factor (PlGF-2) is expressed in human umbilical vein endothelial cells and in placenta. Growth Factors 1993;9:259–68. [DOI] [PubMed] [Google Scholar]
- 12.Cao Y, Linden P, Shima D, et al. In vivo angiogenic activity and hypoxia induction of heterodimers of placenta growth factor/vascular endothelial growth factor. J Clin Invest 1996;98:2507–11. [DOI] [PMC free article] [PubMed] [Google Scholar]
- 13.Park JE, Chen HH, Winer J, et al. Placenta growth factor. Potentiation of vascular endothelial growth factor bioactivity, in vitro and in vivo, and high affinity binding to Flt-1 but not to Flk-1/KDR. J Biol Chem 1994;269:25646–54. [PubMed] [Google Scholar]
- 14.Monsky WL, Fukumura D, Gohongi T, et al. Augmentation of transvascular transport of macromolecules and nanoparticles in tumors using vascular endothelial growth factor. Cancer Res 1999;59:4129–35. [PubMed] [Google Scholar]
- 15.Carmeliet P, Moons L, Luttun A, et al. Synergism between vascular endothelial growth factor and placental growth factor contributes to angiogenesis and plasma extravasation in pathological conditions. Nat Med 2001;7:575–83. [DOI] [PubMed] [Google Scholar]
- 16.Takahashi A, Sasaki H, Kim SJ, et al. Markedly increased amounts of messenger RNAs for vascular endothelial growth factor and placenta growth factor in renal cell carcinoma associated with angiogenesis. Cancer Res 1994;54:4233–7. [PubMed] [Google Scholar]
- 17.Donnini S, Machein MR, Plate KH, et al. Expression and localization of placenta growth factor and PlGF receptors in human meningiomas. J Pathol 1999;189:66–71. [DOI] [PubMed] [Google Scholar]
- 18.Adini A, Kornaga T, Firoozbakht F, et al. Placental growth factor is a survival factor for tumor endothelial cells and macrophages. Cancer Res 2002;62:2749–52. [PubMed] [Google Scholar]
- 19.Wei SC, Shun CT, Tsai-Wu JJ, et al. Microsatellite instability and hMLH1 and hMSH2 gene expression in Taiwanese hereditary nonpolyposis colorectal cancer. J Formos Med Assoc 2004;103:331–6. [PubMed] [Google Scholar]
- 20.Carmeliet P, Jain RK. Angiogenesis in cancer and other diseases. Nature 2000;407:249–57. [DOI] [PubMed] [Google Scholar]
- 21.Hanahan D, Folkman J. Patterns and emerging mechanisms of the angiogenic switch during tumorigenesis. Cell 1996;86:353–64. [DOI] [PubMed] [Google Scholar]
- 22.Folkman J . Angiogenesis in cancer, vascular, rheumatoid and other disease. Nat Med 1995;1:27–31. [DOI] [PubMed] [Google Scholar]
- 23.Autiero M, Waltenberger J, Communi D, et al. Role of PlGF in the intra- and intermolecular cross talk between the VEGF receptors Flt1 and Flk1. Nat Med 2003;9:936–43. [DOI] [PubMed] [Google Scholar]
- 24.Luttun A, Tjwa M, Moons L, et al. Revascularization of ischemic tissues by PlGF treatment, and inhibition of tumor angiogenesis, arthritis and atherosclerosis by anti-Flt1. Nat Med 2002;8:831–40. [DOI] [PubMed] [Google Scholar]
- 25.Autiero M, Luttun A, Tjwa M, et al. Placental growth factor and its receptor, vascular endothelial growth factor receptor-1: novel targets for stimulation of ischemic tissue revascularization and inhibition of angiogenic and inflammatory disorders. J Thromb Haemost 2003;1:1356–70. [DOI] [PubMed] [Google Scholar]
- 26.Torry DS, Mukherjea D, Arroyo J, et al. Expression and function of placenta growth factor: implications for abnormal placentation. J Soc Gynecol Investig 2003;10:178–88. [DOI] [PubMed] [Google Scholar]
- 27.Kabbinavar F, Hurwitz HI, Fehrenbacher L, et al. Phase II, randomized trial comparing bevacizumab plus fluorouracil (FU)/leucovorin (LV) with FU/LV alone in patients with metastatic colorectal cancer. J Clin Oncol 2003;21:60–5. [DOI] [PubMed] [Google Scholar]
- 28.Willett CG, Boucher Y, di Tomaso E, et al. Direct evidence that the VEGF-specific antibody bevacizumab has antivascular effects in human rectal cancer. Nat Med 2004;10:145–7. [DOI] [PMC free article] [PubMed] [Google Scholar]
- 29.Ferrara N, Gerber HP, LeCouter J. The biology of VEGF and its receptors. Nat Med 2003;9:669–76. [DOI] [PubMed] [Google Scholar]
- 30.Oosthuyse B, Moons L, Storkebaum E, et al. Deletion of the hypoxia-response element in the vascular endothelial growth factor promoter causes motor neuron degeneration. Nat Genet 2001;28:131–8. [DOI] [PubMed] [Google Scholar]
- 31.Compernolle V, Brusselmans K, Acker T, et al. Loss of HIF-2alpha and inhibition of VEGF impair fetal lung maturation, whereas treatment with VEGF prevents fatal respiratory distress in premature mice. Nat Med 2002;8:702–10. [DOI] [PubMed] [Google Scholar]
- 32.LeCouter J, Moritz DR, Li B, et al. Angiogenesis-independent endothelial protection of liver: role of VEGFR-1. Science 2003;299:890–3. [DOI] [PubMed] [Google Scholar]
- 33.Li B, Ogasawara AK, Yang R, et al. KDR (VEGF receptor 2) is the major mediator for the hypotensive effect of VEGF. Hypertension 2002;39:1095–100. [DOI] [PubMed] [Google Scholar]
- 34.Kitamoto Y, Tokunaga H, Tomita K. Vascular endothelial growth factor is an essential molecule for mouse kidney development: glomerulogenesis and nephrogenesis. J Clin Invest 1997;99:2351–7. [DOI] [PMC free article] [PubMed] [Google Scholar]
- 35.Luttun A, Autiero M, Tjwa M, et al. Genetic dissection of tumor angiogenesis: are PlGF and VEGFR-1 novel anti-cancer targets? Biochim Biophys Acta 2004;1654:79–94. [DOI] [PubMed] [Google Scholar]
- 36.Khaliq A, Li XF, Shams M, et al. Localisation of placenta growth factor (PIGF) in human term placenta. Growth Factors 1996;13:243–50. [DOI] [PubMed] [Google Scholar]
- 37.Ahmed A, Dunk C, Ahmad S, et al. Regulation of placental vascular endothelial growth factor (VEGF) and placenta growth factor (PIGF) and soluble Flt-1 by oxygen—a review. Placenta 2000;21 (suppl A) :S16–24. [DOI] [PubMed] [Google Scholar]