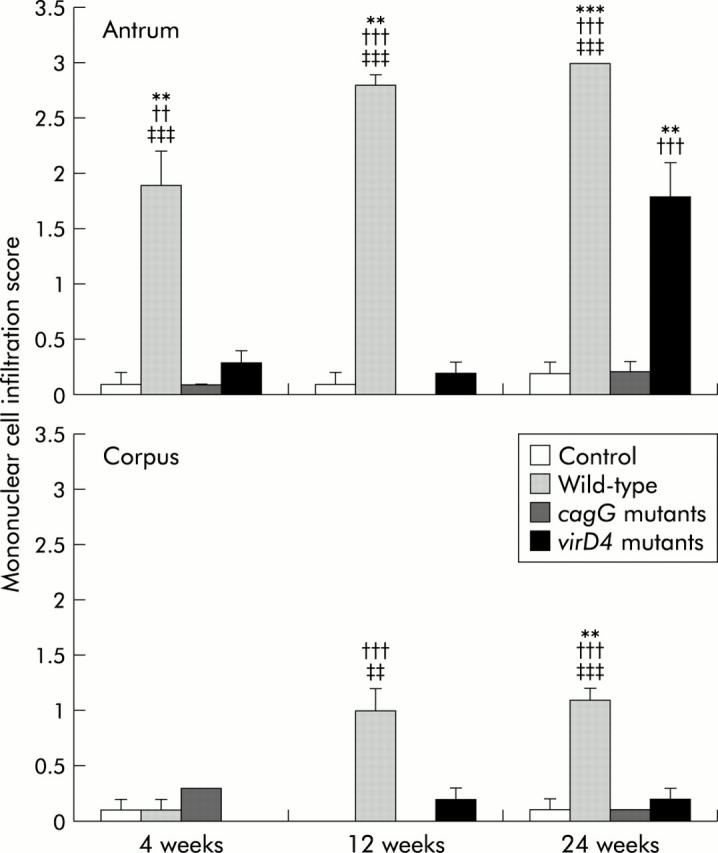
Figure 4.

Mononuclear cell infiltration scores at 4, 12, and 24 weeks after inoculating with Helicobacter pylori or without H pylori (control). Mean (SEM) values are presented. **p<0.01, ***p<0.001 compared with control; ††p<0.01, †††p<0.001 compared with the cagG knockout mutants; ‡‡p<0.01, ‡‡‡p<0.001 compared with the virD4 knockout mutants.
