

Abstract
Background and aims: α-Fetoprotein (AFP), a tumour marker for hepatocellular carcinoma (HCC), is associated with poor prognosis. Using cDNA microarray analysis, we previously found that ephrin-A1, an angiogenic factor, is the most differentially overexpressed gene in AFP producing hepatoma cell lines. In the present study, we investigated the significance of ephrin-A1 expression in HCC.
Methods: We examined ephrin-A1 expression and its effect on cell proliferation and gene expression in five AFP producing hepatoma cell lines, three AFP negative hepatoma cell lines, and 20 human HCC specimens.
Results: Ephrin-A1 expression levels were lowest in normal liver tissue, elevated in cirrhotic tissue, and further elevated in HCC specimens. Ephrin-A1 expression was strongly correlated with AFP expression (r = 0.866). We showed that ephrin-A1 induced expression of AFP. This finding implicates ephrin-A1 in the mechanism of AFP induction in HCC. Ephrin-A1 promoted the proliferation of ephrin-A1 underexpressing HLE cells, and an ephrin-A1 antisense oligonucleotide inhibited the proliferation of ephrin-A1 overexpressing Huh7 cells. Thus ephrin-A1 affects hepatoma cell growth. cDNA microarray analysis showed that ephrin-A1 induced expression of genes related to the cell cycle (p21), angiogenesis (angiopoietin 1 and thrombospondin 1), and cell-cell interactions (Rho, integrin, and matrix metalloproteinases) in cultured hepatoma cells. These ephrin-A1 induced genes are also activated in HCC tissues that overexpress AFP.
Conclusion: These findings suggest that the poor prognosis of patients with AFP producing HCC is partially caused by ephrin-A1 expression, which induces expression of genes related to tumour cell growth, angiogenesis, invasion, and metastasis.
Keywords: cDNA microarray, EphA1, p21, thrombospondin 1, matrix metalloproteinase 2
Alpha-fetoprotein (AFP), a tumour marker for hepatocellular carcinoma (HCC), is expressed in fetal liver but is not expressed in normal adult liver. Approximately 70% of HCCs are positive for AFP, and levels of AFP increase with tumour progression.1 HCCs with high levels of AFP have a poor prognosis and exhibit multicentric growth more frequently than AFP negative HCCs.2–4 In a previous study, we identified a gene cluster that was characteristically expressed in AFP producing hepatoma cell lines but not in non-AFP producing hepatoma cell lines.5 In this cluster, ephrin-A1 was the most differentially overexpressed gene in AFP producing hepatoma cell lines.
Ephrin-A1, a ligand for the Eph receptor tyrosine kinase, is involved in vascular development, tissue border formation, cell migration, axon guidance, synaptic plasticity, and adult neovascularisation.6 Several lines of evidence suggest that ephrin-A1 plays roles in multiple aspects of tumorigenesis, including abnormal cell growth, angiogenesis, invasion, and metastasis.7,8,9,10,11,12 Overexpression of ephrin-A1 in melanoma cells correlates with an increase in tumour cell growth, indicating that ephrin-A1 acts as a cell survival factor or a promoter of abnormal cell growth in tumour cells.9–11 Ephrin-A1 and its receptor are consistently expressed in endothelial cells of tumour associated vessels in a variety of human tumours, including lung, stomach, and colorectal cancers,7 and blocking the EphA receptor inhibits tumour angiogenesis and tumour progression in vivo.8 Inappropriate expression and regulation of ephrin ligands and Eph receptors affects cell-matrix interaction by modulating integrin activity.12 Although these findings suggest that ephrin-A1 expression participates in tumorigenesis, the biological significance and expression pattern of ephrin-A1 in HCC are unknown.
In the present study, we investigated ephrin-A1 expression in HCC specimens and hepatoma cell lines, and we examined the effect of ephrin-A1 on cell proliferation and gene expression. We also discuss the significance of ephrin-A1 expression in AFP producing HCC.
MATERIALS AND METHODS
Cell lines
Huh7, Hep3B, HepG2, Huh6, PLC/PRF/5, SK-Hep1, and HLE cells were maintained in Dulbecco’s modified Eagle’s medium supplemented with 10% fetal bovine serum. The simian virus 40 large-T antigen-immortalised normal human hepatocyte cell line (THLE-5b) was maintained in PMFR-4.13,14
Tissue specimens
Cancerous and non-cancerous tissues were obtained from patients who underwent partial hepatectomy for HCC. Normal controls were histologically normal tissues and were obtained from patients who underwent partial hepatectomy for metastatic liver tumours. These patients had no obvious underlying disease, tested negative for all hepatitis virus markers, and had normal levels of serum transaminase. Cancerous and non-cancerous tissues were separately enucleated from resected tissues and were then immediately frozen in liquid nitrogen. Histological characterisation of HCC and normal liver tissue was performed as described previously.15,16 Informed consent was obtained from all patients and ethics approval for the study was obtained from the ethics committee for human genome/gene analysis research at Kanazawa University Graduate School of Medical Science.
Northern blotting
Total RNA was isolated from cultured cells and frozen tissues using a ToTally-RNA kit (Ambion, Austin, Texas, USA). Northern blotting was performed using a NorthernMax kit (Ambion). cDNA probes containing unique sequences from human AFP, ephrin-A1, EphA1, EphA2, p21WAF1/CIP1, thrombospondin 1 (TSP-1), matrix metalloproteinase 2 (MMP-2), and β-actin were labelled with [α32P] dCTP by random priming. mRNA expression levels were quantified with a Fujix-MacBas1000 Bio-imaging analyser (Fujix, Tokyo, Japan).
Immunohistochemistry
Tissue specimens were fixed in 10% formalin, embedded in paraffin blocks, and cut into 5 μm section. Sections were incubated overnight at 4°C with anti-ephrin-A1 (Santa Cruz Biotechnology, Santa Cruz, California, USA), anti-EphA1 (R&D Systems, Minneapolis, Minnesota, USA), or anti-AFP antibodies (DakoCytomation, Glostrup, Denmark), and were subjected to the ABC immunostaining procedure using a Vectorstain ABC kit (Vector, Burlingame, California, USA), followed by DAB (Sigma-Aldrich Co., S. Louis, Missouri, USA). Negative controls were normal liver tissues in which northern blotting and western blotting confirmed the absence of ephrin-A1, AFP, and EphA1 expression.
Antisense-oligodeoxynucleotide and cell proliferation assay
We designed an antisense phosphorothioate oligodeoxynucleotide (5′-CCA GAG GAA CTC CAT AGC GC-3′) complementary to the ephrin-A1 gene nucleotide sequence that spans from five nucleotides upstream of the predicted translational initiation site to 15 nucleotides downstream from this site. We also used a sense oligodeoxynucleotide (5′-GCG CTA TGG AGT TCC TCT GG-3′) as a negative control. For positive controls, we used an antisense oligodeoxynucleotide for the potent HCC growth factor, insulin-like growth factor II (IGF-II; 5′-TCT GCC TCG CAG TTG G-3′), and its control sense oligodeoxynucleotide (5′-TGT CTC CCA GGC GGT T-3′).17 For the proliferation assay, 3×10³ cells were cultured in 96 well plates for 24 hours. Various concentrations of oligodeoxynucleotides were then added to the medium using the FuGENE6 transfection reagent (Boehringer Mannheim, Mannheim, Germany), and cultures were incubated for 72 hours. Cell growth was measured using the MTS assay kit (Promega, Madison, Wisconsin, USA).
Clonal growth assay
For studies using soluble ephrin-A1-Fc, 250 cells were plated in triplicate directly onto 12 well cell culture dishes in the presence of 0.3 μg/ml ephrin-A1-Fc. The medium was changed every two days. After 8–10 days of culture, cell growth was measured using the MTS assay kit (Promega).
Ligand stimulation and cDNA microarray analysis
Subconfluent HLE cells were cultured with or without 1 μg/ml of ephrin-A1-Fc for 10 hours in serum free Dulbecco’s modified Eagle’s medium. Total RNA was then isolated. The cDNA microarrays were produced in collaboration with Hitachi Software Engineering Co. Ltd (Yokohama, Japan) using a SPBIO2000 robotic arrayer, and contained a total of 1080 cDNA clones, as described previously.5,16,18 Fluorescence intensities, generated by Cy5 or Cy3 immobilised to the target sequences on the microarray slides, were measured with a ScanArray5000 laser confocal microscope equipped scanning system(General Scanning, Watertown, Massachusetts, USA) with appropriate excitation and emission filters, as described previously.5 The signal from each immobilised cDNA target on the microarray slide was localised, and the expression ratio between the experimental and reference samples (Cy5/Cy3 ratio) was determined using ImaGene version 3.0 software (Biodiscovery, Los Angeles, California, USA). Microarray analysis was performed in triplicate, and the values of Cy5/Cy3 ratio represent averages.
Immunoprecipitation and immunoblotting
Cell extracts were prepared in RIPA buffer (50 mM HEPES, pH 7.2, 150 mM sodium chloride, 1.5 mM MgCl2, 1 mM EDTA, 1 mM sodium orthovanadate, 10 mM sodium pyrophosphate, 100 mM sodium fluoride, 10% glycerol, 1% TritonX-100, 0.1% sodium dodecyl sulphate, and 1% sodium deoxycholate) containing protease inhibitors (1 mM phenylmethylsulfonyl fluoride, 10 μg/ml aprotinin, 10 μg/ml leupeptin, and 10 μg/ml pepstatin). For immunoblotting, whole cell lysates were boiled in SDS-polyacrylamide gel electrophoresis (SDS-PAGE) loading buffer, separated by 4–20% gradient SDS-PAGE, and then electrophoretically transferred to PVDF membranes. Immunoblotting was carried out according to the manufacturer’s instructions. Anti-ephrin-A1, anti-EphA2, anti-AFP, anti-p21, anti-TSP-1, and anti-MMP-2 antibodies were purchased from Santa Cruz Biotechnology, while anti-EphA1 antibody was purchased from R&D Systems. For immunoprecipitation, cell lysates were first incubated for two hours at 4°C with anti-EphA1 antibodies (R&D Systems) followed by incubation for 1.5 hours at 4°C with Gamma-Bind Sepharose beads. Immunoprecipitates were boiled in SDS-PAGE loading buffer, separated by 4–20% gradient SDS-PAGE, and then electrophoretically transferred to PVDF membranes. An anti-phosphotyrosine antibody, PY-20, conjugated to horseradish peroxidase (Transduction Laboratories, Lexington, Kentucky, USA) was used for immunoblotting at a dilution of 1:2000. An anti-EphA1 antibody (R&D Systems) was used at a dilution of 1:1000, followed by an antirabbit antibody conjugated to horseradish peroxidase. Immunoreactive bands were revealed with the Amersham ECL immunoblot detection system.
Radioimmunoassay for AFP
AFP protein concentrations in clinical specimens were measured by radioimmunoassay (RIA) (SRL, Tokyo, Japan).16
Statistical analysis
In order to investigate correlations between expression levels of ephrin-A1 mRNA and AFP mRNA in clinical specimens, linear relationships were measured using scatterplots. Statistical differences between the two groups were determined by the Student’s t test. A p value of <0.05 was considered statistically significant.
RESULTS
Ephrin-A1 expression correlates with AFP expression
Using cDNA microarray analysis, we previously found that ephrin-A1 was the most differentially overexpressed gene in AFP producing hepatoma cell lines.5 In the current study, we investigated expression of ephrin-A1 mRNA in eight hepatoma cell lines using northern blotting. As shown in fig 1 ▶, AFP producing hepatoma cell lines (Huh7, Hep3B, HepG2, Huh6, and PLC/PRF/5) displayed elevated ephrin-A1 expression compared with non-AFP producing hepatoma cell lines (SK-Hep1, HLE, and THLE-5b).
Figure 1.

Expression of α-fetoprotein (AFP) and ephrin-A1 mRNA in eight human hepatoma cell lines determined by northern blotting (20 μg RNA/lane). Expression levels of AFP and ephrin-A1 mRNA were quantified. The ratio of AFP or ephrin-A1 to β-actin is shown below each northern blot.
We then investigated expression of ephrin-A1 mRNA in cancerous tissue obtained from 20 patients with HCC by northern blotting (table 1 ▶, and fig 2A ▶, B). Interestingly, in 11 (cases 3, 4, 5, 6, 7, 9, 11, 12, 15, 16, and 18) HCC specimens with markedly increased ephrin-A1 mRNA expression, the cancerous tissue showed high levels of AFP expression. Ephrin-A1 mRNA expression in HCC tissue strongly correlated with AFP mRNA expression (r = 0.866), suggesting a close association between expression of both genes (fig 3 ▶). Immunostaining (fig 4 ▶, case 4) showed that ephrin-A1, AFP, and EphA1 receptors were strongly expressed in the cytoplasm and on the cell surfaces of tumour cells in cancerous tissue. In particular, in AFP overexpressing HCC (cases 3, 4, 5, 6, 7, 9, 11, 12, 15, 16, and 18), ephrin-A1 was strongly expressed in tumour cells in cancerous tissue, but in AFP underexpressing HCC (cases 1, 2, 8, 10, 13, 14, 17, 19, and 20), expression of ephrin-A1 was markedly lower. Furthermore, in non-cancerous (cirrhotic) tissue, only slight expression of ephrin-A1, AFP, and EphA1 receptor was seen in hepatocytes. In normal liver tissues, expression of ephrin-A1, AFP, and EphA1 was not seen (data not shown).
Table 1.
Characteristics of the 20 hepatocellular carcinomas
| Case | Virus | Size of tumour (cm) | Histological grading of HCC* | Non-cancerous tissue staging and grading |
| 1 | C | 4.7 | Well differentiated | F4A3 |
| 2 | B + C | 5.5 | Well differentiated | F4A1 |
| 3 | C | 3.0 | Poorly differentiated | F3A1 |
| 4 | C | 2.7 | Poorly differentiated | F4A1 |
| 5 | C | 13.5 | Poorly differentiated | F3A2 |
| 6 | C | 3.5 | Poorly differentiated | F4A2 |
| 7 | C | 5.5 | Moderately differentiated | F3A1 |
| 8 | C | 4.0 | Moderately differentiated | F4A3 |
| 9 | B | 10.0 | Poorly differentiated | F3A2 |
| 10 | C | 5.5 | Moderately differentiated | F3A2 |
| 11 | C | 3.5 | Poorly differentiated | F4A2 |
| 12 | C | 2.5 | Poorly differentiated | F4A2 |
| 13 | C | 6.0 | Well differentiated | F2A1 |
| 14 | C | 2.3 | Moderately differentiated | F3A1 |
| 15 | B | 3.5 | Poorly differentiated | F4A2 |
| 16 | C | 2.0 | Moderately differentiated | F4A2 |
| 17 | C | 1.4 | Moderately differentiated | F3A1 |
| 18 | C | 2.5 | Moderately differentiated | F3A1 |
| 19 | C | 2.5 | Well differentiated | F4A2 |
| 20 | C | 4.0 | Well differentiated | F3A1 |
*Histological grading of HCCs was decided according to the Classification of Liver Cancer Study Group of Japan. Histological grading and staging of non-cancerous tissue were decided according to the method of Desmet and colleagues.15
Figure 2.

Expression of α-fetoprotein (AFP) and ephrin-A1 in one normal liver tissue specimen and 20 cancerous tissue specimens from patients with hepatocellular carcinoma. (A) Amount of AFP protein per gram of total protein (gTP) was calculated after AFP protein expression was quantified by radioimmunoassay. (B) AFP mRNA and ephrin-A1 mRNA expression analysed by northern blotting (20 μg RNA/lane). Bands for AFP, ephrin-A1, and β-actin mRNA were quantified by densitometry. The number under each band indicates AFP and ephrin-A1 fragment signal normalised against the signal for β-actin.
Figure 3.

α-Fetoprotein (AFP) mRNA and ephrin-A1 mRNA values for individual patients were displayed on a scatterplot, and their linear correlation was evaluated.
Figure 4.
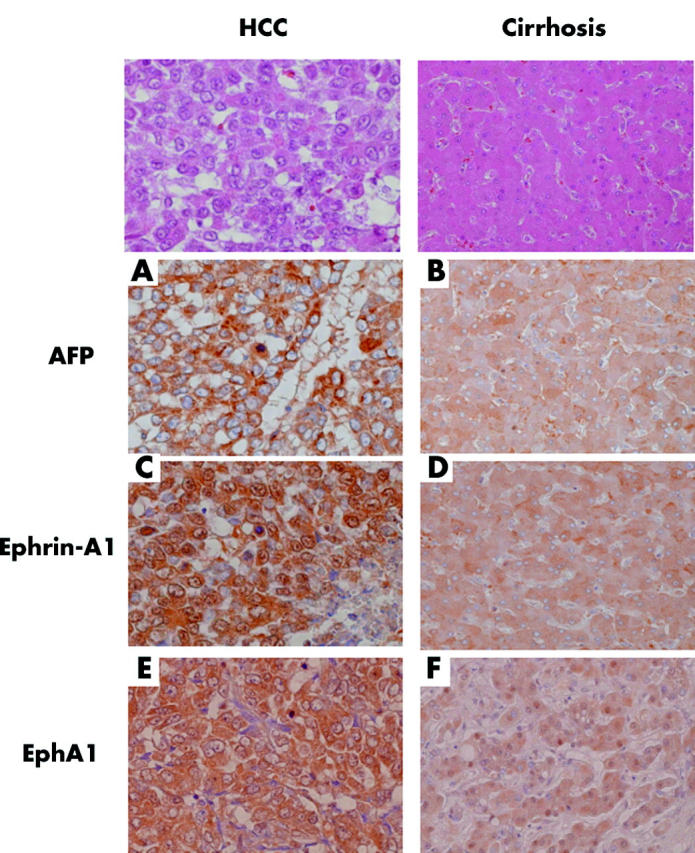
Immunohistochemistry of α-fetoprotein (AFP), ephrin-A1, and EphA1 in cancerous (A, C, E) and non-cancerous (B, D, F) tissues of hepatocellular carcinoma (HCC) (case 4). Immunoperoxidase labelling of these specimens using anti-AFP antibody (A, B), anti-ephrin-A1 antibody (C, D), or anti-EphA1 antibody (E, F). Top figures show haematoxylin-eosin staining of cancerous and non-cancerous tissues of HCC (case 4).
Effect of ephrin-A1 on the proliferation of hepatoma cells
In order to determine whether overexpression of ephrin-A1 plays a significant role in the malignant growth of hepatoma cells, we examined the effect of an ephrin-A1 antisense oligonucleotide on proliferation of Huh7 and HLE cells (fig 5A ▶). The specificity of the antisense oligonucleotide was confirmed by northern blotting. Suppression of ephrin-A1 by antisense oligonucleotide led to dose dependent growth inhibition of ephrin-A1 overexpressing Huh7 cells. The degree of growth inhibition caused by ephrin-A1 suppression was equal to or greater than the reduction of growth caused by suppression of IGF-II, a growth factor that strongly induces Huh7 cell proliferation.17 Compared with the sense oligonucleotide, the antisense oligonucleotide did not increase apoptosis in Huh7 cells, as determined by DNA content analysis and acridine orange/ethidium bromide double staining (data not shown). These results indicate that reduced cell proliferation, rather than increased apoptosis, was responsible for the reduction in Huh7 cell number by the ephrin-A1 antisense oligonucleotide. The antisense oligonucleotide against ephrin-A1 did not have an antiproliferative effect on HLE cells, which produce little ephrin-A1.
Figure 5.

Dose dependent inhibition of cell proliferation by an ephrin-A1 antisense oligodeoxynucleotide. (A) Cell proliferation assay. Cells were incubated for 72 hours with various concentrations of antisense or sense oligodeoxynucleotides. Cell proliferation was measured by MTS assay. “Control” indicates absorbance at 490 nm with no oligodeoxynucleotide added. Mean (SEM) of three independent experiments is plotted. The upper figures show the effect of ephrin-A1 antisense or sense oligodeoxynucleotide, while the lower figures show the effects of insulin-like growth factor II (IGF-II) antisense or sense oligodeoxynucleotides. Bands under the graphs confirm that the antisense oligodeoxynucleotide suppresses ephrin-A1 mRNA expression by northern blotting. Total RNA was extracted from cells 20 hours after transfection (20 μg/lane). *p<0.05. (B) Changes in expression of p21 mRNA after treatment with ephrin-A1 antisense or sense oligodeoxynucleotide by northern blotting. Total RNA was extracted from cells 24 hours after transfection (20 μg/lane).
We next used recombinant ephrin-A1 that was dimerised by fusion to human immunoglobulin G (ephrin-A1-Fc) to investigate the effect of ephrin-A1 on proliferation of hepatoma cells (fig 6A ▶).19 We detected activated (tyrosine phosphorylated) EphA1 receptor in ephrin-A1 overexpressing Huh7 cells prior to addition of ephrin-A1-Fc, suggesting autocrine activation of the EphA1 receptor by endogenous ephrin-A1. In contrast, activated EphA1 receptor was not observed in HLE cells prior to addition of ephrin-A1-Fc, consistent with low expression of ephrin-A1 in these cells. Addition of ephrin-A1-Fc significantly increased the level of activated EphA1 receptor in both Huh7 and HLE cells. However, ephrin-A1-Fc promoted the proliferation of only ephrin-A1 underexpressing HLE cell (16% increase in cell growth, p = 0.014).
Figure 6.
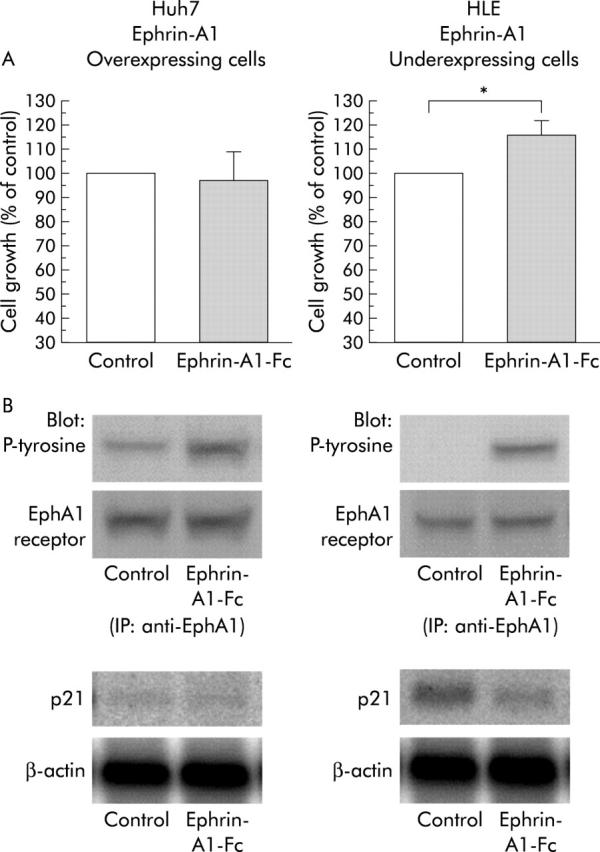
Effect of ephrin-A1 on proliferation of hepatoma cells. (A) Clonal growth assay. Cells were plated in 12 well cell culture dishes in the presence of 0.3 μg/ml ephrin-A1-Fc. Representative results from three independent experiments are shown. Bands under the graphs show that ephrin-A1-Fc stimulates tyrosine phosphorylation of the EphA1 receptor. Huh7 cells and HLE cells were treated for 60 minutes with 0.3 μg/ml ephrin-A1-Fc prior to protein extraction. Extracts were immunoprecipitated (IP) with antibodies against EphA1. Immunoprecipitates were subjected to western blotting, probed with antibodies against phosphorylated tyrosine (P-tyrosine), and reprobed with antibodies against EphA1. Data in the bar chart are mean (SEM) (n = 9). *p<0.05. (B) Changes in expression of p21 mRNA 10 hours after stimulation with ephrin-A1-Fc by northern blotting (20 μg RNA/lane).
In order to clarify these results, we investigated expression levels of p21, a universal inhibitor of cyclin dependent kinases (figs 5B ▶, 6B ▶).20 In HCC, p21 is an important inhibitor of cell cycle progression.21–23 There was little basal expression of p21 in Huh7 cells in which the EphA1 signalling pathway was already activated due to autocrine stimulation (fig 6A ▶, B). Consistent with autocrine activation of EphA1 and a role for p21, suppression of ephrin-A1 by the antisense oligonucleotide caused increased expression of p21 and inhibited Huh7 cell growth (fig 5B ▶). Ephrin-A1-Fc stimulated tyrosine phosphorylation of the EphA1 receptor in Huh7 cells but ephrin-A1-Fc did not alter the already suppressed expression of p21, and it did not affect cell growth (fig 6B ▶). In contrast, in HLE cells, EphA1 signalling was not activated in the basal state, and p21 was expressed (fig 6A ▶, B). Furthermore, ephrin-A1-Fc stimulated EphA1 signalling, suppressed p21 expression, and promoted the proliferation of HLE cells (fig 6B ▶). These findings strongly suggest that ephrin-A1 enhances cell proliferation, at least in part, through a p21 dependent signalling pathway.
Changes in gene expression caused by ephrin-A1
We used cDNA microarrays to identify the genes that are induced by ephrin-A1-Fc stimulation during hepatoma cell proliferation (table 2 ▶). Ephrin-A1-Fc (fig 7A ▶) increased expression of AFP, indicating that enhanced ephrin-A1 expression induced AFP expression in hepatoma cells. Furthermore, we performed northern blotting to confirm that when mRNA expression of ephrin-A1 in Huh7 cells was suppressed by 77% using the antisense oligonucleotide, mRNA expression of AFP decreased by 24% (fig 7B ▶). This agrees with our finding that ephrin-A1 expression strongly correlates with AFP expression in cultured hepatoma cells and HCC tissue (figs 1 ▶–4 ▶). There was also an increase in expression of the EphA1 receptor, one of the seven EphA receptors that bind to ephrin-A1 (fig 7A ▶).24–27 Although the EphA2 receptor is reported to mediate the majority of effects of ephrin-A1 in various cancers,7,9,28–32 little or no change in EphA2 receptor expression was observed (data not shown).
Table 2.
Changes in HLE gene expression by ephrin-Al-Fc stimulation
| Gene category | Gene name | Cy5/Cy3 ratio |
| Cell cycle | H sapiens RBQ-1 | 3.12 |
| RB107 retinoblastoma-like 1 (p107) | 2.38 | |
| RB130 retinoblastoma-like 2 | 2.13 | |
| Cyclin D2 | 0.46 | |
| p21 | 0.40 | |
| Angiogenesis | Endothelin 2 | 2.30 |
| Endothelin 3 | 2.22 | |
| Laminin, α4 | 2.22 | |
| Bone morphogenetic protein 4 (BMP4) | 2.16 | |
| Angiopoietin 1 (Ang1) | 2.12 | |
| Inhibin, βA (activin A, activin AB alpha polypeptide) | 2.07 | |
| Fibroblast growth factor receptor 3 | 1.85 | |
| Laminin, γ1 (formerly LAMB2) | 0.68 | |
| Bone morphogenetic protein 1 (BMP1) | 0.68 | |
| Thrombospondin 1 (TSP-1) | 0.47 | |
| Cell-cell interaction | CD22 antigen | 2.41 |
| Rho6 protein | 1.95 | |
| CD36 antigen (collagen type I receptor, thrombospondin receptor) | 1.94 | |
| Matrix metalloproteinase 12 (MMP-12) | 1.89 | |
| Ras homologue gene family, member H | 1.88 | |
| Manic fringe (Drosophila) homologue | 1.88 | |
| Integrin, α2 (CD49B, alpha 2 subunit of VLA-2 receptor) | 1.83 | |
| Integrin, αM | 1.81 | |
| Matrix metalloproteinase 2 (MMP-2) | 1.56 | |
| CD44 antigen (homing function and Indian blood group system) | 0.68 | |
| Oncogene | Alpha-fetoprotein (AFP) | 1.91 |
| Met proto-oncogene (hepatocyte growth factor receptor) | 0.52 | |
| Vav 2 oncogene | 0.59 | |
| Growth factors and cytokines | Tachykinin 2 | 2.31 |
| Interleukin 5 | 0.59 | |
| Fibroblast growth factor 7 (keratinocyte growth factor) | 0.50 | |
| Cell receptor | Interleukin 5 receptor, α | 3.12 |
| Erythropoietin receptor | 2.12 | |
| Glutamate receptor, ionotropic, kainate 1 | 1.90 | |
| EphA1 receptor | 1.82 | |
| Signal transduction | Human 76 kDa tyrosine phosphoprotein SLP-76 extracellular signal regulated kinase 2 (ERK2) | |
| 0.53 | ||
| Stress and toxicology response | Cytochrome P450, subfamily IIC | 1.95 |
| Transcription factors | Hepatic leukaemia factor | 2.30 |
| Nuclear factor I/X (CCAAT binding transcription factor) | 2.11 | |
| Human Ikaros/LyF-1 homologue (hIk-1) | 2.04 | |
| Tumour suppressors | BRCA1 associated RING domain 1 | 1.95 |
| Cytoskelton | Keratin, type II cytoskeletal 6D | 0.42 |
Figure 7.

(A) Time course (0, 5, 10, and 15 hours) of changes in expression of α-fetoprotein (AFP), EphA1, thrombospondin 1 (TSP-1), and matrix metalloproteinase 2 (MMP-2) mRNA levels in HLE cells after stimulation with ephrin-A1-Fc by northern blotting (20 μg RNA/lane). The relative amounts of AFP, EphA1, TSP-1, and MMP-2 mRNA fragments were measured by densitometry and normalised against β-actin levels. (B) Suppression of ephrin-A1 mRNA by antisense oligonucleotide inhibited expression of AFP in Huh7 cells. Total RNA for ephrin-A1 was extracted from cells 20 hours after transfection (20 μg/lane), and total RNA for AFP was extracted from cells 30 hours after transfection (20 μg/lane). Expression levels of ephrin-A1 and AFP mRNA were quantified. The ratio of ephrin-A1 or AFP to β-actin is shown below each northern blot.
In the category of cell cycle related genes, we observed decreased expression of p21 caused by ephrin-A1. This is consistent with the results of cell proliferation assays (fig 6B ▶). Our microarray data confirmed that ephrin-A1 suppresses p21 expression. In addition, ephrin-A1 increased expression of other cell cycle related genes, such as RB family proteins (table 2 ▶).
Among angiogenesis related genes, we found a decrease in the tumour angiogenesis inhibitor TSP-1 and an increase in the tumour angiogenesis promoter angiopoietin 1 (table 2 ▶, fig 7A ▶). We also found increased expression of the TGF-β superfamily, as well as angiogenesis related vasoactive substances, such as bone morphogenetic protein (BMP), inhibin, endothelin, fibroblast growth factor receptor, and laminin.
Among cell-cell interaction related genes, we observed increased expression of Rho family members and integrins, as well as MMP-2 and MMP-12 (table 2 ▶, fig 7A ▶).
Expression of ephrin-A1 induced genes in HCC tissue
We studied the association between expression of ephrin-A1 mRNA and AFP, EphA1 receptor, EphA2 receptor, p21, TSP-1, and MMP-2 mRNA in 11 HCC tissues that overexpress AFP by northern blotting (cases 3, 4, 5, 6, 7, 9, 11, 12, 15, 16, and 18) (table 3 ▶). In all 11 of these cases, cancerous tissue showed increased expression of ephrin-A1 mRNA compared with non-cancerous tissue.
Table 3.
Expression of ephrin-A1 induced genes in 11 α-fetoprotein (AFP) overexpressing hepatocellular carcinomas
| Case | AFP RIA* (ng/gTP) | AFP † | Ephrin-A1† | EphA1† | EphA2 † | p21† | TSP-1† | MMP-2† |
| 3 | 612 | ++ | + | ++ | − − | +/− | − − | ++ |
| 4 | 2454 | ++ | ++ | ++ | − − | − − | − − | ++ |
| 5 | 185 | ++ | ++ | ++ | − − | − | +/− | ++ |
| 6 | 2776 | ++ | + | ++ | − − | − − | − − | ++ |
| 7 | 2816 | ++ | ++ | ++ | +/− | − − | − − | ++ |
| 9 | 3613 | ++ | ++ | ++ | − − | +/− | − − | ++ |
| 11 | 1526 | ++ | ++ | ++ | − − | − | − | − |
| 12 | 1684 | ++ | ++ | ++ | − − | − − | − − | + |
| 15 | 4671 | ++ | ++ | ++ | − − | +/− | − | ++ |
| 16 | 1339 | ++ | ++ | ++ | − − | − − | +/− | ++ |
| 18 | 1311 | ++ | ++ | ++ | − − | − − | +/− | + |
*AFP RIA(ng/gTP) indicates the quantity of α-fetoprotein per g total protein after quantification of AFP expression by the radioimmunoassay method.
†Relative amounts of AFP, ephrin-A1, EphA1, EphA2, p21, TSP-1, and MMP-2 mRNA fragments by northern blotting were measured by densitometry and normalised to the level of β-actin. The ratios of the cancerous mRNA expression level to non-cancerous mRNA expression level (T/N 18 ratios) are indicated (T/N ratio <0.50, − −; 0.50 <T/N ratio <0.67, −; 0.67 <T/N ratio <1.50, +/−; 1.50< T/N ratio <2.00, +; 2.00 <T/N ratio, ++).
We examined the relationship between ephrin-A1 and the EphA2 receptor because it has been reported that an autocrine loop between ephrin-A1 and the EphA2 receptor is responsible for the biological activity of ephrin-A1 in various cancers.7,9,28–32 Surprisingly, EphA2 receptor mRNA was strongly expressed in non-cancerous tissue but its expression was suppressed in cancerous tissue. This expression pattern is the opposite of the ephrin-A1 mRNA expression pattern in HCC tissues. Expression of EphA1 receptor mRNA was more enhanced in cancerous tissue than in non-cancerous tissue and was closely correlated with ephrin-A1 mRNA expression levels. Identical expression patterns for ephrin-A1 and the EphA1 receptor protein were also found by immunohistochemistry (fig 4 ▶). Because ephrin-A1 can induce tyrosine phosphorylation of EphA1 receptors in Huh7 and HLE cells (fig 6A ▶), these findings suggest that ephrin-A1-EphA1 signalling is activated in HCC.
Microarray analysis of ephrin-A1 stimulated HLE cells revealed reduced expression of p21 and TSP-1 mRNA and increased expression of MMP-2 mRNA (table 2 ▶, figs 6B ▶ and 7A ▶). These proteins play important roles in malignant proliferation, angiogenesis, invasion, and metastasis of HCC.23,33–35 In agreement with these results, p21 mRNA expression levels in cancerous tissues were significantly reduced in comparison with those in non-cancerous tissues in eight (cases 4, 5, 6, 7, 11, 12, 16, and 18) of the 11 HCC specimens that overexpressed AFP (table 3 ▶). These eight cases exhibited enhanced ephrin-A1 mRNA expression and reduced p21 mRNA expression in cancerous tissue compared with non-cancerous tissue. In both cancerous and non-cancerous tissues from the remaining three cases (cases 3, 9, and 15), p21 mRNA expression was inhibited while ephrin-A1 was strongly expressed.
TSP-1 mRNA expression was lower in cancerous tissue than in non-cancerous tissue in eight (cases 3, 4, 6, 7, 9, 11, 12, and 15) of the 11 cases of HCC that overexpressed AFP. Thus TSP-1 mRNA expression correlated negatively with ephrin-A1 expression. MMP-2 mRNA expression was higher in cancerous tissue than in non-cancerous tissue in 10 (cases 3, 4, 5, 6, 7, 9, 12, 15, 16, and 18) of the 11 cases of HCC that overexpressed AFP. This revealed a positive correlation between MMP-2 mRNA expression and ephrin-A1 mRNA expression.
Furthermore, we performed northern blotting and western blotting in order to confirm that mRNA expression of AFP, ephrin-A1, EphA1, EphA2, p21, MMP2, and TSP-1 in cancerous and non-cancerous tissues was correlated with expression of their proteins (fig 8 ▶).
Figure 8.
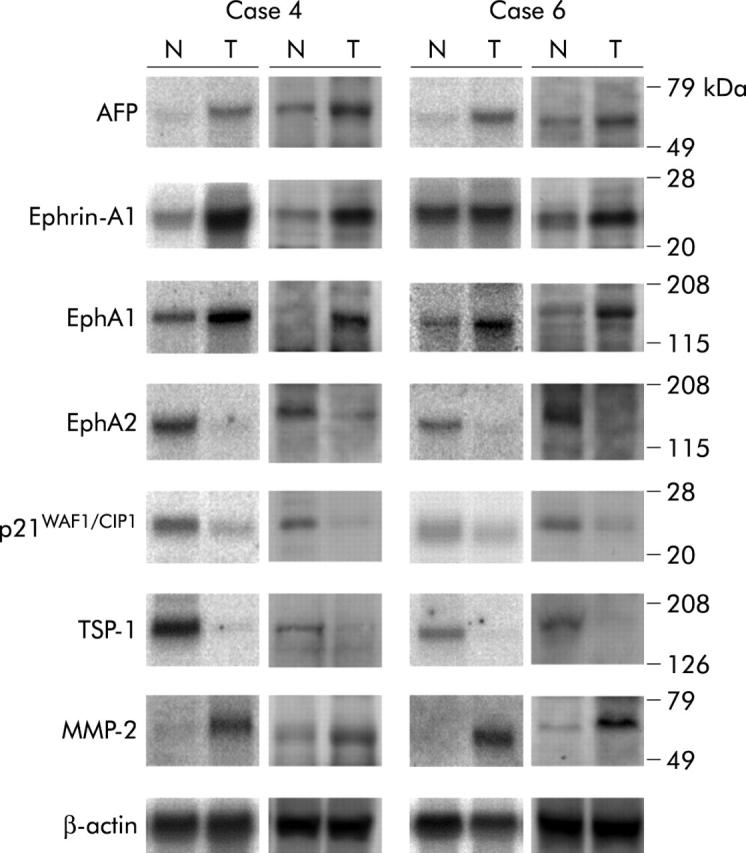
Expression of α-fetoprotein (AFP), ephrin-A1, EphA1, EphA2, p21, thrombospondin 1 (TSP-1), and matrix metalloproteinase 2 (MMP-2) mRNA and protein in AFP overexpressing HCC patients (cases 4 and 6) by northern blotting and western blotting. In each figure, the left side shows the results of northern blotting (total RNA: 20 μg/lane) while the right side shows the results of western blotting. T, tumour; N, adjacent non-cancerous tissue.
The above findings indicate that ephrin-A1 induced genes identified by cDNA microarray analysis are activated not only in cultured hepatoma cells but also in clinical cases of HCC that overexpress AFP.
DISCUSSION
Expression of ephrin-A1 was very low in normal liver tissue, slightly increased in liver tissues from patients with cirrhosis, and was further increased in HCC. Expression of ephrin-A1 was greater in poorly differentiated HCC than in well differentiated HCC (table 1 ▶, figs 2 ▶–4 ▶). Thus expression of ephrin-A1 may be related to the malignant phenotype of HCC. It is possible that local ischaemia in the cirrhotic state may induce angiogenic factors, including ephrin-A1. Immunohistochemistry showed high levels of ephrin-A1 protein in tumour tissue. Although tumour tissue includes not only hepatocytes but also non-parenchymal cells (for example, stellate cells, endothelial cells, Kupffer’s cells, and infiltrated lymphocytes), immunohistochemical staining confirmed that increased expression of ephrin-A1 was in tumour cells rather than in the surrounding normal hepatocytes (fig 4 ▶). This indicates that increased expression of ephrin-A1 in HCC tissue mainly originated from hepatocytes within the tumour.
Expression levels of ephrin-A1 were strongly correlated with those of AFP in hepatoma cell lines and human HCC tissues. The cDNA microarray analysis showed that ephrin-A1 induced AFP expression in hepatoma cells, implicating ephrin-A1 in the mechanism of AFP induction. This may explain why most patients with liver cirrhosis have elevated AFP levels without any detectable HCC. Therefore, ephrin-A1 may play an important role in the transformation of normal hepatocytes to tumour cells.
Enhanced expression of ephrin-A1 may lead to tumorigenesis by promoting abnormal cell growth, angiogenesis, invasion, or metastasis.7,8,9,10,11,12 However, the biological significance of ephrin-A1 in hepatocellular carcinogenesis has not yet been clarified. We found that reduction of ephrin-A1 expression by an antisense oligonucleotide inhibited the proliferation of ephrin-A1 overexpressing Huh7 cells and increased expression of p21, an inhibitor of cyclin dependent kinases.20–23 In contrast, inhibition of ephrin-A1 expression did not inhibit basal proliferation of HLE cells because they express little ephrin-A1. In HLE cells, ephrin-A1-Fc promoted cellular proliferation, activated the EphA1 receptor, and suppressed p21 expression. However, ephrin-A1-Fc did not promote proliferation of ephrin-A1 overexpressing Huh7 cells in which the EphA1 receptor is already activated and p21 expression is suppressed by autocrine ephrin-A1. These results indicate that ephrin-A1 promotes the proliferation of cultured hepatoma cell lines and that p21 might be involved in the regulation of the cell cycle induced by ephrin-A1.
Using cDNA microarray analysis we found that ephrin-A1 induced genes related to the cell cycle, angiogenesis, and cell-cell interactions. In agreement with the results of clonal growth assay, we observed decreased p21 expression in response to ephrin-A1. Reduced expression of p21 has been reported to participate in hepatocarcinogenesis and is associated with larger tumour size and poor prognosis in HCC patients.20–23 In HCC tissues that overexpress AFP, we found that p21 expression is suppressed in cancerous tissue compared with non-cancerous tissue and that p21 expression correlates negatively with ephrin-A1 expression. Although we also found that ephrin-A1-Fc increased expression of RB family cell cycle arresting genes, many studies have reported mutations and inactivation of RB family proteins and p53 in HCC tissue.21,22,36,37 Therefore, increased expression of these genes does not necessarily imply that they cause arrest of the cell cycle in HCC.
We found that ephrin-A1 induces expression of the angiogenesis factor angiopoietin 138 as well as angiogenesis related vasoactive substances, including BMP, inhibin, endothelin, fibroblast growth factor receptor, and laminin. We also found that ephrin-A1 inhibits the expression of the tumour angiogenesis inhibitor TSP-1. Reduced TSP-1 expression promotes angiogenesis in melanoma, lung cancer, breast cancer, and cholangiocarcinoma.34,39–41 TSP-1 expression, which correlated negatively with ephrin-A1 expression, was suppressed in HCC tissue compared with non-cancerous tissue. These results suggest that ephrin-A1 downregulates TSP-1 and acts upstream of angiogenesis related factors in promoting HCC vascular growth.
Our microarray studies also showed that ephrin-A1 increases expression of cell-cell interaction related genes, such as Rho family proteins, integrins, MMP-2, and MMP-12. Ephrin-A1 regulates cellular migration and cell-cell and cell-matrix interactions via Rho and integrin, thus influencing tumour cell motility, invasion, and metastasis in various human cancers.9–12,42,43 Changes in expression of these proteins play a key role in the invasion and metastasis of HCC. MMPs play a crucial role as proteinases during cancer invasion and metastasis, and overexpression of MMP-2 correlates closely with portal invasion and intrahepatic metastasis of HCC.33,35 We found that MMP-2 expression is higher in cancerous tissue than in non-cancerous tissue in cases of HCC that overexpress ephrin-A1. In HCC cases that underexpress ephrin-A1, MMP-2 expression is lower in cancerous tissue than in non-cancerous tissue. These findings suggest that ephrin-A1 increases expression of MMP-2, thereby promoting cancer invasion and metastasis in cases of HCC that overexpress AFP. The ephrin-A1 induced changes in gene expression of hepatoma cells in vitro recapitulate the changes in gene expression of cancerous and non-cancerous tissues from patients with HCC in vivo. This is particularly the case in HCC tissues that overexpress AFP and have high levels of ephrin-A1 expression; a large percentage (72.7%) of these HCC cases are highly malignant and poorly differentiated.
In conclusion, ephrin-A1 induces gene expression that is also activated in AFP producing hepatoma but not in non-AFP producing hepatoma. Ephrin-A1 induces AFP and changes the expression level of genes associated with tumour cell proliferation, angiogenesis, invasion, and metastasis. It is important to examine whether the findings could be applied to HCC related to non-viral liver disease, because all HCC cases in this study were related to viral liver disease. Elucidation of gene expression patterns in AFP producing HCC is important for the development of new molecular targeting therapies. These results indicate that ephrin-A1 is a promising therapeutic target in cases of HCC that overexpress AFP.
Acknowledgments
We thank Professor Kenichi Kobayashi for insightful discussion and advice. We also thank A Nakano for providing technical assistance.
Abbreviations
AFP, α-fetoprotein
HCC, hepatocellular carcinoma
RIA, radioimmunoassay
IGF-II, insulin-like growth factor II
TGF-β, transforming growth factor β
BMP, bone morphogenetic protein
TSP-1, thrombospondin 1
MMP-2, matrix metalloproteinase 2
SDS-PAGE, sodium dodecyl sulphate-polyacrylamide gel electrophoresis
Conflict of interest: None declared.
REFERENCES
- 1.Oka H, Tamori A, Kuroki T, et al. Prospective study of alpha-fetoprotein in cirrhotic patients monitored for development of hepatocellular carcinoma. Hepatology 1994;19:61–6. [PubMed] [Google Scholar]
- 2.Yamashita F, Tanaka M, Satomura S, et al. Prognostic significance of Lens culinaris agglutinin A-reactive alpha-fetoprotein in small hepatocellular carcinomas. Gastroenterology 1996;111:996–1001. [DOI] [PubMed] [Google Scholar]
- 3.Nomura F, Ohnishi K, Tanabe Y. Clinical features and prognosis of hepatocellular carcinoma with reference to serum alpha-fetoprotein levels. Analysis of 606 patients. Cancer 1989;64:1700–7. [DOI] [PubMed] [Google Scholar]
- 4.Brumm C, Schulze C, Charels K, et al. The significance of alpha-fetoprotein and other tumour markers in differential immunocytochemistry of primary liver tumors. Histopathology 1989;14:503–13. [DOI] [PubMed] [Google Scholar]
- 5.Kawai HF, Kaneko S, Honda M, et al. Alpha-fetoprotein-producing hepatoma cell lines share common expression profiles of genes in various categories demonstrated by cDNA microarray analysis. Hepatology 2001;33:676–91. [DOI] [PubMed] [Google Scholar]
- 6.Cheng N, Brantley DM, Chen J. The ephrins and Eph receptors in angiogenesis. Cytokine Growth Factor Rev 2002;13:75–85. [DOI] [PubMed] [Google Scholar]
- 7.Ogawa K, Pasqualini R, Lindberg RA, et al. The ephrin-A1 ligand and its receptor, EphA2, are expressed during tumor neovascularization. Oncogene 2000;19:6043–52. [DOI] [PubMed] [Google Scholar]
- 8.Brantley DM, Cheng N, Thompson EJ, et al. Soluble EphA receptors inhibit tumor angiogenesis and progression in vivo. Oncogene 2002;21:7011–26. [DOI] [PubMed] [Google Scholar]
- 9.Easty DJ, Guthrie BA, Maung K, et al. Protein B61 as a new growth factor: expression of B61 and up-regulation of its receptor epithelial cell kinase during melanoma progression. Cancer Res 1995;55:2528–32. [PubMed] [Google Scholar]
- 10.Easty DJ, Hill SP, Hsu MY, et al. Up-regulation of ephrin-A1 during melanoma progression. Int J Cancer 1999;84:494–501. [DOI] [PubMed] [Google Scholar]
- 11.Straume O, Akslen LA. Importance of vascular phenotype by basic fibroblast growth factor, and influence of the angiogenic factors basic fibroblast growth factor/fibroblast growth factor receptor-1 and ephrin-A1/EphA2 on melanoma progression. Am J Pathol 2002;160:1009–19. [DOI] [PMC free article] [PubMed] [Google Scholar]
- 12.Miao H, Burnett E, Kinch M, et al. Activation of EphA2 kinase suppresses integrin function and causes focal-adhesion-kinase dephosphorylation. Nat Cell Biol 2000;2:62–9. [DOI] [PubMed] [Google Scholar]
- 13.Pfeifer AM, Cole KE, Smoot DT, et al. Simian virus 40 large tumor antigen-immortalized normal human liver epithelial cells express hepatocyte characteristics and metabolize chemical carcinogens. Proc Natl Acad Sci U S A 1993;90:5123–7. [DOI] [PMC free article] [PubMed] [Google Scholar]
- 14.Mace K, Aguilar F, Wang JS, et al. Aflatoxin B1-induced DNA adduct formation and p53 mutations in CYP450-expressing human liver cell lines. Carcinogenesis 1997;18:1291–7. [DOI] [PubMed] [Google Scholar]
- 15.Desmet VJ, Gerber M, Hoofnagle JH, et al. Classification of chronic hepatitis: diagnosis, grading and staging. Hepatology 1994;19:1513–20. [PubMed] [Google Scholar]
- 16.Shirota Y, Kaneko S, Honda M, et al. Identification of differentially expressed genes in hepatocellular carcinoma with cDNA microarrays. Hepatology 2001;33:832–40. [DOI] [PubMed] [Google Scholar]
- 17.Lin SB, Hsieh SH, Hsu HL, et al. Antisense oligodeoxynucleotides of IGF-II selectively inhibit growth of human hepatoma cells overproducing IGF-II. J Biochem 1997;122:717–22. [DOI] [PubMed] [Google Scholar]
- 18.Honda M, Kaneko S, Kawai H, et al. Differential gene expression between chronic hepatitis B and C hepatic lesion. Gastroenterology 2001;120:955–66. [DOI] [PubMed] [Google Scholar]
- 19.Davis S, Gale NW, Aldrich TH, et al. Ligands for EPH-related receptor tyrosine kinases that require membrane attachment or clustering for activity. Science 1994;266:816–19. [DOI] [PubMed] [Google Scholar]
- 20.Xiong Y, Hannon GJ, Zhang H, et al. p21 is a universal inhibitor of cyclin kinases. Nature 1993;366:701–4. [DOI] [PubMed] [Google Scholar]
- 21.Qin LF, Ng IO, Fan ST, et al. p21/WAF1, p53 and PCNA expression and p53 mutation status in hepatocellular carcinoma. Int J Cancer 1998;79:424–8. [DOI] [PubMed] [Google Scholar]
- 22.Naka T, Toyota N, Kaneko T, et al. Protein expression of p53, p21WAF1, and Rb as prognostic indicators in patients with surgically treated hepatocellular carcinoma. Anticancer Res 1998;18:555–64. [PubMed] [Google Scholar]
- 23.Hui AM, Kanai Y, Sakamoto M, et al. Reduced p21(WAF1/CIP1) expression and p53 mutation in hepatocellular carcinomas. Hepatology 1997;25:575–9. [DOI] [PubMed] [Google Scholar]
- 24.Pasquale EB. The Eph family of receptors. Curr Opin Cell Biol 1997;9:608–15. [DOI] [PubMed] [Google Scholar]
- 25.Maru Y, Hirai H, Takaku F. Overexpression confers an oncogenic potential upon the eph gene. Oncogene 1990;5:445–7. [PubMed] [Google Scholar]
- 26.Hirai H, Maru Y, Hagiwara K, et al. A novel putative tyrosine kinase receptor encoded by the eph gene. Science 1987;238:1717–20. [DOI] [PubMed] [Google Scholar]
- 27.Maru Y, Hirai H, Yoshida MC, et al. Evolution, expression, and chromosomal location of a novel receptor tyrosine kinase gene, eph. Mol Cell Biol 1988;8:3770–6. [DOI] [PMC free article] [PubMed] [Google Scholar]
- 28.Miao H, Wei BR, Peehl DM, et al. Activation of EphA receptor tyrosine kinase inhibits the Ras/MAPK pathway. Nat Cell Biol 2001;3:527–30. [DOI] [PubMed] [Google Scholar]
- 29.Walker-Daniels J, Coffman K, Azimi M, et al. Overexpression of the EphA2 tyrosine kinase in prostate cancer. Prostate 1999;41:275–80. [DOI] [PubMed] [Google Scholar]
- 30.Rosenberg IM, Goke M, Kanai M, et al. Epithelial cell kinase-B61: an autocrine loop modulating intestinal epithelial migration and barrier function. Am J Physiol 1997;273:G824–32. [DOI] [PubMed] [Google Scholar]
- 31.Straume O, Akslen LA. Importance of vascular phenotype by basic fibroblast growth factor, and influence of the angiogenic factors basic fibroblast growth factor/fibroblast growth factor receptor-1 and ephrin-A1/EphA2 on melanoma progression. Am J Pathol 2002;160:1009–19. [DOI] [PMC free article] [PubMed] [Google Scholar]
- 32.Easty DJ, Herlyn M, Bennett DC. Abnormal protein tyrosine kinase gene expression during melanoma progression and metastasis. Int J Cancer 1995;60:129–36. [DOI] [PubMed] [Google Scholar]
- 33.Yamamoto H, Itoh F, Adachi Y, et al. Relation of enhanced secretion of active matrix metalloproteinases with tumor spread in human hepatocellular carcinoma. Gastroenterology 1997;112:1290–6. [DOI] [PubMed] [Google Scholar]
- 34.Kawahara N, Ono M, Taguchi K, et al. Enhanced expression of thrombospondin-1 and hypovascularity in human cholangiocarcinoma. Hepatology 1998;28:1512–17. [DOI] [PubMed] [Google Scholar]
- 35.Yamamoto H, Itoh F, Adachi Y, et al. Messenger RNA expression of matrix metalloproteinases and tissue inhibitor of metalloproteinases in human hepatocellular carcinoma. Jpn J Clin Oncol 1999;29:58–62. [DOI] [PubMed] [Google Scholar]
- 36.Nishida N, Fukuda Y, Kokuryu H, et al. Accumulation of allelic loss on arms of chromosomes 13q, 16q and 17p in the advanced stages of human hepatocellular carcinoma. Int J Cancer 1992;51:862–8. [DOI] [PubMed] [Google Scholar]
- 37.Hui AM, Li X, Makuuchi M, et al. Over-expression and lack of retinoblastoma protein are associated with tumor progression and metastasis in hepatocellular carcinoma. Int J Cancer 1999;84:604–8. [DOI] [PubMed] [Google Scholar]
- 38.Tanaka S, Mori M, Sakamoto Y, et al. Biologic significance of angiopoietin-2 expression in human hepatocellular carcinoma. J Clin Invest 1999;103:341–5. [DOI] [PMC free article] [PubMed] [Google Scholar]
- 39.Zabrenetzky V, Harris CC, Steeg PS, et al. Expression of the extracellular matrix molecule thrombospondin inversely correlates with malignant progression in melanoma, lung and breast carcinoma cell lines. Int J Cancer 1994;59:191–5. [DOI] [PubMed] [Google Scholar]
- 40.Maeda K, Nishiguchi Y, Kang SM, et al. Expression of thrombospondin-1 inversely correlated with tumor vascularity and hematogenous metastasis in colon cancer. Oncol Rep 2001;8:763–6. [DOI] [PubMed] [Google Scholar]
- 41.Sargiannidou I, Zhou J, Tuszynski GP. The role of thrombospondin-1 in tumor progression. Exp Biol Med 2001;226:726–33. [DOI] [PubMed] [Google Scholar]
- 42.Zelinski DP, Zantek ND, Stewart JC, et al. EphA2 over-expression causes tumorigenesis of mammary epithelial cells. Cancer Res 2001;61:2301–6. [PubMed] [Google Scholar]
- 43.Potla L, Boghaert ER, Armellino D, et al. Reduced expression of EphrinA1 (EFNA1) inhibits three-dimensional growth of HT29 colon carcinoma cells. Cancer Lett 2002;175:187–95. [DOI] [PubMed] [Google Scholar]