Abstract
Insulin-like growth factor-I (IGF-I) has been shown to be a potent agent in promoting the growth and differentiation of oligodendrocyte precursors, and in stimulating myelination during development and following injury. To definitively determine whether IGF-I acts directly on the cells of oligodendrocyte lineage, we generated lines of mice in which the type 1 IGF receptor gene (igf1r) was conditionally ablated either in Olig1 or proteolipid protein expressing cells (termed IGF1Rpre-oligo-ko and IGF1Roligo-ko mice, respectively). Compared to wild type mice, IGF1Rpre-oligo-ko mice had a decreased volume (by 35% to 55 %) and cell number (by 54% to 70%) in the corpus callosum (CC) and anterior commissure at 2 and 6 weeks of age, respectively. IGF1Roligo-ko mice by 25 weeks of age also showed reductions, albeit less marked, in CC volume and cell number. Unlike astrocytes, the percentage of NG2+ oligodendrocyte precursors was decreased by ~13% in 2-week-old IGF1Rpre-oligo-ko mice, while the percentage of CC1+ mature oligodendrocytes was decreased by ~24% in 6-week-old IGF1Rpre-oligo-ko mice and ~25% in 25-week-old IGF1Roligo-ko mice. The reduction in these cells is apparently a result of decreased proliferation and increased apoptosis. These results indicate that IGF-I directly affects oligodendrocytes and myelination in vivo via IGF1R, and that IGF1R signaling in the cells of oligodendrocyte lineage is required for normal oligodendrocyte development and myelination. These data also provide a fundamental basis for developing strategies with the potential to target IGF-IGF1R signaling pathways in oligodendrocyte lineage cells for the treatment of demyelinating disorders.
Keywords: IGF-I, IGF1R, Olig1, PLP, MBP, mutant mice, oligodendrocyte precursors
INTRODUCTION
A significant amount of experimental data has provided compelling evidence that insulin-like growth factor-I (IGF-I) has an important role in the growth and survival of oligodendrocyte lineage cells, as well as myelination, in the central nervous system (CNS) during development and following injury. During development IGF-I and its receptor, the type I IGF receptor (IGF1R), are widely expressed in the CNS. The peak expression of each often occurs in spatial coordination with rapid neural growth (see reviews by Anlar et al., 1999; Bondy and Cheng, 2004; D’Ercole et al., 1996; McMorris et al., 1993). Using transgenic (Tg) technology we (Mason et al., 2000;Ye et al., 1995a; 1995b;Ye et al., 2000) and others (Carson et al., 1993; Luzi et al., 2004; Mason et al., 2003) have demonstrated that brain IGF-I overexpression in Tg mice promotes myelination during development and protects against damage. Conversely, ablation of IGF-I expression (Ye et al., 2002) or inhibition of IGF-I bioactivity by ectopic expression of IGF binding protein (IGFBP)-1 in developing brain (Ni et al., 1997; Ye et al., 1995a; 1995b) decreases myelination. Consistent with these observations in mutant mice, IGF-I has been reported to promote oligodendrocyte development in the hippocampus (Hsieh et al., 2004) and to reduce cell death induced by axon transection in optic nerve (Barres et al., 1993) when delivered by IGF-I expression vectors or overexpressing cells, respectively.
While the studies mentioned above demonstrate IGF-I actions on oligodendrocyte lineage cells during development and following injury, there is as yet no in vivo experimental evidence showing a direct interaction of IGF-I and cells of the oligodendrocyte lineage. A study by Chen et al. (1998) suggested that IGF-I actions on oligodendrocytes and myelination in vivo are indirect. They (Cheng et al., 1998) showed that young adult mice with an IGF-I null mutation (IGF-I KO mice) and their littermate controls have an identical concentration of several myelin-specific proteins and a similar ratio of oligodendrocyte to projection neuron number, despite an ~25% reduction in myelin-associated galactocerebroside and sulfatide in the IGF-I KO mice. Because neurons, astrocytes and other neural cells also express the IGF1R, it was possible that IGF-I indirectly influenced oligodendrocyte lineage cells and myelination by acting on neurons and/or astrocytes, which in turn directed promoted oligodendrocyte lineage development and myelination.
A precise understanding IGF-I in vivo actions is critical to the development of therapeutic strategies using IGF-I, likely together with other agents, in treatment of demyelinating disorders. We set out, therefore, to definitively determine whether IGF-I acts directly on the cells of oligodendrocyte lineage in vivo by generating mutant mice in which the function of the IGF1R was specifically ablated in the cells of oligodendrocyte lineage, using a Cre/loxP strategy and mice carrying a Cre transgene driven either by Olig1 or PLP gene regulatory regions. Cre expression predominates in early oligodendrocyte precursors in the former Olig1-driven Tg mice and peaks in maturing oligodendrocytes in the later PLP-driven Tg mice. Here we provide evidence that IGF affects oligodendrocyte development and myelination in vivo by directly interacting with IGF1R, and that IGF1R signaling in the cells of oligodendrocyte lineage is required for normal oligodendrocyte development and myelination.
MATERIALS AND METHODS
Generation of IGF1Rpre-oligo-ko and IGF1Roligo-ko mice
Mice with ablated IGF1R expression in Olig1-expressing oligodendrocyte precursors, termed IGF1Rpre-oligo-ko mice, or in PLP-expressing oligodendrocytes, termed IGF1Roligo-ko mice, were generated by breeding mutant mice carrying a loxed exon 3 of the igf1r gene (IGF1RLox/Lox mice) with mice carrying a Cre transgene driven by either Olig1 (CreOlig1 Tg mice) or PLP (CrePLP Tg mice) gene regulatory regions, respectively. Generation and characterization of IGF1RLox/Lox mutant (Xuan et al., 2002) and CreOlig1 Tg (Lu et al., 2002) mice have been described in detail elsewhere. CrePLP Tg mice were generated using a Cre transgene driven by a rodent PLP promoter (Genoud, 2002; Goebbels, Schwab and Nave unpublished data). The mutant mice were genotyped using Southern blot hybridization and/or PCR analysis of tail DNA. Before experimentation all mutant breeder mice (i.e., CreOlig1 Tg, CrePLP Tg and IGF1RLox/Lox mice) were crossbred with C57B/6L mice for >6 generations to obtain a similar genomic background. All procedures used were consistent with the guidelines of National Institutes of Health and approved by the institutional review committees of the University of North Carolina at Chapel Hill, Harvard University, Columbia University, USA, and Max Planck Institute of Experimental Medicine, Germany.
Southern Blot Hybridization Analysis
Aliquots of genomic DNA (12-15 og) were digested with the restriction enzyme BamHI or Kpn I, fractionated on agarose gels, transferred onto a nylon membrane. The membranes were hybridized with 32P-labeled single stranded DNA probes generated using the pGEM 5Z or 7Z plasmid containing a fragment of igf1r DNA as template (Mason et al., 2003; Xuan et al., 2002), as previously reported (Ye et al., 1995a).
Western Blot Analysis
Protein was extracted as previously described (Klugmann et al., 1997), and stored at −80oC until use. Aliquots of 30 - 60 μg protein were separated on polyacrylamide gels and transferred onto PVDF membranes. Specific proteins of interest were detected using their specific antibodies: MBP (1:1,500, Chemicon Internationals, Temecula, CA); 2’,3’-cyclic nucleotide 3’-phosphodiesterase (CNP, 1:500; Chemicon); glial fibrillary acidic protein (GFAP, 1:3,000, Chemicon); IGF1R β-subunit (1:1,500, Santa Cruz Biotechnology, Santa Cruz, CA); and β-actin (1:5,000, Sigma, St. Louis, MO). The abundance of specific proteins was quantified using a computer-assisted image analysis system (Image-Pro, Media Cybermetics, Silver Spring, MD). To insure the equal loading and accuracy of changes in protein abundance, the protein levels were normalized to ß-actin abundance. The abundance of ß-actin closely paralleled the amount of total protein loaded.
Immunohistochemical Staining
After fixation with cold 4% paraformaldehyde in phosphate-buffered saline (PBS) brains were sagittally sliced at the midline and paraffin-embedded. Near midline sagittal sections (at a thickness of 6 om) of right hemispheres were subjected to immunostaining with an antibody specific for CNP (1:1,000), proteolipid protein (PLP, 1:500, Chemicon), MBP (1:800), or neurofilament heavy chain subunit (NF-H, 1:500, Chemicon). Antibody-antigen complexes were detected using an ABC kit (Vector Laboratories, Burlingame, CA) and visualized by incubation with DAB.
β-galactosidase (LacZ) Histochemistry
LacZ staining was performed using a modified method of Mercer et al. (1991). Briefly, after perfusion fixation with cold 2% paraformaldehyde and 0.2% glutaraldehyde in PBS, brains were sagittally sliced along the midline into blocks in thickness of 1- 3 mm, and further fixed in the same solution for 3 hr at 4oC. After extensive washing brain slices were subjected to LacZ staining. For LacZ and immunohistochemical double staining, LacZ stained tissues were either frozen or paraffin-embedded, sectioned (6 – 8 μm in thickness), and immunostained with an antibody specific for NG2 (1:100, a gift from Dr. Bill Stallcup, The Burnham Institute, La Jolla, CA), GFAP (1:200, Chemicon), NeuN (1:200), or GST-π (1:500, Medlabs, Dublin, Ireland). Antibody-antigen complexes were detected using an ABC kit and visualized by incubation with DAB.
Stereological Analysis of Anterior Commissure (AC), Corpus Callosum (CC), and Dentate Gyrus (DG)
Paraffin embedded left half brains were sagittally cut, and 3 - 4 sets of serial sections (12 μm in thickness) obtained. For AC and CC volume and cell number, one series of sections comprised of every 20th section was immunostained for NF-H and counterstained with hematoxylin, or was stained with hematoxylin and eosin. For DG volume and the number of granule neurons in dentate gyrus, another series also comprised of every 20th section was stained with Cresyl Violet. Assisted with Stereo Investigator software (Microbrightfield, Colchester, VT), the area of AC and CC in sections [corresponding to plates between number 55 and 143 and between 144 and 172, respectively, in the Altas Of The Mouse Brain And Spinal Cord (Sidman et al., 1971)] was measured. Similarly, the area of DG and granule cell layer in every 20th section was measured. The volume of AC, CC, DG, and granule cell layer was estimated using the formula: ∑A × T × I × 2, where ∑A = sum of area measured on each section, with T = section thickness, I = section intervals, and 2 accounts for 2 half brains. At least ten sampling points (sections) for each structure were used.
To estimate the total number of cells in each region, the cell density in each region was multiplied by its volume. To determine cell density in AC and CC, 2 - 4 stained sections from each brain (see above) were randomly selected, and cell nuclei within delineated AC and CC areas were counted. In each section the cell density in each brain region was calculated by dividing the regional cell count by its respective volume, and then the regional cell density of each brain was obtained by averaging the cell density in each section. The total number of DG granule neurons was estimated using the optic dissector method. To correct potential counting bias due to difference in cell size and nuclear splitting among mice, cell nuclear volume (>200 in each brain) was measured and a correction was performed, using Abercrombie’s method (Abercrombie, 1946).
Quantification of CC1+ Oligodendrocytes, NG2+ Oligodendrocyte Precursors, and GFAP+ Astrocytes
Fresh frozen brains were sagittally sectioned at the thickness of 8 om on a cryostat. Two sections (at least 50 μm apart to avoid counting the same cells twice) were subjected to immunostaining with CC1 (1:50, Oncogene Research Products, CA), NG2 (1:200), Ki67 (1:500, Chemicon) or GFAP (1:200, Chemicon) antibodies. For GFAP+ astrocytes in adult mutant mice, paraffin-embedded sections also were studied. Antibody-antigen complexes were detected using either an Alexa Fluor 488-conjugated anti-rabbit (Invitrogen, Carlsbad, CA) or a Cy3-conjugated anti-mouse (Jackson ImmunoResearch Laboratories, West Grove, PA) secondary antibody. Cell nuclei were counterstained with nuclear dye 4,6-diamidine-2’-phenylindole dihydrochloride (DAPI, Invitrogen). Immuno-labeled cells each with a clear nucleus (>400 cells in each section) were scored on the digitally captured images. The number of NG2+, CC1+, and GFAP+ cells was calculated as the percentage of the total number of cells judged by nuclei. The nuclear volume of NG2+, CC1+, and GFAP+ cells (~200 cells for each cell type in each brain) was measured, using the nucleator method and Stereo Investigator software. No significant difference in nuclear volume was observed between control and mutant mice, therefore, no correction was required.
Terminal Uridine Nucleic End Labeling (TUNEL)
TUNEL was performed using an In Situ Cell Death Detection Kit (Roche Applied Science, Indianapolis, IN) following the manufacturer’s protocol; then paraffin-embedded or fresh-frozen near mid-sagittal sections were double-stained with either a mouse anti-GFAP antibody (1:500, Chemicon), NG2 or Iba-1 antibody (1:200, Wako Chemicals, Richmond, VA), followed by a Cy3 or an Alexa Fluor 594 conjugated secondary antibody, and DAPI. Labeled cells (>880) in each section were scored on the digitally captured images.
Statistics
Student-t test was used with the assistance of software SigmaStat for Windows (SPSS, Inc., Chicago, IL).
RESULTS
Oligodendrocyte precursors specific expression of the CreOlig1 transgene has been previously reported (Lu et al., 2002). Data from one of our laboratories also show that the CrePLP transgene is specifically expressed in the cells of oligodendrocyte lineage, and the tempo-spatial expression pattern correlates closely with that of endogenous PLP (Goebbels, Schwab and Nave, unpublished data). Cre-mediated deletion of E3 of the igf1r gene in the brains of developing and adult IGF1Rpre-oligo-ko and IGF1Roligo-ko mice was confirmed using Southern blot analysis of brain genomic DNA and RT-PCR of brain mRNA (Figure 1). Excision of E3 results in a deletion of most of the IGF-I binding domain coding region and a reading frame-shift mutation thereafter in the igf1r gene. Using an antibody specific for IGF1R β subunit (IGF1Rβ), Western immunoblot analysis of brains of IGF1Rpre-oligo-ko mice at postnatal day 0 (a time approximately at the peak of IGF1R expression (Werner et al., 1989) demonstrated that IGF1R abundance was decreased by ~2 fold, as compared to wild type (WT) controls.
Figure 1.
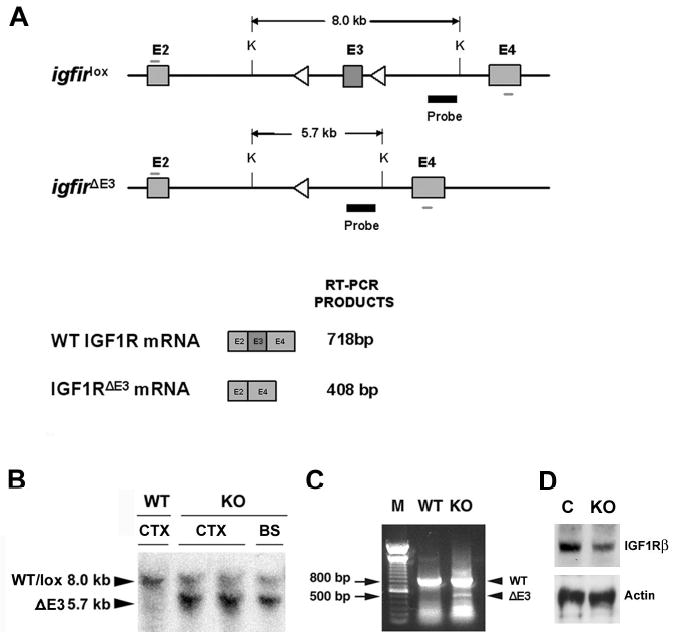
Schematic diagram of mutant igf1r genes, and representative genotype analyses of conditional igf1r mutant (KO) and wildtype (WT) mice. Panel A. Schematic diagram of mutant igf1r genes with loxed or deleted E3 (upper diagrams) and their mRNAs (lower diagrams). The exons of loxed (igf1rlox) or E3-deleted (igf1r E3) igf1r genes are represented by shaded boxes and their number labeled above each exon. Lox sequences were represented by open triangles. The position of a DNA probe used for Southern blot analysis is indicated by a thick black line, and the primers for RT-PCR are indicated by the short thin lines above E2 and below E4. The size of the Southern blot-detected Kpn I (K)-digested DNA fragment in igf1rlox and E3 igf1r E3 gene is indicated above the DNA fragment. The schematic diagram is not drawn to scale. Panel B. Representative Southern blot analysis of brain genomic DNA from a 2-week-old IGF1Rpre-oligo-ko mouse and a WT mouse. The sizes of DNA bands detected are indicated by two arrowheads at the left side of the image. CTX = cerebral cortex; BS = brainstem. Panel C. Representative RT-PCR analysis of mRNA isolated from CTX of a 2-week-old IGF1Roligo-ko mouse and a WT mouse. DNA ladder markers (M) were loaded on the left side of the gel, and 500 and 800 base pair (bp) bands are indicated by two arrows. Note that the bands at the bottom of both WT and KO lanes are DNA primer dimers. Panel D. A representative Western immunoblot showing the abundance of the IGF1R-β subunit in whole brain of a newborn IGF1Rpre-oligo-ko mouse (KO) and a control mouse (C).
Genotyping of postnatal mice showed the occurrence of IGF1Rpre-oligo-ko and IGF1Roligo-ko follows Mandel’s distribution, i.e., ~25% were IGF1Rpre-oligo-ko or IGF1Roligo-ko mice, when IGF1RLox/Lox mice were bred with CreOlig1/IGF1RLox/Wt mice or CrePLP/IGF1RLox/Wt mice, respectively. These findings indicate that there is no prenatal lethality. Postnatal growth of both IGF1Rpre-oligo-ko and IGF1Roligo-ko mice also was apparently normal, albeit that their body weights tended to be lighter than that of their littermates (data not shown).
To compare the expression pattern of the CreOlig1 and CrePLP transgenes and their capacity to mediate DNA recombination during development, CreOlig1 and CrePLP Tg mice were bred with lacZactin-stop Tg mice which carry a β-galactosidase (LacZ) reporter transgene linked to a chicken actin promoter followed by a floxed “stop” DNA sequence (Araki et al, 1995). Deletion of the “stop” DNA sequence mediated by Cre leads to activation and expression of the LacZ reporter gene. Thus, the effects of CreOlig1 and CrePLP gene expression in double Tg mice, i.e. CreOlig1/lacZactin-stop and CrePLP/lacZactin-stop Tg mice, can be determined using LacZ histochemical staining. In CreOlig1 Tg mice abundant LacZ staining was observed throughout most brain regions, especially in white matter, at the first week of postnatal life, a time when few precursors have developed into mature oligodendrocytes in forebrain (Figure 2). Sparse motor neurons in brainstem (e.g., in facial nuclei), as well as Purkinje cells in cerebellum, however, also were positive for both LacZ and NeuN (data not shown). These findings are consistent with predominant CreOlig1 expression in oligodendrocyte precursors and pre-mature oligodendrocytes, as reported by Lu et al (2002), as well as with the expression of the endogenous Olig1 gene in the brains of mice (Lu et al., 2000) and humans (Jakovcevski and Zecevic, 2005).
Figure 2.
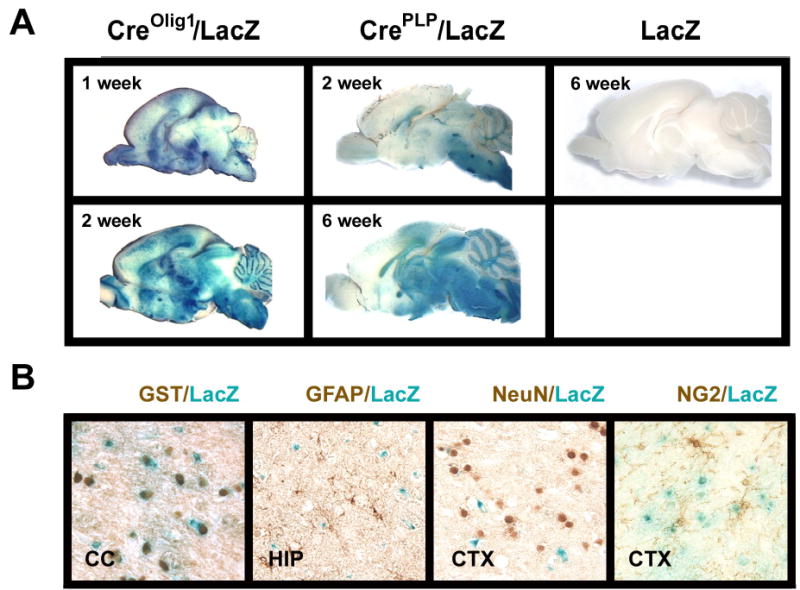
Developmental (panel A) and cellular (panels B) expression pattern of CreOlig1 and CrePLP transgenes. Panel A. Brains of CreOlig1/LacZactin-stop (left two panels) and CrePLP/LacZactin-stop (middle two panels) double Tg mice, as well as a LacZactin-stop Tg mouse (right panel), at postnatal age of 1 week, 2 weeks, or 6 weeks, were subjected to LacZ histochemical staining. The 6-week-old LacZactin-stop Tg mouse exhibited no LacZ staining. Panel B. LacZ and immunohischemical double-staining of brain sections of 4-week-old CrePLP/LacZactin-stop mice. CC= corpus callsoum, HIP=hippocampus, and CTX = cerebral cortex.
In contrast, LacZ expression was nearly undetectable in 1-week-old CrePLP Tg mice. By the second week of life LacZ expression in CrePLP Tg mice was readily seen in the brain stem, CB and diencephalon (Figure 2). With increasing age LacZ staining was significantly increased in CrePLP Tg mice (Figure 2). To further confirm cell specific expression of CrePLP transgene, LacZ stained brain sections derived from 4-week-old CrePLP/lacZactin-stop Tg mice were double-stained with antibody specific for neural cell markers. As Figure 2, panel B shows, intense LacZ staining co-localized with the mature oligodendrocyte marker GST-π, but not with GFAP, an astrocyte marker, or NeuN, a neuron marker (except for cerebellar Purkinje cells that were positive for LacZ). In addition, little LacZ and NG2 co-localization was observed in CrePLP Tg mice (Figure 2). These data are consistent with previous data from one of our laboratories (Goebbels, Schwab and Nave, unpublished data), and strongly indicate that CrePLP transgene expression, and the DNA recombination it mediates, predominately occurs in mature oligodendrocytes.
While there was no apparent abnormality in their body growth, the brain growth of IGF1Rpre-oligo-ko mice was retarded (Figure 3, panel A). Compared to WT mice, the brain weightsof homozygous IGF1Rpre-oligo-ko mice were significantly reduced, being ~92, ~88 and ~82% of WT controls at 1, 2 and 6 weeks of their postnatal life, respectively. IGF1Roligo-ko mice also exhibited a decreased brain weight. Compared to IGF1Rpre-oligo-ko mice, the reduction occurred much later, being first observed at 3 weeks of age, although not statistically significant (Figure 3, panel B). When brain growth was analyzed as brain to body weight ratios, the developmental patterns of brain growth retardation observed in each line of mutant mice was nearly identical to that when only brain weight was analyzed (data not show). WT mice and the mice carrying Cre transgene and IGF1RLox mutation exhibited no apparent difference in brain growth, nor did they exhibit any apparent morphological abnormalities. Data from these latter mice, therefore, were grouped for analysis, hereafter termed control mice.
Figure 3.
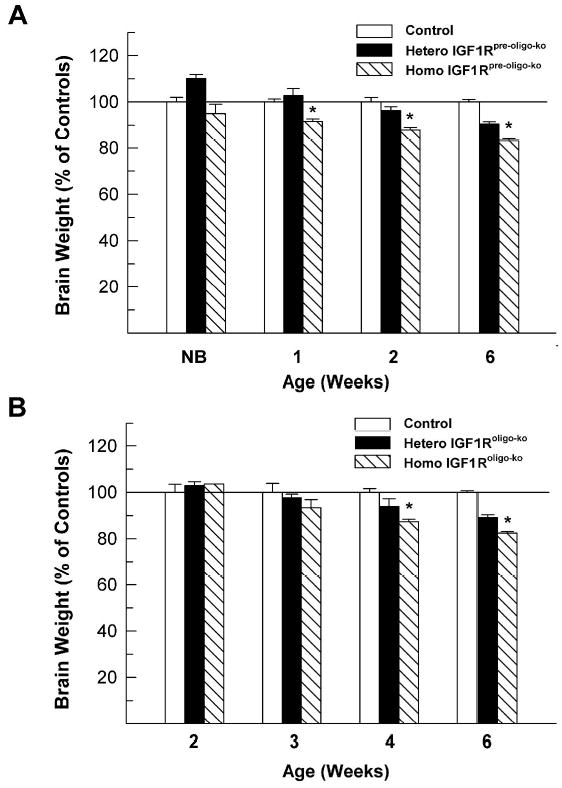
Brain weights of IGF1Rpre-oligo-ko (panel A) and IGF1Roligo-ko (panel B) mutant mice during development. Brain weight is expressed as percentage of controls, and values are means ± SE from 6 -10 mice. A line is drawn at 100% to facilitate comparison. NB = newborn. *, P < 0.01, compared to WT.
To test whether blunting of IGF-I expression during early development affects myelination, we first immunohistochemically assessed the abundance of three major myelin-specific proteins, i.e., PLP, MBP and CNP, in the developing brains of IGF1Rpre-oligo-ko and IGF1Roligo-ko mice. Compared to their littermate controls, both IGF1Rpre-oligo-ko and IGF1Roligo-ko mice exhibited a marked reduction in the intensity of immunostaining. Representative photomicrographs of brain PLP and MBP immunostaining in developing and adult IGF1Rpre-oligo-ko and IGF1Roligo-ko mice, as well as their littermate controls, are shown in Figures 4 and 5, respectively. Compared to their 2-week-old littermate controls that exhibit ample yellowish-brown PLP immunostaining in CTX (Figure 4, panel A) and bundles of PLP positive fibers in the CB (Figure 4, panel C), 2-week-old IGF1Rpre-oligo-ko mice exhibited a marked reduction in PLP immunostaining in these regions (Figure 4, panels B and D). In contrast, immunostaining for heavy-chain neurofilament (NF-H) did not show significant differences between IGF1Rpre-oligo-ko and control mice (Figure 4, panels G and H). During the next several weeks the intensity of PLP immunoreactivity increased significantly in all brain regions of both IGF1Rpre-oligo-ko and control mice. PLP immunoreactivity in IGF1Rpre-oligo-ko mice (Figures 4, panel F), however, remained significantly reduced, compared to control mice (Figures 4, panel E). Immunostaining of MBP and CNP in IGF1Rpre-oligo-ko mice was reduced in a similar pattern during development (data not shown).
Figure 4.
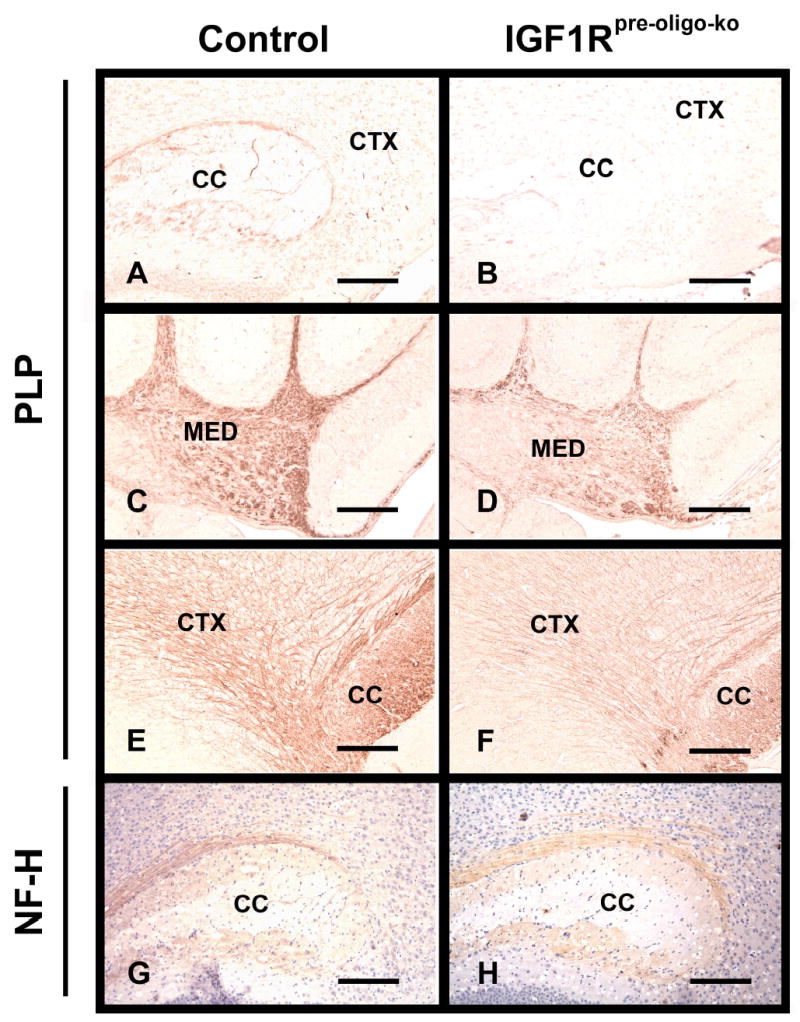
PLP and NF-H immunostaining in brains of IGF1Rpre-oligo-ko mice (panels B, D, F and H) and their littermate controls (panels A, C, E and G). Brains from 2-week-old (panels A, B, C, D, G and H) and 6-week-old (panels E and F) IGF1Rpre-oligo-ko mice and their littermate controls were stained with PLP antibody (panels A, B, C, D, E and F) or NF-H antibody (panels G and H). After NF-H immunostaining, sections were counterstained with hematoxylin. CTX = cerebral cortex, CC = corpus callosum, and MED = cerebellar medulla. The scale bar represents 200 μm in panels A, B, C, D, G and H, and 100 μm in E and F, respectively.
Figure 5.
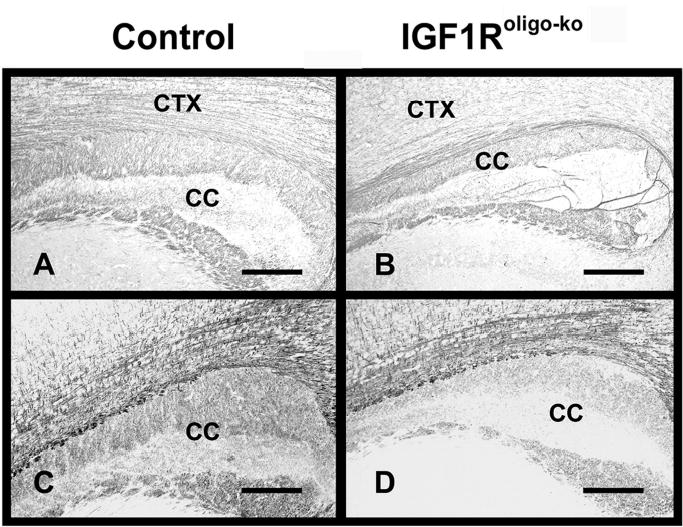
PLP immunostaining brains of IGF1Roligo-ko mice and their littermate controls. Brains from IGF1Roligo-ko mice (panels B and D) and their littermate controls (panels A and C) at 4 weeks (panels A and B) or 25 weeks (panels C and D) of age were stained with PLP antibody. CTX = cerebral cortex, and CC = corpus callosum. The scale bar represents 200 μm.
IGF1Roligo-ko also exhibited a decrease in immunostaining intensity for myelin-specific proteins (Figure 5). Compared with IGF1Rpre-oligo-ko mice, however, the reduction in myelin protein immunoreactivity occurred much later during development and was not evident until 3–4 weeks of postnatal life (Figure 5, panel B). The myelin protein immunostaining in IGF1Roligo-ko mice was further reduced at 25 week of age (Figure 5, panel D).
Next we used Western immunoblot analysis to quantify the changes in CTX MBP and CNP protein abundance. At 6 weeks of age, 4 major MBP bands (~14 kDa, ~17 kDa, ~18 kDa and ~21 kDa) and a single CNP band (~50 kDa) are readily detected (Figure 6). When compared to littermate controls, the abundance of both MBP (when the abundance of all 4 MBP bands is combined for quantification) and CNP proteins in IGF1Rpre-oligo-ko mice was decreased by ~40% and ~70%, respectively (Figure 6, panels A and C), while GFAP abundance in IGF1Rpre-oligo-ko mice was only moderately reduced and the change did not meet statistical significance. Six-week-old IGF1Roligo-ko mice also exhibited 20 – 30 % reduction in MBP and CNP abundance in CTX (Figure 6, panels B and D).
Figure 6.
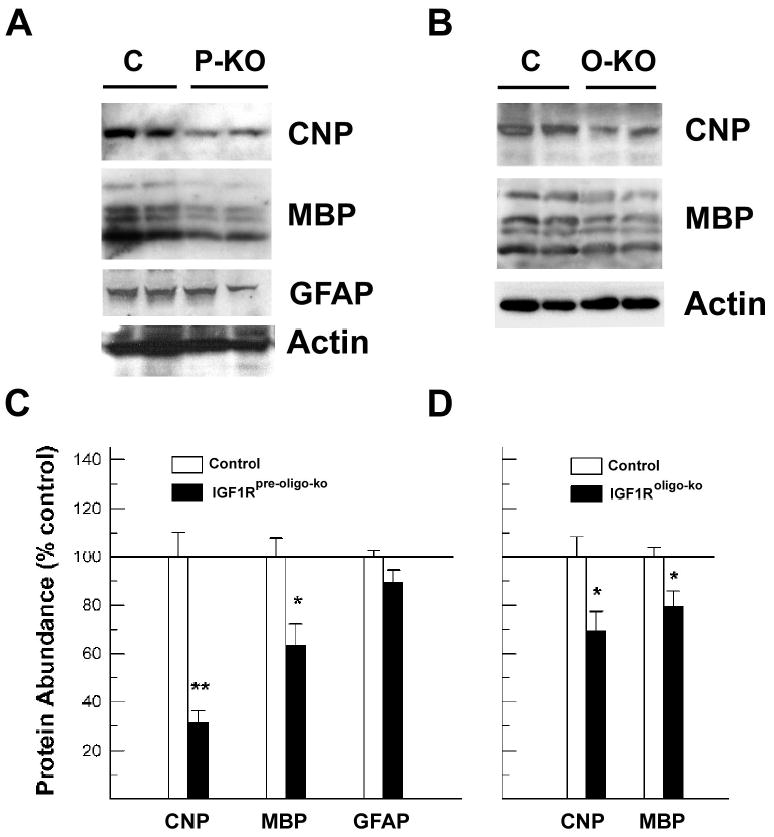
Western immunoblot analysis of CNP, MBP and GFAP in the cerebral cortex of IGF1Rpre-oligo-ko and IGF1Roligo-ko mice. Panel A. Representative Western immunoblot of CNP, MBP and GFAP protein in 2-week-old IGF1Rpre-oligo-ko (P-KO) mice and controls (C). Panel B. Representative Western immunoblot of CNP and MBP protein in 6-week-old IGF1Roligo-ko (O-KO) mice and littermate controls (C). Panel C. Quantitative analysis of CNP, MBP and GFAP protein abundance in 2-week-old IGF1Rpre-oligo-ko mice. Panel D. Quantitative analysis of CNP and MBP protein abundance in 6-week-old IGF1Roligo-ko mice. The protein abundance is expressed as percentage of that in controls, and values are mean ± SE of 3 –5 samples. A line is drawn at 100% to facilitate comparison. *, P < 0.05; **, P < 0.01, compared to controls.
The impact of deletion of IGF1R signaling in the growth of glial cells was determined by comparing the number of cells in CC and AC, two myelin-rich regions that contain primarily glial cells (oligodendrocyte precursors, mature oligodendrocytes, astrocytes, and microglia) and neuronal axons. Photomicrographs of 2-week-old IGF1Rpre-oligo-ko mice (Figure 7, panels C and D) revealed an apparent decrease in CC and AC size and the cell density in these two regions, compared to littermate controls (Figure 7, panels A and B). Further quantitative analysis showed that in IGF1Rpre-oligo-ko mice the volumes of CC and AC were decreased by ~35% to ~55%, while the cell density was reduced by ~27% to ~35% (Figure 7, panel E). As a result there were significant reductions in the total number of cells in the CC (by~54%), the anterior portion of the AC (by ~70%), and the posterior portion of the AC (~60%). In 6-week-old IGF1Rpre-oligo-ko mice the CC volume, cell density and total cell number remained reduced by ~35%, ~27% and ~56%, respectively (Figure 7, panel E). IGF1Roligo-ko mice at 25-weeks of age also had significant decreases in CC volume, cell density and total number of cells (Table 1).
Figure 7.
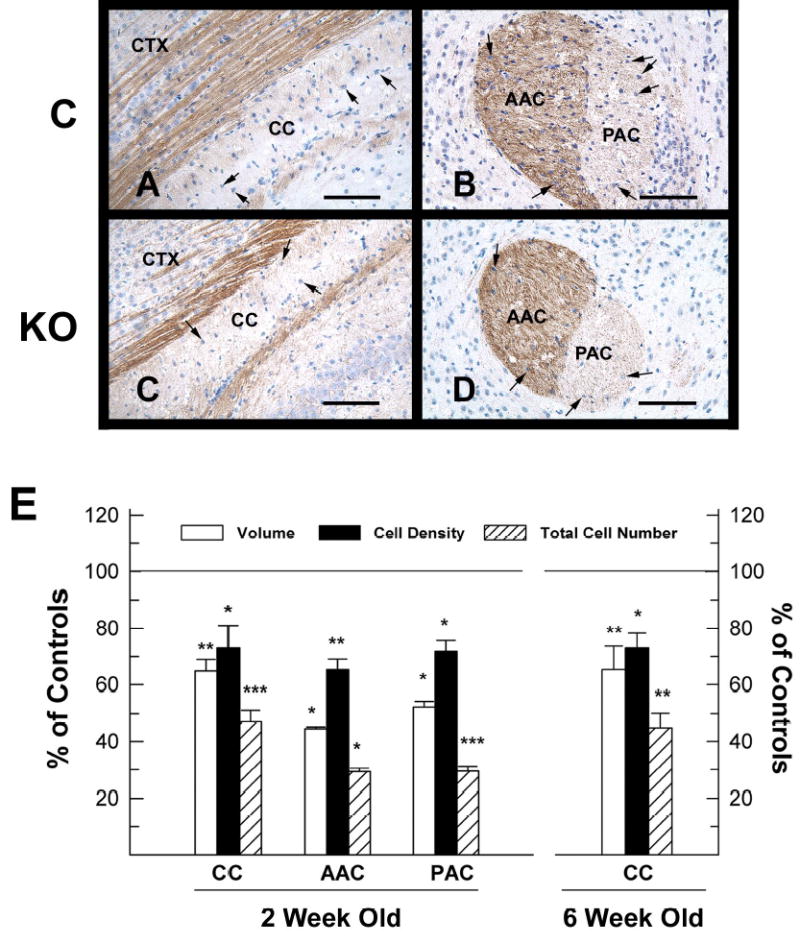
Volume, cell density and cell number in corpus callosum (CC) and anterior commissure (AC) of 2-week-old IGF1Rpre-oligo-ko mice and their littermate controls. Panels A-D. Representative photomicrographs of NF-H immunostained CC (panels A and C) and AC (panels B and D) from an IGF1Rpre-oligo-ko mutant (panels C and D) and a control (panels A and B) mouse. Note that the number of purple/blue-stained cell nuclei is significantly decreased in the CC, anterior (AAC) and posterior (PAC) portions of AC of the IGF1Rpre-oligo-ko mouse. CTX= cerebral cortex and HIP = hippocampus. The scale bars = 100 μm. Panel E. Quantification of the volume, cell density and total number of cells in CC and AC. Values are expressed as percentage of control, and represent mean ± SE of 3 –6 samples. *, P < 0.05; **, P < 0.01; and ***, P< 0.001, compared to controls.
Table 1.
Corpus callosum (CC) volume, cell density and total cell number in IGF1Roligo-ko mice and their littermate controls at 25 weeks of age.
| Control | KO | Change | |
|---|---|---|---|
| CC volume (mm3) | 3.12 ± 0.18 | 2.40 ± 0.08 * | ⇓ ~23% |
| Cell density (×1,000/mm3) | 307.99 ± 7.44 | 282.78 ± 5.57 | ⇓ ~ 8% |
| Total cell number (×1,000) | 962.92 ± 75.83 | 680.12 ± 34.29 * | ⇓ ~29% |
Values represent mean ± SE of 3 mice from each group.
, P < 0.05, compared to controls.
To further assess the cellular growth of the oligodendrocyte lineage in IGF1Rpre-oligo-ko mice, the percentage of NG2+ oligodendrocyte precursors, proliferating NG2+ oligodendrocyte precursors, and CC1+ mature oligodendrocytes in CC was determined. Compared to their littermate controls, the percentage of NG2+ oligodendrocyte precursors in IGF1Rpre-oligo-ko mice was decreased by ~13% at 2 weeks of age and was further reduced by ~17% at 6 weeks of age (Figure 8, panel C). At 2 weeks of age NG2 cells represented 19.40 ± 0.13 % of all CC cells in IGF1Rpre-oligo-ko mice, compared to 22.61 ± 0.22 % (P<0.05) in controls, while at 6 weeks of age they represented 5.64 ± 0.07 % of total CC cells in mutant mice compared to 6.76 ± 0.35 % (P<0.05) in controls. In line with the changes in NG2+ oligodendrocyte precursor, the percentage of proliferating NG2+ oligodendrocyte precursors, as identified by double-immunolabeling with NG2 and Ki67, a protein that is expressed in the G1, G2 and M phases of cycling cells, was significantly reduced by ~30% in IGF1Rpre-oligo-ko mice at 2 weeks of age (Figure 8). Examination of 1-week-old IGF1Rpre-oligo-ko mice also showed a similar reduction in the number of NG2 and Ki67 double-labeled cells (data not shown).
Figure 8.
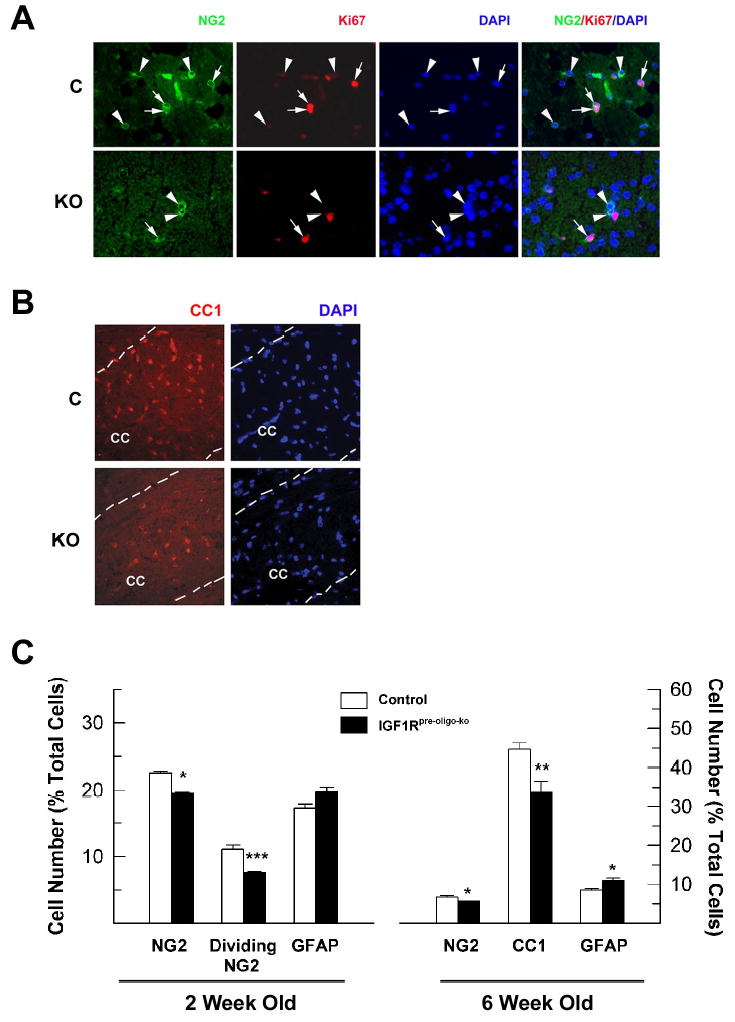
The number of NG2+ oligodendrocyte precursors, CC1+ oligodendrocytes and GFAP+ astrocytes in the CC of IGF1Rpre-oligo-ko mutant (KO) and their littermate controls (C). Panel A. Representative photomicrographs of double NG2 and Ki67 immunostaining from a 2-week-old IGF1Rpre-oligo-ko and a control mouse. Arrowheads indicate NG2+ precursors, and arrows point to cells positive for both NG2 and Ki67. Photomicrographs of merged NG2, Ki67, and DAPI images are shown in the right column. NG2 and Ki67 double-labeled cells are more numerous in the control brain. Panel B. Representative photomicrographs of CC1 immunostaining of CC from a 6-week-old IGF1Rpre-oligo-ko mutant mouse and a littermate control mouse. Dotted lines outline the CC. Panel C. Quantification of NG2+, proliferating NG2+, CC1+ and GFAP+ cells in the CC of IGF1Rpre-oligo-ko mice at 2 and 6 weeks of age. Values represent mean ± SE of 3 – 4 mice from each group. *, P < 0.05; **, P < 0.02; ***, P < 0.01; compared to controls.
Consistent with changes in the number of NG2+ oligodendrocyte precursors, the number of CC1+ mature oligodendrocytes was also significantly reduced in the CC of 6-week-old IGF1Rpre-oligo-ko mice (Figure 8, panels B and C). Compared to controls, the percentage of CC1+ mature oligodendrocytes was reduced by ~24% in IGF1Rpre-oligo-ko mice (Figure 8). Similarly, in the CC of 25-week-old IGF1Roligo-ko mice the number of CC1+ mature oligodendrocytes was reduced by ~24% (Figure 9). In a single experiment of PLP in situ hybridization, 6-week-old IGF1Roligo-ko mice also showed a markedly decreased number of PLP mRNA+ oligodendrocytes in CC (data not shown).
Figure 9.
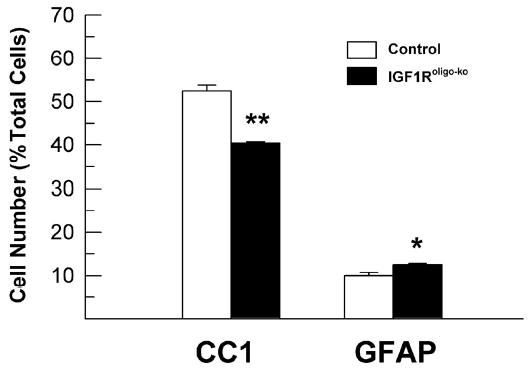
The number of CC1+ and GFAP+ cells in the CC of IGF1Roligo-ko mice at 25 weeks of age. Values represent mean ± SE of 3 - 4 mice from each group. *, P < 0.05; **, P < 0.001, compared to controls.
To examine whether other cell types were affected, astrocytes in CC and neurons in the granule layer of dentate gyrus were determined. We selected dentate gyrus to facilitate our counting of neuronal number because its cellular architecture is well defined and granule neurons constitute more than 95% of its cells. In contrast to the marked decreases in total number of glial cells and percentage of NG2+ oligodendrocyte precursors, the percentage of astrocytes in the CC, as judged by GFAP immunostaining, was increased by ~15% in 2-week-old IGF1Rpre-oligo-ko mice and by ~25% in 6-week-old IGF1Rpre-oligo-ko mice (Figure 8, panel C). Similarly, the percentage of GFAP+ astrocytes was increased by ~25% in the CC of 25-week-old IGF1Roligo-ko mice (Figure 9). As with reduced brain and CC size (Figures 3 and 7), the volume of both dentate gyrus and granule neuron layer was reduced by ~27% in 2-week-old IGF1Rpre-oligo-ko mice. When compared to littermate control mice, the total number of dentate gyrus granule neurons was only moderately reduced (by ~10%), and the reduction did not meet statistical significance (Table 2).
Table 2.
Volume of dentate gyrus (DG) and granule cell layer (GCL), and total granule cell (GC) number in 2-week-old IGF1Rpre-oligo-ko mice (KO) and their littermate controls.
| Controls | KO | |
|---|---|---|
| DG Volume (mm3) | 4.58 ± 0.13 | 3.35 ± 0.20 * |
| GCL Volume (mm3) | 1.15 ± 0.04 | 0.83 ± 0.05 * |
| Total GC number (×1,000) | 940.66 ± 25.58 | 830.10 ± 38.14 |
Values represent mean ± SE of 3 - 4 mice from each group.
, P < 0.01, compared to controls.
To determine whether blunting IGF1R function impacts cell survival in IGF1Rpre-oligo-ko mice and whether increased cell death contributes to the reduction in oligodendrocyte precursors in the CC of IGF1Rpre-oligo-ko mice, we performed TUNEL labeling. Unlike the paws of a rat at age of embryonic day (E) 16, which undergoes substantial morphological remodeling and has abundant apoptotic cells (Figure 10, panel A), only a very small fraction of CC cells (~0.4%) were TUNEL positive in control mice at 2 weeks of age. This finding is consistent with the data of Barres et al.(Barres et al., 1992) who showed that rat optic nerve has ~0.2% apoptotic oligodendrocytes during the same development period. Double immunostaining with glial cell markers showed that TUNEL labeling did not co-localize with GFAP or Iba-1 immunostaining, and less than 8% TUNEL labeled cells were positive for NG2 immunostaining (Figure 10, panel A). The low abundance of TUNEL and NG2 immuno-labeled cells made it impossible to accurately perform detailed quantification. Nonetheless, when compared to their littermate controls, the number of apoptotic cells in the CC was increased by ~65% in 2-weeks-old IGF1Rpre-oligo-ko mice and by ~37% in newborn mutant mice, respectively (Figure 10, panel B).
Figure 10.
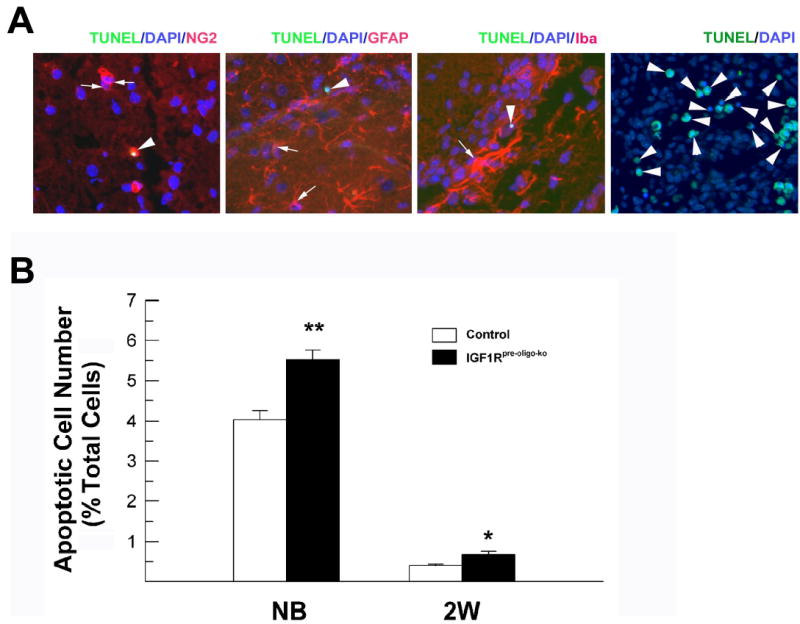
Apoptotic cells in the CC of IGF1Rpre-oligo-ko mice and their littermates. Panel A. Representative photomicrographs of double TUNEL staining and NG2, GFAP, or Iba-1 immunostaining in the CC of an IGF1Rpre-oligo-ko mouse at 2 weeks of age. A section from an E16 rat paw was used as a positive control for TUNEL staining (right panel). Arrowheads in each panel indicate TUNEL-labeled apoptotic cells. Arrows point to NG2+, GFAP+ and Iba-1+ cells, respectively, in the left three panels. Note that in the left-most panel an arrowhead points to a TUNEL and NG2 double-labeled cell. Panel B. Quantification of apoptotic cells in the CC of newborn and 2-week-old IGF1Rpre-oligo-ko mice and their controls. Values represent mean ± SE of 3 - 4 mice from each group. *, P < 0.05; **, P < 0.01, compared to controls.
DISCUSSION
This study evaluates the direct in vivo actions of IGF-I mediated by the IGF1R on oligodendrocyte lineage cells and myelination, using two mutant mouse models. In one mutant mouse line IGF1R function is blunted in Olig1-expressing oligodendrocyte precursors (IGF1Rpre-oligo-ko mice) and in the other it is blunted in PLP-expressing mature oligodendrocytes (IGF1Roligo-ko mice). We demonstrate that disrupting IGF-IGF1R signaling in oligodendrocyte precursors during early development results in significant reductions in: 1) the size of the brain, AC and CC, two myelin-rich regions, 2) the number of cells in the AC and CC, 3) the number of NG2+ oligodendrocyte precursors, and 4) the number of proliferating NG2+ oligodendrocyte precursors. Furthermore, we show that CC1+ mature oligodendrocytes and myelin-specific proteins CNP and MBP are markedly reduced in adult IGF1Rpre-oligo-ko mice. In contrast, there is no or little change in the abundance of the astrocyte-specific protein GFAP and the neuron-specific protein NF, or in the number of granule neurons in these mice.
Similarly, IGF1Roligo-ko mice exhibit significant decreases in brain weight, AC and CC size and cell number, and CNP and MBP abundance. These reductions only become evident 3-4 weeks after birth, and are 2 to 3 weeks later than in IGF1Rpre-oligo-ko mice. The time of the observed reduction in myelination in IGF1Roligo-ko mice is concurrent with the time of peak expression of the endogenous PLP gene and the CrePLP transgene, and this is several weeks later compared to the expression of the endogenous Olig1 gene and the CreOlig1 transgene. Although low levels of the CrePLP transgene is likely expressed in the embryonic brain and in oligodendrocyte precursors, as is the case with the endogenous PLP gene (Spassky et al., 2000), our unpublished data and data obtained in this study clearly demonstrate that CrePLP transgene expression closely follows the pattern of endogenous PLP gene expression (Jordan et al., 1989; Milner et al., 1985; Shiota et al., 1989; Sorg et al., 1987; Ikenaka et al., 1992; also see review by Nave and Milner, 1989; Spassky et al., 2000), and the DNA recombination it mediates occurs predominately in myelinating oligodendrocytes during late postnatal development, resulting in a later reduction in myelination in IGF1Roligo-ko mice, as compared to IGF1Rpre-oligo-ko mice. As with IGF1Rpre-oligo-ko mice, we observed little or no change in the abundance of the astrocyte-specific protein GFAP, the neuron-specific protein NF, or the number of DG granule neurons in IGF1Roligo-ko mice. Each of these findings is consistent with the cellular specificity of the Cre transgene expression (Lu et al, 2002; Goebbels, Schwab and Nave, unpublished data; and this study) and the disruption of the IGF1R gene function. Taken together, our data strongly indicate that IGF directly and specifically affects oligodendrocytes and myelination in vivo through the IGF1R, and that IGF1R signaling in both oligodendrocyte precursors and mature oligodendrocytes is required for normal oligodendrocyte development and myelination.
Previously Efstratiadis and associates (Baker et al., 1993; Liu et al., 1993; Louvi et al., 1997) used genetic methodology and definitively demonstrated that the IGF1R mediates most, if not all, of IGF-I and IGF-II actions. Although both murine IGF-I and IGF-II are expressed beginning in prenatal life, each exhibits a distinct expression pattern in the CNS. While IGF-II is expressed at a high level in most brain regions during embryonic development, its expression decreases with increasing age. By birth little IGF-II mRNA can be detected in mouse brain, with the exceptions of meninges and choroid plexuses (Ayer-LeLievre et al., 1991; see review by Popken et al., 2005). In contrast, brain IGF-I expression begins somewhat later in the embryo, reaches its peak expression during the first week of postnatal life, and remains at relative high levels throughout life (Bach MA et al., 1996;Bartlett et al., 1992;Bondy, 1991; Popken et al., 2005). It appears very likely, therefore, that deletion of IGF1R function mediated by the CreOlig1 expression in IGF1Rpre-oligo-ko mice blunts the signaling of both IGF-I and IGF-II in oligodendrocyte precursors, as well as in mature oligodendrocytes, during embryonic and early postnatal development. Because of a much later expression of the CrePLP transgene, it also seems likely that the CrePLP–mediated IGF1R mutation predominately blocks IGF-I action in the later developing and adult brain. These conclusions are supported by data from our previous studies and those of others showing: 1) oligodendrocytes and their precursors express IGF1R in vivo and in vitro (Bondy et al., 1990; Mason and Goldman, 2002; Masters et al., 1991; Saneto et al., 1988); and 2) addition of IGFs to cultures promotes proliferation, survival and/or maturation of oligodendrocyte lineage cells and stimulates myelin-associated protein gene expression and myelin production (Barres et al., 1992; McMorris et al., 1986; McMorris and Dubois-Dalcq, 1988; Mozell and McMorris, 1991; Saneto et al., 1988; Ye and D’Ercole, 1999).
We observed that the percentage of NG2+ oligodendrocyte precursors and CC1+ oligodendrocytes is only moderately decreased (by 15 to 24%) in the CC of 2- and 6-week-old IGF1Rpre-oligo-ko mice. Because the total number of CC cells was reduced by ~54% and ~44% in 2-and 6-week-old IGF1Rpre-oligo-ko mice, respectively, however, the total number of NG2+ oligodendrocyte precursors is estimated to be reduced by ~60% and ~54% in the CC of IGF1Rpre-oligo-ko mice at these ages. Similarly, it is estimated that total CC CC1+ oligodendrocytes in adult IGF1Rpre-oligo-ko mice is decreased by ~56%.
Reduction in the number of oligodendrocytes and their precursors in mice with blunted IGF1R appears to be due to a decreased proliferation of precursors and an increase in their apoptosis. In IGF1Rpre-oligo-ko mice the number of proliferating NG2+ oligodendrocyte precursors, as judged by double-immunolabeling with Ki67, a marker for cycling cells, is significantly reduced. These data are consistent with our previous in vitro data and those of others showing that IGF-I promotes proliferation of neural cells, including cultured A2B5+ oligodendrocyte precursors (see review by Popken et al., 2005; Ye and D’Ercole, 2006). Our data also are in line with the data of Hodge et al. (2004), who showed that overexpressing IGF-I in the brains of transgenic embryos increases proliferation of neuronal progenitors by decreasing duration of the cell cycle and by increasing the percentage of daughter cells re-entering the cell cycle. In neuronal progenitors the decreased duration of the cell cycle induced by IGF-I results entirely from a shortened G1 phase (Hodge et al., 2004). Whether IGF-I also promotes cell cycle progression through G1 phase in oligodendrocyte precursors in vivo, however, remains to be determined. Nonetheless, our data strongly support a role for IGF-IGF1R signaling in the proliferation of oligodendrocyte precursors during early development.
An increase in the death of oligodendrocyte lineage cells also may contribute to the decreased number in oligodendrocytes and their precursors in these mutant mice. The number of apoptotic cells was observed to be increased in IGF1Rpre-oligo-ko mice. Only a small fraction of these apoptotic cells were immuno-positive for NG2, and we were unable to determine the identity of the remaining apoptotic cells using the astrocyte marker GFAP and microglia marker Iba-1. It is likely that dying apoptotic cells are removed rapidly and/or their antigenic marker(s) are lost, resulting in few cells capable of reacting to antibodies. The paucity of cells that are both positive for apoptotic and oligodendrocyte markers made it impossible for us to accurately determine the number of apoptotic oligodendrocyte lineage cells in these mutant mice. Nonetheless, the finding that the number of apoptotic cells was increased in the CC of IGF1Rpre-oligo-ko mice suggests that IGF-IGF1R signaling promotes survival of glial cells in the developing CC.
While IGF1Rpre-oligo-ko mice have a similar number of granule neurons, they also exhibit a decreased number of GFAP+ cells in CC, in spite of a modest increase in their percentage of total cells. The latter results from the dramatic reduction in the total number of CC cells. Mice with ablated IGF1R specifically in PLP-expressing cells (IGF1Roligo-ko mice), on the other hand, exhibit a much less dramatic reduction in the number of CC cells (by ~29%) and GFAP+ cells (by ~5%). The reason(s) that account for the reduction in GFAP+ cells in IGF1Rpre-oligo-ko mice remains to be further investigated, and is beyond the scope of the current study; however, we speculate that because oligodendrocytes/astrocytes may come from the same glial precursors (Herrera et al., 2001; Gregori et al., 2002; Rao et al., 1998), ablating IGF1R in Olig1 expressing oligodendrocyte/astrocyte precursors blunts both oligodendrocyte and astrocyte precursor development. Alternatively, ablation of IGF1R in the cells of oligodendrocyte lineage indirectly reduces GFAP+ cells in some other way(s), such as compromising oligodendrocyte-axon interactions that in turn lead to decreased proliferation and recruitment of astrocytes by axons.
In summary, we have demonstrated that blunting IGF-IGF1R signaling in oligodendrocytes and their precursors significantly retards postnatal oligodendrocyte growth and myelination. Our data indicate that IGF directly and specifically affects oligodendrocytes and myelination in vivo during development, and that IGF-IGF1R signaling in the cells of oligodendrocyte lineage is required for normal oligodendrocyte development and myelination. Our data also provide foundation for strategies to target IGF-IGF1R signaling pathway in oligodendrocyte lineage cells for treatment of demyelinating disorders. Whether IGF-IGF1R interaction promotes the growth of oligodendrocyte precursors and mature oligodendrocytes in vivo by utilizing the same intracellular molecular mechanisms, however, remains to be determined. Of notice, mice with blunted IGF1R expression in oligodendrocyte lineage cells maintain significant number of oligodendrocytes and myelination. Whether mechanism(s) that compensates loss of IGF1R exists also requires further investigation.
Acknowledgments
This work was supported by NIH grants RO1 NS038891 and RO1 NS048868. We thank Dr. Billie Moats-Staats for critic reading, Dr. Bill Stallcup for the NG2 antibody and Ms. Wei Pan, Haley Meyer and Rebecca Bigler for their technical assistance.
References
- Abercrombie M. Estimation of nuclear population from microtome section. Anat Rec. 1946;94:274–329. doi: 10.1002/ar.1090940210. [DOI] [PubMed] [Google Scholar]
- Anlar B, Sullivan KA, Feldman EL. Insulin-like growth factor-I and central nervous system development. Horm Metab Res. 1999;31:120–125. doi: 10.1055/s-2007-978708. [DOI] [PubMed] [Google Scholar]
- Araki K, Araki M, Miyazaki J, Vassalli P. Site-specific recombination of a transgene in fertilized eggs by transient expression of Cre recombinase. Proc Natl Acad Sci USA. 1995;92:160–164. doi: 10.1073/pnas.92.1.160. [DOI] [PMC free article] [PubMed] [Google Scholar]
- Ayer-LeLievre C, Stahlbom PA, Sara VR. Expression of IGF-I and -II mRNA in the brain and craniofacial region of the rat fetus. Development. 1991;111:105–115. doi: 10.1242/dev.111.1.105. [DOI] [PubMed] [Google Scholar]
- Bach MA, Shen-Orr Z, Lowe WL, Jr, Roberts CT, Jr, LeRoith D. Insulin-like growth factor I mRNA levels are developmentally regulated in specific regions of the rat brain. Brain Res Mol Brain Res. 1996:48. doi: 10.1016/0169-328x(91)90054-2. [DOI] [PubMed] [Google Scholar]
- Baker J, Liu J-P, Robertson EJ, Efstratiadis A. Role of Insulin-like Growth Factors in embryonic and postnatal growth. Cell. 1993;75:73–82. [PubMed] [Google Scholar]
- Barres BA, Hart IK, Coles HS, Burne JF, Voyvodic JT, Richardson WD, Raff MC. Cell death and control of cell survival in the oligodendrocyte lineage. Cell. 1992;70:31–46. doi: 10.1016/0092-8674(92)90531-g. [DOI] [PubMed] [Google Scholar]
- Barres BA, Jacobson MD, Schmid R, Sendnter M, Raff MC. Does oligodendrocyte survival depend on axons. Curr Biol. 1993;3:489–497. doi: 10.1016/0960-9822(93)90039-q. [DOI] [PubMed] [Google Scholar]
- Bartlett WP, Li X-S, Williams M. Expression of IGF-I mRNA in the murine subventricular zone during postnatal development. Mol Brain Res. 1992;12:285–291. doi: 10.1016/0169-328x(92)90131-t. [DOI] [PubMed] [Google Scholar]
- Bondy CA. Transient IGF-I gene expression during the maturation of functionally related central projection neurons. J Neurosci. 1991;11:3442–3455. doi: 10.1523/JNEUROSCI.11-11-03442.1991. [DOI] [PMC free article] [PubMed] [Google Scholar]
- Bondy CA, Cheng CM. Signaling by insulin-like growth factor 1 in brain. Eur J Pharmacol. 2004;490:25–31. doi: 10.1016/j.ejphar.2004.02.042. [DOI] [PubMed] [Google Scholar]
- Bondy CA, Werner H, Roberts CT, Jr, LeRoith D. Cellular pattern of insulin-like growth factor-I (IGF-I) and type I IGF receptor gene expression in early organogenesis: Comparison with IGF-II gene expression. Mol Endocrinol. 1990;4:1386–1398. doi: 10.1210/mend-4-9-1386. [DOI] [PubMed] [Google Scholar]
- Carson MJ, Behringer RR, Brinster RL, McMorris FA. Insulin-like growth factor I increases brain growth and central nervous system myelination in transgenic mice. Neuron. 1993;10:729–740. doi: 10.1016/0896-6273(93)90173-o. [DOI] [PubMed] [Google Scholar]
- Cheng CM, Joncas G, Reinhardt RR, Farrer R, Quarles R, Janssen J, McDonald MP, Crawley JN, Powell-Braxton L, Bondy C. Biochemical and morphometric analysis show that myelination in the insulin-like growth factor 1 null brain is proportionate to its neuronal composition. J Neurosci. 1998;18:5673–5681. doi: 10.1523/JNEUROSCI.18-15-05673.1998. [DOI] [PMC free article] [PubMed] [Google Scholar]
- D’Ercole AJ, Ye P, Calikoglu AS, Gutierrez-Ospina G. The role of the insulin-like growth factors in the central nervous system. Mol Neurobiol. 1996;13:227–255. doi: 10.1007/BF02740625. [DOI] [PubMed] [Google Scholar]
- Genoud S, Lappe-Siefke C, Goebbels S, Radtke F, Aguet M, Scherer SS, Suter U, Nave KA, Mantei N. Notch1 control of oligodendrocyte differentiation in the spinal cord. J Cell Biol. 2002;158:709–718. doi: 10.1083/jcb.200202002. [DOI] [PMC free article] [PubMed] [Google Scholar]
- Gregori N, Proschel C, Noble M, Mayer-Proschel M. The tripotential glial-restricted precursor (GRP) cell and glial development in the spinal cord: generation of bipotential oligodendrocyte-type-2 astrocyte progenitor cells and dorsal-ventral differences in GRP cell function. J Neurosci. 2002;22:248–256. doi: 10.1523/JNEUROSCI.22-01-00248.2002. [DOI] [PMC free article] [PubMed] [Google Scholar]
- Herrera J, Yang H, Zhang SC, Proschel C, Tresco P, Duncan ID, Luskin M, Mayer-Proschel M. Embryonic-derived glial-restricted precursor cells (GRP cells) can differentiate into astrocytes and oligodendrocytes in vivo. Exp Neurol. 2001;171:11–21. doi: 10.1006/exnr.2001.7729. [DOI] [PubMed] [Google Scholar]
- Hodge RD, D’Ercole AJ, O’Kusky JR. Insulin-like growth factor-I accelerates the cell cycle by decreasing G1 phase length and increases cell cycle reentry in the embryonic cerebral cortex. J Neurosci. 2004;24:10201–10210. doi: 10.1523/JNEUROSCI.3246-04.2004. [DOI] [PMC free article] [PubMed] [Google Scholar]
- Hsieh J, Aimone JB, Kaspar BK, Kuwabara T, Nakashima K, Gage FH. IGF-1 instructs multipotent adult neural progenitor cells to become oligodendrocytes. J Cell Biol. 2004;164:111–122. doi: 10.1083/jcb.200308101. [DOI] [PMC free article] [PubMed] [Google Scholar]
- Ikenaka K, Kagawa T, Mikoshiba K. Selective expression of DM-20, an alternatively spliced myelin proteolipid protein gene product, in developing nervous system and in nonglial cells. J Neurochem. 1992;58:2248–2253. doi: 10.1111/j.1471-4159.1992.tb10970.x. [DOI] [PubMed] [Google Scholar]
- Jakovcevski I, Zecevic N. Olig transcription factors are expressed in oligodendrocyte and neuronal cells in human fetal CNS. J Neurosci. 2005;25:10064–10073. doi: 10.1523/JNEUROSCI.2324-05.2005. [DOI] [PMC free article] [PubMed] [Google Scholar]
- Jordan C, Friedrich V, Jr, Dubois-Dalcq M. In situ hybridization analysis of myelin gene transcripts in developing mouse spinal cord. J Neurosci. 1989;9:248–257. doi: 10.1523/JNEUROSCI.09-01-00248.1989. [DOI] [PMC free article] [PubMed] [Google Scholar]
- Klugmann M, Schwab MH, Puhlhofer A, Schneider A, Zimmermann F, Griffiths IR, Nave KA. Assembly of CNS myelin in the absence of proteolipid protein. Neuron. 1997;18:59–70. doi: 10.1016/s0896-6273(01)80046-5. [DOI] [PubMed] [Google Scholar]
- Liu J-P, Baker J, Perkins AS, Robertson EJ, Efstratiadis A. Mice carrying null mutations of the genes encoding Insulin-like Growth Factor I (Igf-1) and type 1 IGF receptor. Cell. 1993;75:59–72. [PubMed] [Google Scholar]
- Louvi A, Accili D, Efstratiadis A. Growth-promoting interaction of IGF-II with the insulin receptor during mouse embryonic development. Developmental Biology. 1997;189:33–48. doi: 10.1006/dbio.1997.8666. [DOI] [PubMed] [Google Scholar]
- Lu QR, Yuk D, Alberta JA, Zhu Z, Pawlitzky I, Chen J, McMahon AP, Stiles CD, Rowitch DH. Sonic hedgehog-regulated oligodendrocyte lineage genes encoding bHLH proteins in the mammalian central nervous system. Neuron. 2000;25:317–329. doi: 10.1016/s0896-6273(00)80897-1. [DOI] [PubMed] [Google Scholar]
- Lu QR, Sun T, Zhu ZM, Ma N, Garcia M, Stiles CD, Rowitch DH. Common developmental requirement for Olig function indicates a motor neuron/oligodendrocyte connection. Cell. 2002;109:75–86. doi: 10.1016/s0092-8674(02)00678-5. [DOI] [PubMed] [Google Scholar]
- Luzi P, Zaka M, Rao HZ, Curtis M, Rafi MA, Wenger DA. Generation of transgenic mice expressing insulin-like growth factor-1 under the control of the myelin basic protein promoter: increased myelination and potential for studies on the effects of increased IGF-1 on experimentally and genetically induced demyelination. Neurochem Res. 2004;29:881–889. doi: 10.1023/b:nere.0000021233.79076.72. [DOI] [PubMed] [Google Scholar]
- Mason JL, Goldman JE. A2B5+ and O4+ cycling progenitors in the adult forebrain white matter respond differentially to PDGF-AA, FGF-2, and IGF-1. Mol Cell Neurosci. 2002;20:30–42. doi: 10.1006/mcne.2002.1114. [DOI] [PubMed] [Google Scholar]
- Mason JL, Xuan S, Dragatsis I, Efstratiadis A, Goldman JE. Insulin-like growth factor (IGF) signaling through type 1 IGF receptor plays an important role in remyelination. J Neurosci. 2003;23:7710–7718. doi: 10.1523/JNEUROSCI.23-20-07710.2003. [DOI] [PMC free article] [PubMed] [Google Scholar]
- Mason JL, Ye P, Suzuki K, D’Ercole AJ, Matsushima GK. Insulin-like growth factor-1 inhibits mature oligodendrocyte apoptosis during primary demyelination. J Neurosci. 2000;20:5703–5708. doi: 10.1523/JNEUROSCI.20-15-05703.2000. [DOI] [PMC free article] [PubMed] [Google Scholar]
- Masters BA, Werner H, Roberts CT, Jr, LeRoith D, Raizada MK. Insulin-like growth factor I (IGF-I) receptors and IGF-I action in oligodendrocytes from rat brains. Regulatory Peptides. 1991;33:117–131. doi: 10.1016/0167-0115(91)90207-w. [DOI] [PubMed] [Google Scholar]
- McMorris FA, Dubois-Dalcq M. Insulin-like growth factor I promotes cell proliferation and oligodendroglial commitment in rat glial progenitor cells developing in vitro. J Neurosci Res. 1988;21:199–209. doi: 10.1002/jnr.490210212. [DOI] [PubMed] [Google Scholar]
- McMorris FA, Mozell RL, Carson MJ, Shinar Y, Meyer RD, Marchetti N. Regulation of oligodendrocyte development and central nervous system myelination by insulin-like growth factors. [Review] Ann NY Acad Sci. 1993;692:321–334. doi: 10.1111/j.1749-6632.1993.tb26247.x. [DOI] [PubMed] [Google Scholar]
- McMorris FA, Smith TM, DeSalvo S, Furlanetto RW. Insulin-like growth factor I/somatomedin C: a potent inducer of oligodendrocyte development. Proc Natl Acad Sci USA. 1986;83:822–826. doi: 10.1073/pnas.83.3.822. [DOI] [PMC free article] [PubMed] [Google Scholar]
- Mercer EH, Hoyle GW, Kapur RP, Brinster RL, Palmiter RD. The dopamine P-hydroxylase gene promoter directs expression of E. Coli LacZ to sympathetic and other neurons in adult transgenic mice. Neuron. 1991;7:703–716. doi: 10.1016/0896-6273(91)90274-4. [DOI] [PubMed] [Google Scholar]
- Milner RJ, Lai C, Nave KA, Lenoir D, Ogata J, Sutcliffe JG. Nucleotide sequences of two mRNAs for rat brain myelin proteolipid protein. Cell. 1985;42:931–939. doi: 10.1016/0092-8674(85)90289-2. [DOI] [PubMed] [Google Scholar]
- Mozell RL, McMorris FA. Insulin-like growth factor I stimulates oligodendrocyte development and myelination in rat brain aggregate cultures. J Neurosci Res. 1991;30:382–390. doi: 10.1002/jnr.490300214. [DOI] [PubMed] [Google Scholar]
- Nave KA, Milner RJ. Proteolipid proteins: structure and genetic expression in normal and myelin-deficient mutant mice. [Review] Critical Rev Neurobiol. 1989;5:65–91. [PubMed] [Google Scholar]
- Ni W, Rajkumar K, Nagy JI, Murphy LJ. Inpaired brain development and reduced astrocyte response to injury in transgenic mice expressing IGF binding protein-1. Brain Res. 1997;769:97–107. doi: 10.1016/s0006-8993(97)00676-8. [DOI] [PubMed] [Google Scholar]
- Popken GJ, Dechert-Zeger M, Ye P, D’Ercole AJ. Brain development. Adv Exp Med Biol. 2005;567:187–220. doi: 10.1007/0-387-26274-1_8. [DOI] [PubMed] [Google Scholar]
- Rao MS, Noble M, Mayer-Proschel M. A tripotential glial precursor cell is present in the developing spinal cord. Proc Natl Acad Sci USA. 1998;95:3996–4001. doi: 10.1073/pnas.95.7.3996. [DOI] [PMC free article] [PubMed] [Google Scholar]
- Saneto RP, Low KG, Melner MH, De Vellis J. Insulin/insulin-like growth factor I and other epigenetic modulators of myelin basic protein expression in isolated oligodendrocyte progenitor cells. J Neurosci Res. 1988;21:210–219. doi: 10.1002/jnr.490210213. [DOI] [PubMed] [Google Scholar]
- Shiota C, Miura M, Mikoshiba K. Developmental profile and differential localization of mRNAs of myelin proteins (MBP and PLP) in oligodendrocytes in the brain and in culture. Brain Res Dev Brain Res. 1989;45:83–94. doi: 10.1016/0165-3806(89)90010-2. [DOI] [PubMed] [Google Scholar]
- Sidman RL, Abervine JB, Pierec ET. Altas of the mouse brain and spinal cord. Cambridge, MA: Harvard University Press; 1971. [Google Scholar]
- Sorg BA, Smith MM, Campagnoni AT. Developmental expression of the myelin proteolipid protein and basic protein mRNAs in normal and dysmyelinating mutant mice. J Neurochem. 1987;49:1146–1154. doi: 10.1111/j.1471-4159.1987.tb10005.x. [DOI] [PubMed] [Google Scholar]
- Spassky N, Olivier C, Perez-Villegas E, Goujet-Zalc C, Martinez S, Thomas J, Zalc B. Single or multiple oligodendroglial lineages: a controversy. [Review] [19 refs] GLIA. 2000;29:143–148. [PubMed] [Google Scholar]
- Werner H, Woloschhak M, Adamo M, Shen-Orr, Brberts CT, Jr, LeRoith D. Developmental regulation of the rat insulin-like growth factor I receptor gene. Proc Natl Acad Sci USA. 1989;86:7451–7455. doi: 10.1073/pnas.86.19.7451. [DOI] [PMC free article] [PubMed] [Google Scholar]
- Xuan S, Kitamura T, Nakae J, Politi K, Kido Y, Fisher PE, Morroni M, Cinti S, White MF, Herrera PL, Accili D, Efstratiadis A. Defective insulin secretion in pancreatic beta cells lacking type 1 IGF receptor. J Clin Invest. 2002;110:1011–1019. doi: 10.1172/JCI15276. [DOI] [PMC free article] [PubMed] [Google Scholar]
- Ye P, Carson J, D’Ercole AJ. In vivo actions of insulin-like growth factor-I (IGF-I) on brain myelination: studies of IGF-I and IGF binding protein-1 (IGFBP-1) transgenic mice. Journal of Neuroscience. 1995a;15:7344–7356. doi: 10.1523/JNEUROSCI.15-11-07344.1995. [DOI] [PMC free article] [PubMed] [Google Scholar]
- Ye P, Carson J, D’Ercole AJ. Insulin-like growth factor-I influences the initiation of myelination: studies of the anterior commissure of transgenic mice. Neurosci Lett. 1995b;201:235–238. doi: 10.1016/0304-3940(95)12194-3. [DOI] [PubMed] [Google Scholar]
- Ye P, D’Ercole AJ. Insulin-like growth factor I protects oligodendrocytes from tumor necrosis factor-α-induced injury. Endocrinology. 1999;140:3063–3072. doi: 10.1210/endo.140.7.6754. [DOI] [PubMed] [Google Scholar]
- Ye P, D’Ercole AJ. Insulin-like growth factor actions during development of neural stem cells and progenitors in the central nervous system. J Neurosci Res. 2006;83:1–6. doi: 10.1002/jnr.20688. [DOI] [PubMed] [Google Scholar]
- Ye P, Lee K-H, D’Ercole AJ. Insulin-like growth factor-I (IGF-I) protects myelination from undernutritional insult: Studies of transgenic mice overexpressing IGF-I in brain. J Neurosci Res. 2000;62:700–708. doi: 10.1002/1097-4547(20001201)62:5<700::AID-JNR9>3.0.CO;2-1. [DOI] [PubMed] [Google Scholar]
- Ye P, Li L, Richards RG, DiAugustine RP, D’Ercole AJ. Myelination is altered in insulin-like growth factor-I null mutant mice. J Neurosci. 2002;22:6041–6051. doi: 10.1523/JNEUROSCI.22-14-06041.2002. [DOI] [PMC free article] [PubMed] [Google Scholar]


