Abstract
Background: Carbonic anhydrase IX (MN/Ca9) catalyses the reversible metabolism of carbon dioxide to carbonic acid and has also been linked to malignant transformation and hypoxia in various cancers.
Aims: To assess the expression and biological role of Ca9 in gastric cancer.
Methods: Using gastric cancer cell lines and tissues, we studied expression of Ca9 by western blot analysis, immunohistochemistry, and polymerase chain reaction. Biological changes after Ca9 transfection and after treatment with 5′-azadeoxycytidine were also analysed in cancer cell lines.
Results: Non-cancerous tissues strongly expressed Ca9 with membranous localisation. In contrast, Ca9 expression was frequently lost in gastric cancers (p<0.001). However, gastric cancers that retained Ca9 expression in cancer cells exhibited a shorter postoperative survival (p = 0.028). In vitro analysis revealed that loss of Ca9 expression in gastric cancer cell lines was restored after treatment with 5′-azadeoxycytidine and was associated with increased invasion (p<0.01). Moreover, AGS cells transfected with Ca9 exhibited significantly increased cell proliferation (p<0.05).
Conclusions: A subgroup of gastric cancers retain Ca9 expression in cancer cells at the invasion front. While loss of Ca9 expression is regulated in part by methylation, re-expression of Ca9 is associated with increased invasion, supporting the hypothesis that increased Ca9 expression may contribute to invasion and thus advanced disease and tumour progression in a subset of gastric cancers.
Keywords: gastric cancer, anhydrase, pH, acidosis, invasion
The carbonic anhydrase family (Ca) includes 11 catalytically active zinc metalloenzymes involved in the reversible hydration-dehydration of carbon dioxide: CO2+H2O⇔HCO3−+H+. These molecules participate in a variety of physiological and biological processes and show remarkable diversity in tissue distribution, subcellular localisation, and biological functions.1,2 Carbonic anhydrase IX (Ca9) is one of the most recently identified isoenzymes.3,4 Because of Ca9 overexpression in transformed cell lines and in several human malignancies, it has been recognised as a tumour associated antigen and linked to the development of human cancers.5–7 Ca9 is a glycosylated transmembrane Ca isoform with a unique N terminal proteoglycan-like extension.4 Through transfection studies it has been demonstrated that Ca9 can induce the transformation of 3T3 cells.4 Furthermore, recent studies have revealed that Ca9 not only participates in cell adhesion but can also be induced in hypoxia via the hypoxia inducible factor 1 (HIF-1) protein binding to the hypoxia responsive element of the Ca9 promoter.8,9 In various cancers,10,11 Ca9 expression correlates positively with levels of hypoxia in tumours.10 Furthermore, overexpression of Ca9 is associated with a poor prognosis in lung, breast, and cervical cancer patients.12–14 However, high levels of Ca9 have also been found in the gastric mucosa.15,16 In contrast with non-gastric tumours, Ca9 has been reported to be absent or reduced in gastric carcinoma cell lines and in primary gastric tumours.15,16 Interestingly, Ca9 deficient mice develop gastric hyperplasia which is associated with increased proliferation,17 raising the question of whether the putative pathophysiological role of Ca9 in gastric cancer development and progression is different from that observed in cancers of non-gastric origin.
MATERIALS AND METHODS
Subjects
Tumorous and corresponding non-tumorous paraffin embedded tissue specimens from 59 patients (20 females, 39 males; age range 41–84 years) were used for immunohistochemical analyses.18 The tumour and non-tumour bearing part of the stomach was analysed histologically and all non-tumour bearing areas of the stomach were confirmed to have no cancer cell infiltration. Patients underwent gastric cancer surgery consecutively; there was no prior selection of these patients. For molecular analyses, gastric cancer and corresponding non-lesional tissue were obtained immediately after surgery from 18 patients with gastric cancer (two females, 16 males; age range 43–82 years). The study was approved by the human subjects committee of the University of Magdeburg, Germany. Tumours were classified according to the WHO classification.19
Cell lines
Gastric cancer cell lines MKN45, MKN28, AGS, N87, and Hela cells were obtained from Riken Cell Bank (Tsukuba, Japan) and the American Type Culture Collection (ATCC, Rockville, Maryland, USA). All cell lines, except AGS and Hela cells, were maintained in RPMI medium (Gibco BRL, Rockville, Maryland, USA) with 10% fetal bovine serum. The AGS cell line was kept in F-12K medium with 10% fetal bovine serum and Hela cells were cultured in Dulbecco’s modified Eagle medium (Gibco BRL) supplemented with 10% fetal bovine serum.
Transient transfection assay
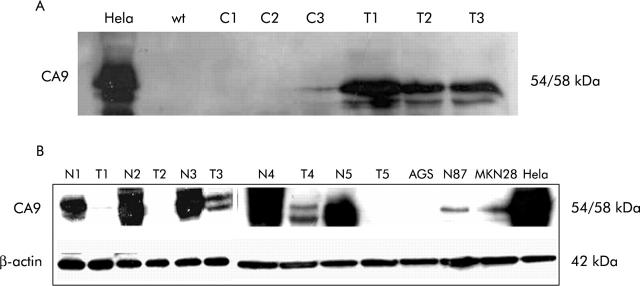
AGS gastric cancer cells were seeded at a density of 2×10⁵ cells/60 mm dish. Cells were transfected 24 hours later with a pSG5C vector (5 μg) containing the human Ca9 cDNA (1.5 kb, KpnI/SacI site)3 or an empty pCMVβ vector (control B), or were incubated with Transfectam reagent alone (control A) (Promega, Mannheim, Germany), according to the manufacturer’s recommendations, with the optimal volume/weight ratio of Transfectam reagent/DNA of 2 μl/μg DNA. Protein expression was confirmed after 24, 48, and 72 hours by western blot analysis (fig 1A ▶).
Figure 1.
(A) Western blot analysis after carbonic anhydrase IX (Ca9) transfection of AGS cells. Untreated Hela cells served as a positive control (Hela). Wild-type (wt) AGS cells exhibited no Ca9 expression. Transfection of AGS cells with the empty vector resulted in no detectable Ca9 protein levels after one and two days (C1, C2) After three days, low Ca9 expression was noted which may have been induced by intercellular contact and thus was cell density dependent (C3). AGS cells transfected with Ca9 cDNA exhibited significant Ca9 protein levels after one, two, and three days (T1–T3). (B) Western blot analysis also revealed reduced Ca9 protein levels in gastric cancer (T) compared with non-neoplastic gastric mucosa (N). Ca9 was identified as a protein of 54 and 58 kDa. β-Actin protein levels were assessed for standardisation of protein levels. No Ca9 protein was detected in AGS cells whereas low levels were found in N87 and MKN28 cells. Hela cells served as a control.
Treatment of cells with 5-aza-dC
Cells were seeded at a density of 1×10⁶ cells/60 mm dish. Twenty four hours later, cells were treated with 5 μM 5′-azadeoxycytidine (5-aza-dC; Sigma Chemical Co., Deisenhofen, Germany). The same concentration of dimethyl sulphoxide (DMSO) was also used as a control for non-specific solvent effect on cells. Total cellular protein was isolated three days after addition of 5-aza-dC, as previously described.20
Cell proliferation assay
AGS cells were grown in media supplemented with 10% fetal calf serum (Gibco Invitrogen) and 50 μg/ml rifobacin. Parental AGS cells, AGS cells transfected with the pCMVβ vector, and Ca9 transfected AGS cells were seeded in 96 well plates at a density of 30 000 cells/200 μl/well. After 40 hours of culture at 37°C, 5% (v/v) CO2, cells were pulsed for an additional eight hours with 3H-methyl-thymidine (0.2 μCi/well) and harvested onto glass fibre membranes. The incorporated radioactivity was measured by scintillation counting. In each case DNA synthesis was assessed six times in parallel and repeated once, resulting in a total of 12 experiments per cell line.21
In vitro invasion assay
Cellular invasion of AGS cells was evaluated in 24 well Transwell chambers (Costar, Bodenheim, Germany), as described previously.22 The upper and lower culture compartments were separated by polycarbonate filters with 8 μm pore size. Prior to invasion assays, the polycarbonate filter was coated with 100 ng matrigel matrix. For invasion assays, 3×10⁴ cells per well were incubated on the reconstituted basement membrane for 72 hours. Cells passing the filters and attaching to the lower sites of matrigel coated membranes were harvested using trypsin/EDTA; cell number was quantified in a Coulter Counter ZII (Coulter Immunotech, Marseille, France). The number of migrating cells was calculated from controls grown under identical culture conditions for 72 hours in 24 well plates. All experiments were performed in triplicate.
Real time quantitative analysis of Ca9 mRNA levels
Total RNA (1 μg) was reverse transcribed at 37°C for one hour in a final volume of 20 μl reverse transcription buffer (50 mM Tris-HCl, pH 8.3, 7 mM MgCl2, 40 mM KCl, and 10 mM DTT) containing 100 U MMLV reverse transcriptase, RNase H Minus, Point Mutant (Promega), 16 U RNase inhibitors (Promega), 200 pmol random primer (Promega), and 0.5 mM dNTPs (Biomol Feinchemikalien, Hamburg, Germany). The reaction was terminated by incubating the mixture at 95°C for five minutes. Polymerase chain reaction (PCR) amplification of the cDNA was performed as previously described. Briefly, PCR primers were designed to amplify a 240 bp cDNA fragment of the Ca9 gene (sense 5′-AGG AGG ATC TGC CCA GTG A -3′; antisense 5′-GCC AAT GAC TCT GGT CAT C -3′’).4 The expression level of Ca9 was determined using the LightCycler technique (Roche Diagnostics GmbH, Mannheim, Germany). Hybridisation probes consist of two different oligonucleotides that hybridise to an internal sequence of the amplified fragment during the annealing phase of PCR cycles. One probe is labelled at the 5′ end with a LightCycler Red fluorophore and the other probe is labelled at the 3′ end with fluorescein. In each PCR run, 0.5 μM of each primer, 3 mM MgCl2, 0.8 μM LightCycler Red 640 labelled probe (5′-LC Red640- TTG AGG CTC CTG GAG ATC CTC Ap-3′) and 0.4 μM Donor-F Probe (5′-CTG AAG TTA GAG GAT CTA CCT ACT X-3′’) were used under the following conditions: initial denaturation at 95°C for 10 seconds followed by 45 cycles with denaturation at 95°C for 10 seconds, annealing at 60°C for 10 seconds and elongation at 72°C for 10 seconds, with a temperature transition rate of 20°C/s. The second derivative maximum method provided by the LightCycler software was used to estimate the concentration of each sample.4,21
Immunohistochemistry
Immunostaining was performed with a monoclonal antibody M75 directed against Ca9.15 The M75 antibody is a murine monoclonal antibody which recognises the N terminal domain of Ca9. The specificity of the M75 antibody directed against Ca9 has been previously confirmed by western blot analysis and immunostaining of COS-7 cells transfected with Ca9 cDNA.7,15 For immunostaining, sections were deparaffinised in xylene and rehydrated in an alcohol series. Anti-Ca9 (dilution 1:10) was administered for one hour at 37°C in a moist chamber, followed by incubation with biotinylated antimouse IgG/antirabbit IgG (1:200; Vector Laboratories; distributed by Camon, Wiesbaden, Germany) and ABC alkaline phosphatase reagent, each for 30 minutes at room temperature. Immunoreactions were visualised with Vectastain ABC alkaline phosphatase kit (Camon, Wiesbaden, Germany). All specimens were counterstained with haematoxylin. Primary antibodies were omitted for negative controls.
Evaluation of immunohistochemical results
A numerical scoring system with two categories was used to assess the observed expression of Ca9 in tumour cells and gastric epithelium. Category A documented the number of immunoreactive cells as 0 (no immunoreactive cells), 1 (<10%), 2 (11–50%), and 3 (>50%). A positive case was defined as having a category A value of 1. Category B documented the intensity of the immunostaining as 0 (no immunostaining), 1 (weak), 2 (moderate), and 3 (strong). Finally, values for categories A and B were added to give the “immunoreactivity score” (IRS), which could range from 0 to 6. Immunostaining was assessed by a single experienced consultant histopathologist (CR) who was blinded to the clinical data of the patients. Interobserver variance was not calculated. Note that the method of calculating IRS does not allow individual categories to add up to an IRS of 1.
Western blot analysis
Human gastric tissues were lysed in buffer containing 1 mM EDTA, 50 mM β-glycerophosphate, 2 mM sodium orthovanadate, 1% Triton-100, 10% glycerol, 1 mM DTT, and protease inhibitors (10 mg/ml benzamidine, 2 mg/ml antipain, and 1 mg/ml leupeptin). Protein (25 μg) from each sample was adjusted to Laemmli buffer composition (2% sodium dodecyl sulphate, 10% glycerol, 62.5 mM Tris-HCl (pH 6.8), 100 mM DTT, and 0.1% bromphenol blue), denatured by heating at 95°C for five minutes, and subsequently separated on 12% polyacrylamide gels by sodium dodecyl sulphate-gel electrophoresis. After separation, proteins were transferred onto an immuno-Blot polyvinylidene difluoride membrane. The membrane was blocked with 5% non-fat milk in 1% TBST overnight and then incubated with 1:200 anti-Ca9 antibody for one hour at room temperature. The monoclonal murine antibody M75 was used and is described in more details above.7 Membrane bound secondary antibodies were detected by enhanced chemiluminescence following the manufacturer’s instructions (Amersham, Freiburg, Germany). To ensure equal loading, blots were reprobed using a monoclonal antibody to β-actin (clone AC-74; Sigma) at a dilution of 1:2000.21
Statistical analysis
For statistical analysis non-parametric and parametric tests were applied. Expression levels of Ca9 in matched normal and cancer tissues were analysed using paired tests. The number of proliferating/invading cells and expression of Ca9 was analysed using the Student’s t test. Survival curves were plotted using the Kaplan-Meier method, and comparison of survival times was performed using the log rank test. A p value <0.05 was taken as the level of significance.
RESULTS
Localisation of Ca9 expression in gastric cancer cells
The distribution pattern of Ca9 was first investigated by immunohistochemistry (fig 2 ▶). Ca9 was found in non-neoplastic gastric mucosa of every patient studied. It was confined to foveolar epithelial cells, and fundic and antral glands (fig 2 ▶). Intestinal metaplasia was observed in 15 (26.3%) patients and Ca9 was expressed at the brush border of intestinal metaplasia in 10 patients (66.7%). Ca9 was expressed in gastric cancer cells of 31 (54.0%) patients. No differences were found between intestinal- and diffuse-type gastric cancer. Ca9 was present in the tumour cells of 14 (51.9%) patients with diffuse-type gastric cancer, in 12 (57.1%) patients with moderately differentiated intestinal-type gastric cancer, and in five (55.6%) patients with poorly differentiated intestinal-type gastric cancer. The mean total IRS for Ca9 was calculated as 1.95 (1.98) for gastric cancer compared with 5.66 (0.78) in the foveolar epithelium (p<0.001). Table 1 ▶ summarises the total IRSs for Ca9.
Figure 2.
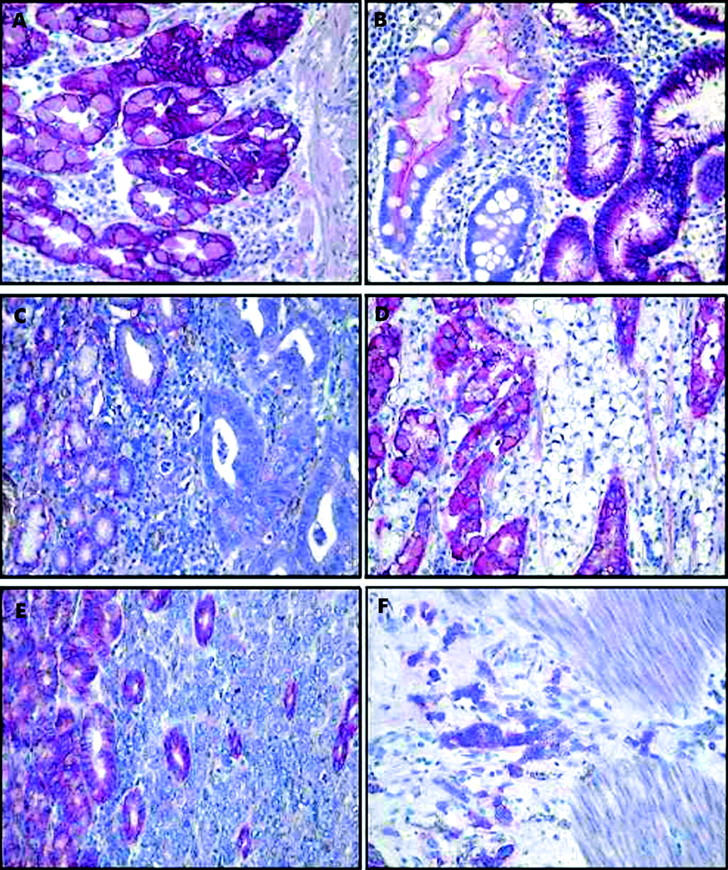
Distribution and expression pattern of carbonic anhydrase IX (Ca9) was investigated by immunohistochemistry. Tissue sections were stained with anti-Ca9 antibody M75. Ca9 was found in non-neoplastic gastric mucosa (A), intestinal metaplasia (B), and significantly less often in gastric cancer (C–F). Note the lack of immunostaining in gastric cancer of moderately (G2) differentiated intestinal-type (C) and diffuse-type gastric cancer (D) while non-neoplastic epithelial cells showed strong immunostaining. Occasionally immunostaining was heterogeneous: the bottom set shows a poorly differentiated (G3) intestinal-type gastric cancer with no immunostaining of tumour cells in the mucosa (E) and intense staining in a subset of tumour cells infiltrating the muscularis propria (F). Haematoxylin counterstain; original magnification ×400.
Table 1.
Expression of carbonic anhydrase IX (Ca9) in gastric cancer, as shown by immunohistochemistry
| Characteristic | Moderately differentiated intestinal-type (n = 21) | Poorly differentiated intestinal-type (n = 9) | Diffuse-type (n = 27) |
| Age (y) (mean (SD)) | 68.3 (10.0) | 60.0 (11.2) | 62.0 (11.0) |
| Sex (M/F) | 15/6 | 7/2 | 15/12 |
| IRS of cancer cells | 1.67 (1.73) | 2.05 (1.99) | 1.96 (2.10) |
| IRS of foveolar epithelium | 5.50 (0.84) | 5.88 (0.33) | 5.52 (0.98) |
| p Value* | <0.001 | <0.001 | <0.001 |
IRS, immunoreactivity score.
*p values refer to differences between the IRS of cancer cells and foveolar epithelium.
Quantitative analysis of Ca9 expression in gastric cancers
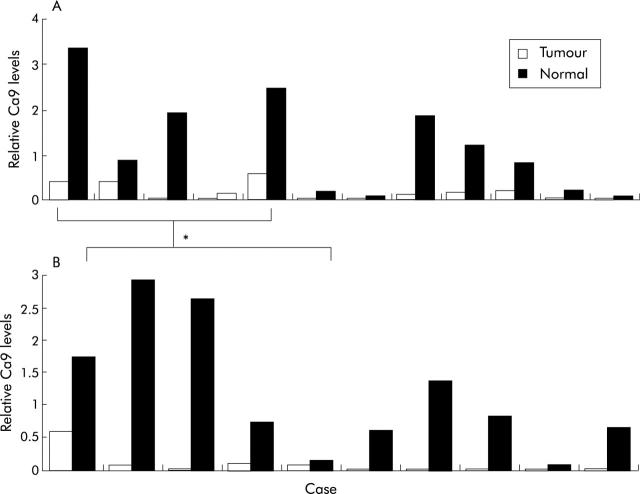
Ca9 mRNA and protein expression were then assessed by real time quantitative PCR and western blotting. The results are illustrated in figs 1 ▶ and 3 ▶. Ca9 mRNA levels in cancerous and non-cancerous tissues were assessed in 10 patients whereas western blot analysis was performed in 12 cases. In five cases both western blot analysis and real time quantitative PCR was performed in the same patient, allowing a direct comparison of expression levels of Ca9 protein and mRNA in gastric cancer and non-neoplastic gastric mucosa (fig 3A ▶, B). While we found cancers that did not exhibit a significant difference in Ca9 expression compared with non-cancerous tissues, a subgroup of cancers exhibited reduced Ca9 levels, as demonstrated by western blot analysis. Overall, levels of Ca9 protein and mRNA were significantly decreased in gastric cancers compared with matched non-neoplastic mucosa (p = 0.04). Direct comparison of five cases in which both Ca9 protein and mRNA levels were assessed revealed that in all cases reduced protein levels were associated with decreased Ca9 mRNA levels (fig 3 ▶).
Figure 3.
Quantitative analysis of carbonic anhydrase IX (Ca9) mRNA (A) and protein (B) levels in gastric tumours, as assessed by western blot analysis and real time polymerase chain reaction, compared with matched non-neoplastic gastric mucosa (Normal). *In five cases protein and mRNA levels were assessed in both cancerous and non-cancerous tissues and exhibited decreased levels in the cancerous part in all cases.
Prognostic significance of Ca9 expression in gastric cancer
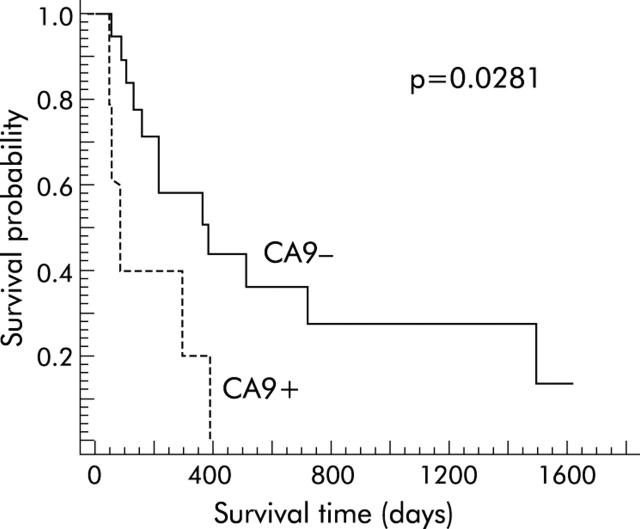
Survival data were obtained from 23 patients with gastric cancer undergoing gastric cancer resection. According to the immunohistochemical score, as outlined above, two groups of patients were classified: group A with low Ca9 expression (IRS ⩽3) versus group B with high Ca9 expression in cancer cells (IRS >3). Postoperative survival time for patients with high Ca9 expression was significantly shorter than in patients without or with low Ca9 expression (p = 0.0281) (fig 4 ▶). Interestingly, expression of Ca9 was very prominent at the site of infiltration of the muscularis propria, indicating that despite the overall loss of Ca9 expression in gastric cancer, sustained or re-expression of Ca9 at the invasion front may contribute to overall poor survival in patients with increased Ca9 expression (fig 2 ▶, table 2 ▶). Furthermore, expression of Ca9 was also observed in lymph node metastasis of gastric cancer (fig 5 ▶).
Figure 4.
Survival analysis of patients with gastric cancer expressing low or high levels of the carbonic anhydrase IX (Ca9) protein. Using an immunoreactivity score (IRS), as outlined in the method section, a group of patients with an IRS ⩽3 (Ca9−; n = 18) and a second group with an IRS >3 (Ca9+; n = 5) were identified. Survival was significantly shorter in patients with increased Ca9 expression (p = 0.0281).
Table 2.
Summary of patients with expression of carbonic anhydrase IX at the invasion front
| Patient No | Age (y) | Sex | Lauren classification | pT | pN | pM | G |
| 1 | 84 | F | Diffuse | 2 | 0 | x | 3 |
| 2 | 79 | F | Diffuse | 3 | 2 | x | 3 |
| 3 | 71 | F | Intestinal | 2 | 1 | x | 2 |
| 4 | 56 | M | Diffuse | 2 | 1 | x | 3 |
| 5 | 45 | M | Diffuse | 2 | 1 | x | 3 |
| 6 | 47 | F | Diffuse | 3 | 1 | x | 3 |
| 7 | 70 | M | Intestinal | 1 | 1 | x | 2 |
| 8 | 69 | M | Diffuse | 2 | 2 | x | 3 |
| 9 | 52 | F | Diffuse | 3 | 2 | x | 3 |
| 10 | 59 | F | Diffuse | 4 | 2 | x | 3 |
Figure 5.
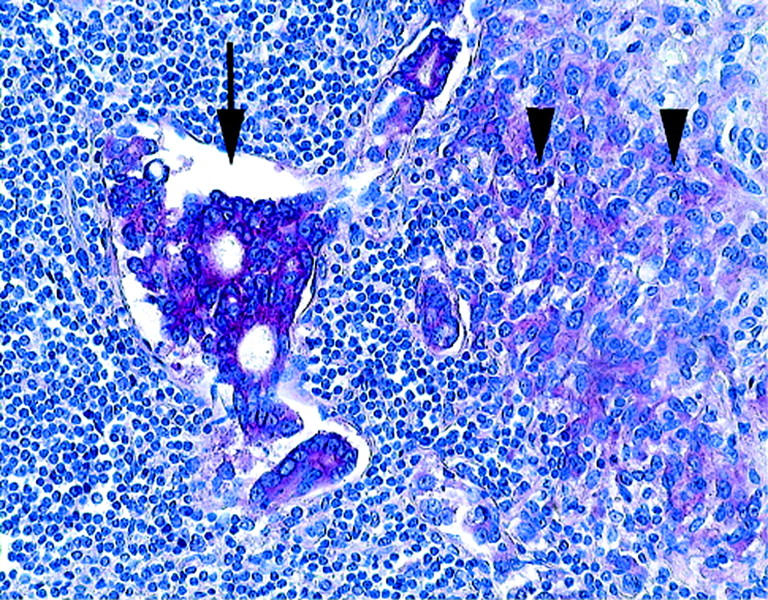
Distribution and expression pattern of carbonic anhydrase IX (Ca9) in lymph node metastasis was investigated by immunohistochemistry. Note the strong expression of Ca9 by tumour cells in the lymph node sinus (arrow) and by tumour cells infiltrating the lymph node (arrowheads). Haematoxylin counterstain; original magnification ×200.
Ca9 transfection induces proliferation of AGS cells
Ca9 mRNA and protein levels were investigated in AGS, N87, and MKN28 gastric cancer cells by real time PCR and western blotting. HeLa cells served as a positive control. Ca9 mRNA and protein were found in N87 and MKN28 cells, albeit at significantly lower levels compared with HeLa cells (fig 1B ▶). Ca9 mRNA and protein were undetectable in AGS cells, which were then chosen for transfection of Ca9 cDNA in order to assess the biological changes associated with Ca9 expression. AGS cells were transfected with full length Ca9 cDNA, with an empty expression vector (control B), or were treated with only the Transfectam reagent without DNA transfer (control A). Expression of Ca9 in transfected cells was confirmed by western blotting (fig 1A ▶). The proliferative capability of transfected AGS cells was significantly increased compared with the two control groups (fig 6 ▶). Furthermore, expression of Ca9 in AGS cells resulted in an increase in migrating cells compared with controls (that is, incubation of parental AGS cells with Transfectam only or AGS cells transfected with empty vector (controls A and B)) but this increase was not statistically significant (fig 6 ▶).
Figure 6.
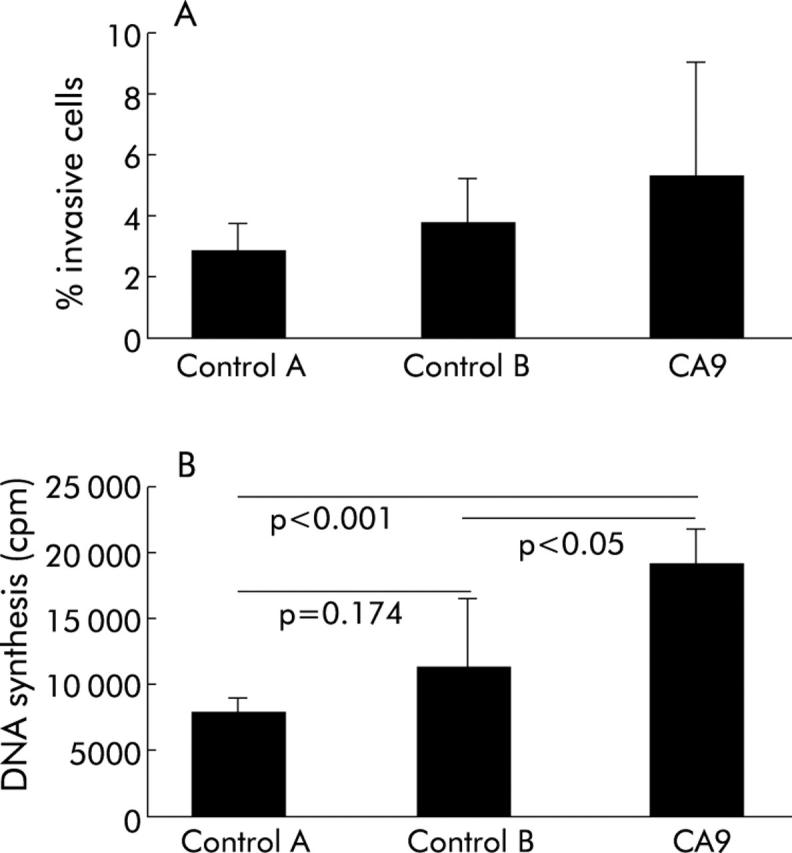
(A) Cellular invasion of AGS cells transfected with carbonic anhydrase IX cDNA (Ca9), incubated with the Transfectam reagent without DNA (control A) or transfected with the empty pCMVβ vector (control B) was evaluated in 24 well Transwell chambers (Costar, Bodenheim, Germany), as described in the methods section. Ca9 transfected cells exhibited increased invasion which however was not statistically significant. Values are mean (SD). (B) Induction of cell proliferation by Ca9 transfection in AGS cancer cells. Transfection of AGS cells with Ca9 cDNA led to significant induction in cell proliferation compared with cells without DNA transfection (control A) or transfected with an empty pCMVβ vector (control B). Values are mean (SD).
Biological effects of restoration of Ca9 expression in gastric cancer cells by inhibition of methylation
Levels of Ca9 mRNA were also analysed in N87, MKN28, MKN45, and AGS cells after treatment with 5-aza-dC, a demethylating agent. Treatment with 5-aza-dC increased Ca9 mRNA levels more than fivefold in N87, MKN45, and AGS cells. No effect was observed in MNK28 cells (fig 7 ▶). The in vitro matrigel invasion assay was used to assess the invasive potential of 5-aza-dC treated AGS cells compared with untreated AGS cells. Untreated AGS cells exhibited no difference in invasiveness compared with DMSO treated AGS cells (control). In contrast, 2.9% of 5-aza-dC treated AGS cells passed the reconstituted matrigel matrix while only 1.05% of untreated and 1.04% of DMSO treated AGS cells were detectable on the lower side of the filters (p<0.01) (fig 7 ▶).
Figure 7.
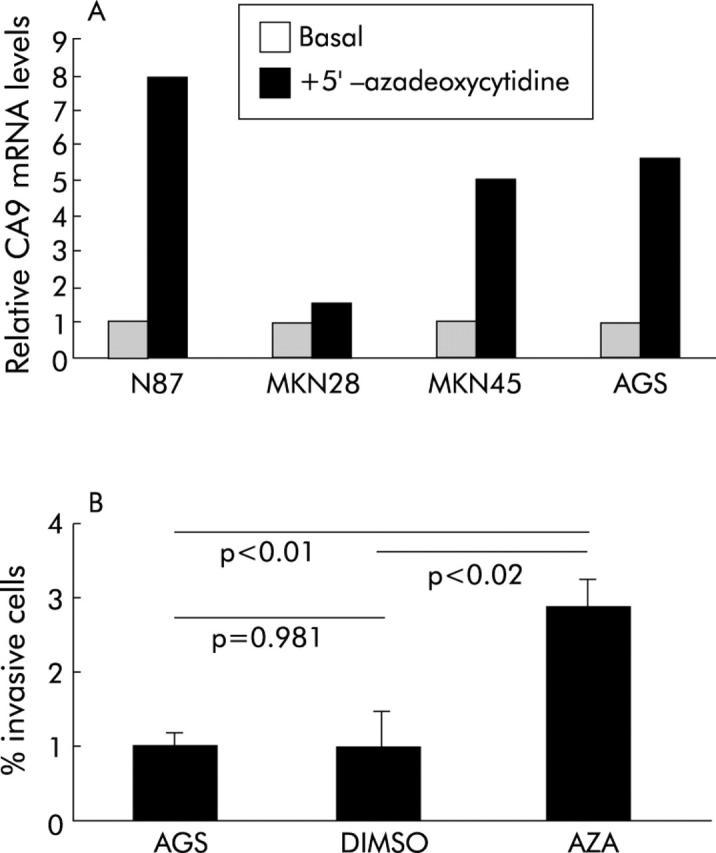
(A) Carbonic anhydrase IX (Ca9) mRNA levels in gastric cancer cell lines were assessed with and without incubation with 5′-azadeoxycytidine. Basal mRNA expression was standardised in all cells and the relative changes after incubation with 5′-azadeoxycytidine were assessed by real time polymerase chain reaction. While no significant change was observed for MKN28 cells, the other cells (that is, AGS, MKN45, and N87 cells) exhibited a more than fivefold increase in Ca9 mRNA levels following treatment with 5′-azadeoxycytidine. (B) Cellular invasion of AGS cells treated with or without dimethyl sulphoxide (DMSO) or 5′-azadeoxycytidine (AZA) was evaluated in 24 well Transwell (8 μm pore size) chambers (Costar, Bodenheim, Germany). Invading cells were harvested from the lower side of the filters using trypsin/EDTA. Cell number was quantified in a Coulter Counter ZII (Coulter Immunotech, Marseille, France). The differences between AZA and untreated AGS cells (AGS, DMSO) were statistically significant. Values are mean (SD).
DISCUSSION
Gastric cancer is the second most common cause of cancer related deaths worldwide.23,24 Genetic and molecular changes leading to gastric cancer include, among others, overexpression of oncogenes, such as K-sam and c-met, loss of certain tumour suppressor genes, such as APC and p53, and alteration of adhesion molecules.23–27 Recently, carbonic anhydrases, and Ca9 in particular, have received increasing attention as they have been linked to the process of malignant transformation and progression of various cancers.2 In gastric cancers however, expression is lost or downregulated, indicating that the biological functions of Ca9 must be more complex.15,16 Physiological analysis revealed that Ca9, a highly active enzyme, plays an important role in acid-base balance, ion exchange, and CO2 transfer through reversible conversion of CO2 to HCO3−.1,2,28 In addition, Ca9 was recently shown to participate in the control of cell-cell adhesion.8 Furthermore, transcription of the Ca9 gene is negatively regulated by the von Hippel-Lindau tumour suppressor gene in renal cell carcinoma cells.29 The protein product of the von Hippel-Lindau tumour suppressor gene interacts with the ubiquitin ligase complex that is responsible for targeting HIF-1α for oxygen dependent proteolysis.30,31 Thus low levels of oxygen lead to stabilisation of HIF-1α, which in turn leads to increased expression of Ca9.9
While overexpression of Ca9 has been reported in various cancers, expression is low or even lost in most gastric cancers.15,16 In our analysis Ca9 expression was lost in the cancer cells in 26 of 57 patients while in the normal stomach expression of Ca9 was retained in foveolar epithelial cells and in fundic and antral glands. A previous study by Pastorekova et al assessed expression of Ca9 in a limited number of specimens and also reported decreased Ca9 expression in their gastric cancers.15 Furthermore, in a recent study by Leppilampi et al expression of CA9 was analysed in gastric cancers and also in preneoplastic lesions.16 They found a significant decrease in Ca9 expression towards high grade dysplasia, but expression of Ca9 was also restored in well differentiated adenocarcinomas while less differentiated adenocarcinomas exhibited less Ca9 expression. Loss of expression of Ca9 could be interpreted as a consequence of neoplastic changes, including dedifferentiation during gastric carcinogenesis, but recent studies indicate that in fact this loss is not just an epiphenomenon but rather a critical change underlying the process of gastric carcinogenesis. This hypothesis is supported by generation of Ca9 deficient mice in which inactivation of the Ca9 gene leads to the development of gastric hyperplasia, which is associated with enhanced cellular proliferation.17 Together with our analysis demonstrating loss of Ca9 expression in approximately half of gastric cancers, these studies in Ca9 deficient mice indicate that Ca9 may function as a critical differentiation factor in the stomach that also controls cell proliferation and growth of the gastric mucosa. Indeed, loss of Ca9 expression, as observed in our study in the western blot and PCR analysis, may support the hypothesis that this loss of expression is critical for the development of gastric cancer and may be an early event in gastric carcinogenesis. This observation is supported by the study of Leppilampi et al which also reported an early decrease in Ca9 expression in preneoplastic lesions of gastric cancer.16
Our immunohistochemical analysis however revealed a further important observation. After applying an immunoreactivity score, two groups of Ca9 expression patterns were identified in gastric cancer. Cancers expressing abundant Ca9 exhibited a shorter postoperative survival compared with tumours with low levels of expression or no expression. A similar association between Ca9 expression and poor prognosis has recently been reported in non-small cell lung cancers.12 Inasmuch as Ca9 expression has been considered a surrogate marker for hypoxia in lung cancers, the association of Ca9 levels in this cancer and the observed poor prognosis indicates the importance of the role of hypoxia and acidosis in the progression and invasion of malignancies expressing abundant Ca9.12 Further analysis of the immunohistochemical sections in our series of gastric cancers that retained Ca9 expression demonstrated expression of Ca9 in cancer cells that were located at the invasion front of these cancers. Expression of Ca9 at the invasion front was not associated with increased metastasis or advanced stage. However, we also observed Ca9 expression in lymph node metastases of gastric cancers, and tumours that retained Ca9 expression in cancer cells exhibited a worse prognosis.12,32 Our in vivo observations are supported by in vitro analysis of Ca9 overexpression in AGS gastric cancer cells. On transfection of Ca9 cDNA in these gastric cancer cells, cell proliferation of transfected cells was significantly enhanced. Thus overexpression of Ca9 in gastric cancer is also associated with enhanced cell proliferation, strengthening the finding that Ca9 overexpression in a small subset of gastric cancers is associated with poor prognosis.
Recent studies in renal cancer indicated that Ca9 expression was, at least in part, regulated by methylation of the Ca9 gene promoter and that hypomethylation of the Ca9 promoter region is associated with increased Ca9 expression in human renal cancer cell lines.33,34 As we observed reduced or lost expression of Ca9 in a large number of gastric cancers and gastric cancer cell lines, we treated four well established gastric cancer cell lines with 5-aza-dC, a demethylating agent, in order to analyse whether this inhibition of methylation may lead to restoration of Ca9 expression. All cell lines, except for MKN28 cells, exhibited increased Ca9 mRNA levels after treatment with 5-aza-dC, indicating that expression of Ca9 in gastric cancer cell lines is, at least in part, regulated by methylation of CpG sites. As we observed re-expression of Ca9 in these cells after treating the cells with 5-aza-dC, we wished to assess whether this restoration of Ca9 expression would also alter their biological characteristics. Therefore, these cells were also analysed in an invasion assay that allows for evaluation of changes in invasiveness of cells with and without treatment. While we observed no changes in invasiveness of AGS cells which were kept in media or DMSO added to the media, AGS cells incubated with 5-aza-dC exhibited a significant increase in invasiveness, indicating that restoration of Ca9 in these cells is associated with enhanced invasion.
Based on these data we assume that loss of Ca9 is an early event in gastric cancer that may be associated with increased promoter methylation. Later in the process of gastric cancer progression Ca9 expression is induced in a subgroup of patients at the invasion front of cancer cells which may give these cells an additional growth advantage by enhancing their proliferation and invasive growth.
Acknowledgments
This work was supported by the DAAD and the Deutsche Forschungsgemeinschaft. M Ebert is supported by the Heisenberg-Programme of the DFG (Eb 187/5–1).
Abbreviations
Ca, carbonic anhydrase
HIF, hypoxia inducible factor
CMV, cytomegalovirus
IRS, immunoreactivity score
DMSO, dimethyl sulphoxide
5-aza-dC, 5′-azadeoxycytidine
PCR, polymerase chain reaction
Conflict of interest: None declared.
REFERENCES
- 1.Parkkila S, Parkkila AK. Carbonic anhydrase in the alimentary tract: Roles of the different isozymes and salivary factors in the maintenance of optimal conditions in the gastrointestinal canal. Scand J Gastroenterol 1996;31:305–17. [DOI] [PubMed] [Google Scholar]
- 2.Potter CPS, Harris AL. Diagnostic, prognostic and therapeutic implications of carbonic anhydrases in cancer. Br J Cancer 2003;89:2–7. [DOI] [PMC free article] [PubMed] [Google Scholar]
- 3.Pastorek J, Pastorekova S, Callebaut I, et al. Cloning and characterization of MN, a human tumor-associated protein with a domain homologous to carbonc anhydrase and a putative helix-loop-helix DNA binding segment. Oncogene 1994;9:2877–88. [PubMed] [Google Scholar]
- 4.Opavsky R, Pastorekova S, Zelnik V, et al. Human MN/Ca9 gene, a novel member of the carbonic anhydrase family: structure and exon to protein domain relationships. Genomics 1996;33:480–7. [DOI] [PubMed] [Google Scholar]
- 5.Zavada J, Zavadova Z, Pastorekova S, et al. Expression of MaTu-MN protein in human tumor cultures and in clinical specimens. Int J Cancer 1993;54:268–74. [DOI] [PubMed] [Google Scholar]
- 6.Liao SY, Brewer C, Zavada J, et al. Identification of the MN antigen as a diagnostic biomarker of cervical intraepithelial neoplasia and cervical carcinoma. Am J Pathol 1994;145:598–609. [PMC free article] [PubMed] [Google Scholar]
- 7.Saarnio J, Parkkila S, Parkkila AK, et al. Immunhistochemical study of colorectal tumors for expression of a novel transmembrane carbonic anhydrase, MN/CA IX, with potential value as a marker of cell proliferation. Am J Pathol 1998;153:279–85. [DOI] [PMC free article] [PubMed] [Google Scholar]
- 8.Svastova E, Zilka N, Zatovicova M, et al. Carbonic anhydrase IX reduces E-cadherin-mediated adhesion of MDCK cells via interaction with β-catenin. Exp Cell Res 2003;290:332–45. [DOI] [PubMed] [Google Scholar]
- 9.Wykoff CC, Beasley NJP, Watson PH, et al. Hypoxia-inducible expression of tumor-associated carbonic anhydrases. Cancer Res 2000;60:7075–83. [PubMed] [Google Scholar]
- 10.Koukourakis MI, Giatromanolaki A, Sivridis E, et al. Hypoxia-regulated carbonic anhydrase-9 (Ca9) relates to poor vascularization and resistance of squamous cell head and neck cancer to chemoradiotherapy. Clin Cancer Res 2001;7:3399–403. [PubMed] [Google Scholar]
- 11.Giatromanolaki A, Koukourakis MI, Sivridis E, et al. Expression of hypoxia-inducible carbonic anhydrase-9 relates to angiogenic pathways and independently to poor outcome in non-small cell lung cancer. Cancer Res 2001;61:7992–8. [PubMed] [Google Scholar]
- 12.Swinson DE, Jones JL, Richardson D, et al. Carbonic anhydrase IX expression, a novel surrogate marker of tumor hypoxia is associated with a poor prognosis in non-small cell lung cancer. J Clin Oncol 2003;21:473–82. [DOI] [PubMed] [Google Scholar]
- 13.Chia SK, Wykoff CC, Watson PH, et al. Prognostic significance of a novel hypoxia-regulated marker, carbonic anhydrase IX, in invasive breast carcinoma. J Clin Oncol 2001;19:3660–8. [DOI] [PubMed] [Google Scholar]
- 14.Loncaster JA, Harris AL, Davidson SE, et al. Carbonic anhydrase expression, a potential new intrinsic marker of hypoxia: correlations with tumor oxygen measurements and prognosis in locally advanced carcinoma of the cervix. Cancer Res 2001;61:6394–9. [PubMed] [Google Scholar]
- 15.Pastorekova S, Parkkila S, Parkkila AK, et al. Carbonic anhydrase IX: Analysis of stomach complementary DNA sequence and expression in human and rat alimentary tracts. Gastroenterology 1997;112:398–408. [DOI] [PubMed] [Google Scholar]
- 16.Leppilampi M, Saarnio J, Karttunen TJ, et al. Carbonic anhydrase isozymes IX and XII in gastric tumors. World J Gastroenterol 2003;9:1398–403. [DOI] [PMC free article] [PubMed] [Google Scholar]
- 17.Gut MO, Parkkila S, Vernerova Z, et al. Gastric hyperplasia in mice with targeted disruption of the carbonic anhydrase gene Car9. Gastroenterology 2002;123:1889–903. [DOI] [PubMed] [Google Scholar]
- 18.Lauren P. The two histological main types of gastric carcinoma: diffuse and so-called intestinal-type carcinoma. Acta Path Microbiol Scand 1965;64:31–49. [DOI] [PubMed] [Google Scholar]
- 19.Hamilton SR, Aaltonen LA. WHO classification of tumours. Pathology and genetics of tumors of the digestive system. Lyon: IARC Press, 2000.
- 20.Ebert MP, Yu J, Hoffmann J, et al. Loss of beta-catenin expression in metastatic gastric cancer. J Clin Oncol 2003;21:1708–14. [DOI] [PubMed] [Google Scholar]
- 21.Juhasz M, Chen J, Lendeckel U, et al. Expression of carbonic anhydrase IX in human pancreatic cancer. Aliment Pharmacol Ther 2003;18:837–46. [DOI] [PubMed] [Google Scholar]
- 22.Krueger S, Buehling F, Kellner U, et al. Cathepsin L antisense oligonucleotides in a human osteosarcoma cell line: Effects on the invasive phenotype. Cancer Gene Therapy 2001;8:522–8. [DOI] [PubMed] [Google Scholar]
- 23.Fuchs CS, Mayer RJ. Gastric carcinoma. N Engl J Med 1995;333:32–41. [DOI] [PubMed] [Google Scholar]
- 24.Ebert M, Malfertheiner P. Pathogenesis of sporadic and familial gastric cancer: Implications for prevention and cancer management. Aliment Pharmacol Ther 2002;16:1059–66. [DOI] [PubMed] [Google Scholar]
- 25.Berx G, Becker KF, Höfler H, et al. Mutations of the human E-cadherin (CDH1) gene. Hum Mutat 1998;12:226–37. [DOI] [PubMed] [Google Scholar]
- 26.Correa P. Human gastric carcinogenesis: a multistep and multifactorial process-first American Cancer Society Award Lecture on cancer epidemiology and prevention. Cancer Res 1992;52:6735–40. [PubMed] [Google Scholar]
- 27.Stemmermann G, Heffelfinger SC, Noffsinger A, et al. The molecular biology of esophageal and gastric cancer and their precursors: oncogenes, tumor suppressor genes, and growth factors. Hum Pathol 1994;25:968–81. [DOI] [PubMed] [Google Scholar]
- 28.Wingo T, Tu CK, Laipis PJ, et al. The catalytic properties of human carbonic anhydrase IX. Biochem Biophys Res Commun 2001;288:666–9. [DOI] [PubMed] [Google Scholar]
- 29.Ivanov SV, Kuzmin I, Wei MH, et al. Down-regulation of transmembrane carbonic anhydrases in renal cell carcinoma cell lines by wild-type von Hippel-Lindau transgenes. Proc Natl Acad Sci USA 1998;95:12596–601. [DOI] [PMC free article] [PubMed] [Google Scholar]
- 30.Maxwell PH, Wiesener MS, Chang GW, et al. The tumour suppressor protein VHL targets hypoxia-inducible factors for oxygen-dependent proteolysis. Nature 1999;399:271–75. [DOI] [PubMed] [Google Scholar]
- 31.Jaakkola P, Mole DR, Tian YM, et al. Targeting of HIFα to the von Hippel Lindau ubiquitination complex by O2-regulated prolyl hydroxylation. Science 2001;292:468–72. [DOI] [PubMed] [Google Scholar]
- 32.Parkkila S, Rajanieimi H, Parkilla AK, et al. Carbonic anhydrase inhibitor suppresses invasion of renal cancer cells in vitro. Proc Natl Acad Sci USA 2000;97:2220–4. [DOI] [PMC free article] [PubMed] [Google Scholar]
- 33.Ashida S, Nishimori I, Tanimura M, et al. Effects of von Hippel-Lindau gene mutation and methylation status on expression of transmembrane carbonic anhydrases in renal cell carcinoma. J Cancer Res Clin Oncol 2002;128:561–8. [DOI] [PubMed] [Google Scholar]
- 34.Cho M, Uemura H, Kim SC, et al. Hypomethylation of the MN/Ca9 promoter and upregulated MN/Ca9 expression in human renal cell carcinoma. Br J Cancer 2001;85:563–7. [DOI] [PMC free article] [PubMed] [Google Scholar]


