Evaluation of the effect of chemotherapy for pancreatic ductal cancer (PC) is generally conducted based on changes in tumour diameter using imaging modalities; however, exact measurement is often difficult because of local inflammation, fibrotic change, and desmoplastic reaction to treatment, leading to an unreliable evaluation.1,2 PC is considered a hypovascular tumour. However, newly developed highly sensitive ultrasonic equipment has enabled the detection of vascular signals in PC; vascular signals were detected in 20–67% of cases.3–7 We focused on changes in tumour vascularity of PC associated with chemotherapy, and attempted to apply it to evaluation of the effect of treatment and usefulness in relation to prognosis. In this study, we assessed vascular images of the tumour based on the Doppler signal (v signal) using contrast enhanced ultrasonography (CEUS).
Thirty one histopathologically confirmed consecutive patients with PC who had distant metastases were included in the study. Informed consent was obtained from all patients and the study was approved by the ethics committee. The tumour was located in the head of the pancreas in 16 patients and in the body or tail in 15. All patients were treated with a combination of S-1, an oral fluorinated pyrimidine derivative, and gemcitabine. Chemotherapy was performed every three weeks as one cycle. CEUS was performed before and after one and two cycles of treatment using a SSA-770A (Toshiba Co. Ltd, Tokyo, Japan) and a 3.75 MHz convex probe. CEUS images were obtained by Advanced Dynamic Flow mode, which is wideband Doppler sonography with a high sensitivity and resolution. The contrast agent was Levovist (SHU 508 A; Schering AG, Berlin, Germany), which was administered at a concentration of 300 mg/ml by intravenous injection of 8 ml at 1 ml/s. After injection, v signals in the tumour of the pancreas were continuously observed for 120 seconds. CEUS images showing the highest intensity of the vascular signal were selected and classified into five categories according to intensity: no signal (grade 0), spotty signals (grade 1), linear signals between grades 1 and 3 (grade 2), mosaic pattern signals (grade 3), and diffuse pattern signals (grade 4). Dynamic computed tomography (CT) was performed with a helical CT scanner (Light Speed Ultra, GE Medical Systems) which was performed every two cycles. In this study, treatment effect after two cycles of chemotherapy was examined.
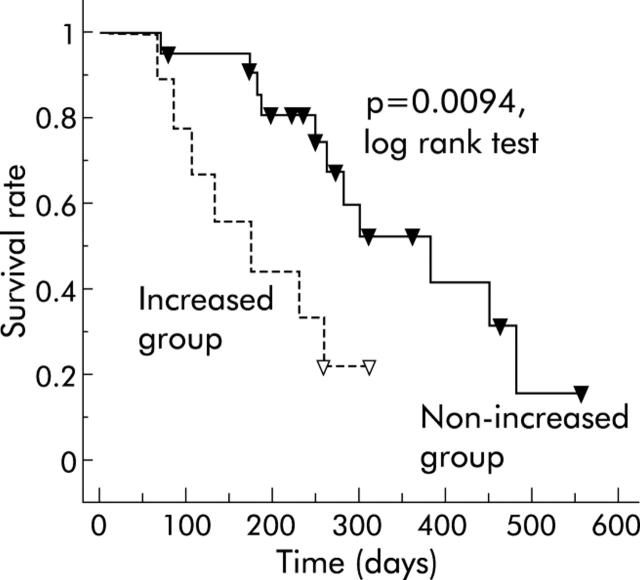
The response to treatment, as determined by dynamic CT after two cycles of treatment, was as follows: partial response (PR) in five patients (16%), stable disease (SD) in 17 (55%), and progressive disease (PD) in nine (29%). A significant decrease in the v signal score was observed in PR compared with SD or PD after one cycle of treatment (p = 0.0009 and p = 0.0017, respectively). After two cycles of treatment, the decrease was conspicuous in PR (p = 0.0022 and p = 0.0021, respectively) whereas in PD a significant increase in the v signal score was observed compared with SD (P = 0.0160). In univariate analysis, the increase in v signal (before the second cycle) was a significant prognostic factor (p = 0.0150). Median survival time of patients in the non-increased v signal group (n = 22) after two cycles of treatment was 382 days (71–484) and for those in the increased group (n = 9), 176 days (68–257). Thus patients in the increased group had a significantly shorter survival than those in the non-increased group (p = 0.0094) (fig 1 ▶).
Figure 1.
Cumulative survival rate according to changes in the v signal score after two cycles of treatment. Median survival time (MST) of patients in the non-increased v signal group (n = 22) was 382 days (range 71–484) and for those in the increased group (n = 9), 176 days (range 68–257). MST in the increased group was significantly shorter compared with the non-increased group (log rank test; p = 0.0094).
In conclusion, analysis of tumour vascularity by CEUS evaluated the effect of treatment much earlier than dynamic CT, and predicted prognosis in patients with PC.
Conflict of interest: None declared.
References
- 1.Halm U, Schumann T, Schiefke I, et al. Decrease of CA19-9 during chemotherapy with gemcitabine predicts survival time in patients with advanced pancreatic cancer. Br J Cancer 2000;82:1013–16. [DOI] [PMC free article] [PubMed] [Google Scholar]
- 2.Micke O, Bruns F, Kurowski R, et al. Predictive value of carbohydrate antigen 19-9 in pancreatic cancer treated with radiochemotherapy. Int J Radiat Oncol Biol Phys 2003;57:90–7. [DOI] [PubMed] [Google Scholar]
- 3.Ozawa Y, Numata K, Tanaka K, et al. Contrast-enhanced sonography of small pancreatic mass lesions. J Ultrasound Med 2002;21:983–91. [DOI] [PubMed] [Google Scholar]
- 4.Nagase M, Furuse J, Ishii H, et al. Evaluation of contrast enhanced patterns in pancreatic tumors by coded harmonic sonographic imaging with a microbubble contrast agent. J Ultrasound Med 2003;22:789–95. [DOI] [PubMed] [Google Scholar]
- 5.Takeda K, Goto H, Hirooka Y, et al. Contrast-enhanced transabdominal ultrasonography in the diagnosis of pancreatic mass lesions. Acta Radiol 2003;44:103–6. [PubMed] [Google Scholar]
- 6.Ohshima T, Yamaguchi T, Ishihara T, et al. Evaluation of blood flow in pancreatic ductal carcinoma using contrast-enhanced, wide-band Doppler ultrasonography: correlation with tumor characteristics and vascular endothelial growth factor. Pancreas 2004;28:335–43. [DOI] [PubMed] [Google Scholar]
- 7.Kitano M, Kudo M, Maekawa K, et al. Dynamic imaging of pancreatic disease by contrast enhanced coded phase inversion harmonic ultrasonography. Gut 2004;53:854–9. [DOI] [PMC free article] [PubMed] [Google Scholar]


