

Abstract
Background and aim: The majority of patients with chronic pancreatitis are alcoholics. Our goal was to develop a mouse model of alcohol dependent chronic pancreatitis.
Methods: Mice were fed either the non-alcohol containing Lieber-DeCarli diet or the Lieber-DeCarli diet containing 24% of calories as ethanol. After eight weeks and while on their respective diets, mice were subjected to repeated episodes of acute pancreatitis elicited by administration of caerulein. They were sacrificed 1, 3, and 5 weeks after the last dose of caerulein. Pancreatic morphology and collagen deposition were evaluated in samples stained with haematoxylin-eosin and Sirius red. Collagen content was quantitated by measuring OH-proline. Gene expression was determined by quantitative polymerase chain reaction.
Results: Both groups of mice gained weight at the same rate. Those receiving the alcohol containing diet had serum alcohol levels of approximately 100 mM. No histological or gene expression differences were found in mice that were not subjected to acute pancreatitis, regardless of their diet. Necrosis, Sirius red staining, OH-proline content, and expression of α-1 collagen I, α-smooth muscle actin, transforming growth factor β1, and tissue inhibitor of metalloproteinase 1 were all increased in mice fed the alcohol containing diet and given caerulein compared with those fed the control diet and given caerulein. Matrix metalloproteinase 9 expression was transiently decreased in mice fed ethanol and given caerulein compared with the group given caerulein but not fed ethanol.
Conclusion: We have developed a mouse model of alcohol dependent chronic pancreatic fibrosis. This mouse model may be useful in studies examining the effects of genetic manipulation on chronic pancreatitis.
Keywords: chronic pancreatitis, alcohol, fibrosis, mouse, extracellular matrix
Although ethanol abuse has been repeatedly identified as the most common cause of chronic pancreatitis, the mechanisms by which ethanol might either cause chronic pancreatitis itself or sensitise the pancreas to injury by other factors are not known. To a great extent, our poor understanding of the pathophysiological events leading to the onset of chronic pancreatitis results from the fact that most patients with the disease are identified only after the early phases of the disease have passed and, consequently, clinical studies focusing on mechanisms responsible for the onset of chronic pancreatitis are not possible. To overcome this problem, numerous attempts at developing animal models of chronic pancreatitis have been made, but the goal of developing a good animal model of the disease has not been achieved and the currently available models are clearly imperfect (for a review on alcohol’s involvement in chronic pancreatitis see Siegmund and colleagues1 and Schneider and colleagues2). For the most part, previously reported studies have involved feeding rats an ethanol containing diet for short periods and then exposing them to acute pancreatic injury to elicit the changes in chronic pancreatitis,3,4 evaluating the effects of ethanol administration on the severity of acute pancreatitis,5,6 or examining the in vitro effects of ethanol on cultured pancreatic acinar and stellate cells.7,8,9,10 We reasoned that an ideal model of chronic pancreatitis should have the following four characteristics. Firstly, it should be ethanol dependent so as to replicate the clinical condition in which chronic pancreatitis is, most commonly, the result of longstanding ethanol abuse. Secondly, it should be an in vivo rather than an in vitro model so as to allow for studies that take advantage of cell-cell and organ-organ interactions. Thirdly, it should be a model in mice so as to take advantage of the large number of genetically manipulated mouse strains which are currently available for mechanistic studies. Fourthly, it should be a model in which clear evidence of pancreatic fibrosis can be noted as fibrosis of the pancreas is the hallmark of clinical chronic pancreatitis.
To develop a model of chronic pancreatitis, we fed mice an ethanol containing diet for a prolonged period and exposed them to repeated episodes of acute pancreatic injury. We suggest that this murine model may be ideally suited for studies aimed at elucidating the pathophysiological and pathogenetic mechanisms underlying the development of ethanol induced chronic pancreatitis.
MATERIALS AND METHODS
All experiments were performed using eight week old male C3H mice obtained from Charles River Laboratories (Wilmington, Massachusetts, USA). At the onset of each experiment, mice weighed 17 g. They were housed individually in shoebox cages in a temperature controlled (20±2°C) room with a 12 hour light-dark cycle. All experimental protocols were approved by the Institutional Animal Care and Use Committee of the Tufts-New England Medical Center. Ethanol free and ethanol containing Lieber-DeCarli diets were purchased from Bio-Serv (Frenchtown, New Jersey, USA). Caerulein, the decapeptide analogue of cholecystokinin, was purchased from Sigma Chemical Co. (St Louis, Missouri, USA). The ethanol L3K assay was purchased from Diagnostics Chemicals Ltd (Oxford, Connecticut, USA). Tri Reagent for RNA isolation was obtained from Molecular Research Center (Cincinnati, Ohio, USA). Forward and reverse primers were synthesised by the Tufts University Core Facility (Boston, Massachusetts, USA). All chemicals related to quantitative polymerase chain reaction (PCR) were purchased from Bio-Rad (Hercules, California, USA). Unless otherwise stated, all reagents were of analytical grade and purchased from Sigma Chemical Co.
Animal feeding and treatment protocol
The dry control diet contained 16.8% protein, 17.9% fat, and 53% carbohydrates (w/w). The dry ethanol diet contained 28.4% protein, 30.3% fat, and 20.9% carbohydrates (w/w). Once reconstituted with water (control diet) or water and (6.4% v/v) alcohol (ethanol stock diet), the caloric profile of the control diet was 180 kcal/l protein, 350 kcal/l fat, and 470 kcal/l carbohydrates whereas the profile of the ethanol diet was 180 kcal/l protein, 350 kcal/l fat, 115 kcal/l carbohydrates, and 355 kcal/l ethanol. To prepare the 12% and 24% ethanol derived calories diet, 1 and 2 volumes of the ethanol stock diet were mixed with 2 and 1 volumes of control diet, respectively. After receiving a control non-ethanol containing diet for three days, experimental animals were given a diet with 12% of calories as ethanol for four days while the control group continued to receive the ethanol free diet. After this initial week, the experimental animals were advanced to a diet containing 24% of calories as ethanol while the control group continued to receive the ethanol free diet. Both groups remained on their respective diets for the subsequent eight weeks. During this period, singly housed mice in both the control and experimental groups were given 16 ml of diet (16 kcal) per animal per day and they consumed all of the food that was offered. At this time, randomly selected mice in both the ethanol fed and non-ethanol fed groups were exposed to repeated episodes of caerulein induced acute pancreatic injury while all animals remained on their respective diets. Those selected to receive caerulein were given seven hourly intraperitoneal injections of a supramaximally stimulating dose of caerulein (50 µg/kg/injection) on three alternate days of three consecutive weeks while those not selected to receive caerulein were given comparable injections of vehicle alone. During this period, diet administration to the mice in all groups was reduced to only 12 ml or 12 kcal/day to compensate for reduced food consumption by the caerulein treated animals. With this approach, the offered food was completely consumed by all animals. After three weeks of caerulein or vehicle administration, mice received 16 kcal per day of their respective diets and they were sacrificed 1, 3, and 5 weeks later.
Measurement of blood ethanol
Blood ethanol levels were measured using alcohol dehydrogenase to convert ethanol to acetaldehyde and NAD to generate NADH, as described previously.11,12 NADH was quantitated by measuring absorption at 380 nm with a Cobas Fara autoanalyser using the ethanol L3K assay from Diagnostics Chemicals Ltd.
Evaluation of pancreas morphology
Samples of pancreas were fixed, paraffin embedded, and stained with haematoxylin-eosin for standard histological examination. Other samples were stained with Sirius red to detect collagen. For this purpose, 5 μm sections were initially exposed to Weigert’s haematoxylin for 10 minutes to stain nuclei. After washing, they were stained with 0.1% Sirius red F3B in a saturated solution of picric acid for 1 hour, washed with acetic acid (30% in water) for 10 minutes, dehydrated, cleared with xylenes, and mounted as described previously.13,14 Under these conditions, the cytoplasm appears yellow, the nuclei appear green, and collagen fibres appear red. Each of the sections was examined by an experienced observer not familiar with the sample identity.
Evaluation of gene expression
Quantitative reverse transcription (RT)-PCR was used to evaluate expression of α-smooth muscle actin (α-SMA), α-1 collagen I, transforming growth factor β (TGF-β), tissue inhibitor of metalloproteinase 1 (TIMP-1), and matrix metalloproteinase 9 (MMP-9). For these studies, RNA was isolated using the Chomczynski methods with minor modifications.15 The pancreas was removed and immediately homogenised by means of a Tissue Tearor in Trizol Reagent containing1% β-mercaptoethanol. RNA was separated from DNA and proteins by chloroform extraction. RNA extraction was repeated and the final RNA was precipitated with isopropanol and washed with ethanol. RNA was dissolved in formamide and 5 µg were used for reverse transcription with the AMV transcriptase (Promega, Madison, Wisconsin, USA). Primers were used at final concentrations of 0.3 µM for each primer and produced a 300–520 bp amplicon. The primers used were as follows:
α-SMA (475 bp): forward 130TCA GGG AGT AAT GGT TGG AAT G152; reverse 624TCG GCA GTA GTC ACG AAG GAA604
α-1 collagen I (516 bp): forward 246GGG CGA GTG CTG TGC TTT CTG266; reverse 782CCT CGG TGT CCC TTC ATT CCA G761
TGF-β1 (356 bp): forward 1610GCA CCA TCC ATG ACA TGA ACC G1631; reverse 1988GCT TAG AGC CAC GAC CAT ACA GA1965
MMP-9 (398 bp): forward 954CAC AGC CAA CTA TGA CCA GGA T975; reverse 1345GCT TAG AGC CAC GAC GA1329
TIMP-1 (335 bp): forward 151CCA CAA TCC AAC GAG ACC ACC172 ; reverse 485GGG ATA GAT AAA CAG GGA AAC ACT462
acidic ribophosphoprotein (489 bp): forward 533AAG ACT GGA ACA AGG TGG GA553; reverse 1021TTG GTT ACT TTG GCG GGA TTA1001.
Quantitative RT-PCR was performed using an iCycler (Bio-Rad) with the software and graphics programs provided by the manufacturer. Taq activation was performed at 95°C for 15 minutes, and 45 cycles of PCR with denaturing at 95°C for 30 seconds, annealing at 58°C for 30 seconds, and extension at 72°C for 45 seconds. The SYBR green fluorescence was monitored during each extension step and provided both real time and quantitative measurements of the fluorescence. Melt curves and first derivative melt curves were run immediately after the last PCR cycle. Melt curves were produced by plotting fluorescence intensity against temperature as the temperature was increased from 60 to 95°C at 0.1°C/s. Data were collected and viewed using the software and graphics programs provided with the iCycler. For confirmation of amplicon presence and purity, the real time PCR product was occasionally run on a 2% agarose gel, stained with ethidium bromide, and photographed
Quantitation was carried out using an external standard curve. The amount of DNA used for the external standard curve was calculated from spectrophotometrically quantitated amounts of PCR derived DNA using the following formula:
(X g DNA/µl/[PCR length in base pairs × 660]) × 6.022 × 1023 = n of molecules/µl.
The external standard cDNA template used for this real time PCR was generated with positive cDNA samples, for each gene separately using 0.1 fg to 10 pg DNA, amplified by PCR using a PTC-100 DNA thermal cycler (MJ Research, Watertown, Massachusetts, USA) at 94°C for 15 minutes and 30 cycles at 94°C for 30 seconds, 58°C for 30 seconds, and 72°C for 45 seconds, with extension at 72°C for 10 minutes at the last cycle. The size of the amplified product was confirmed by ethidium bromide staining of 2% agarose gels. The amplified fragment was gel purified using the Qiagen PCR purification kit and sequence confirmed.
Quantitation of tissue collagen content
Pancreas collagen content was quantitated by measuring HO-proline content after proteinase K digestion and HCl hydrolysis of pancreas samples (20 mg), as described by Ellis and colleagues.16 Samples (100 µl) were lyophilised and subjected to vapour phase hydrolysis with 6 N HCl at 110°C for 16 hours. Hydrolysed samples were dissolved in 100 µl H2O and 40 µl were added to a microplate followed by 40 µl of freshly prepared chloramine T solution (1.4% chloramine T in 0.8 M sodium acetate, citric acid pH 6.2, and 31% isopropanol). After four minutes, 150 µl of dimethylaminobenzaldehyde reagent (5% p-dimethylaminobenzaldehyde in 15% perchloric acid and 75% isopropanol) were added. The microplate was placed in a 60°C oven for 35 minutes, cooled for five minutes to room temperature, and absorbance at 550 nm determined. The concentration of HO-proline was determined by comparison of the obtained values to a standard curve prepared with known quantities of HO-proline.
Analysis of data
Results reported were obtained from at least three independent experiments. To satisfy the assumption of normality, values were transformed to their natural logarithms. Analyses were performed using a two factor ANOVA for each parameter. All p values were considered significant when p<0.01.
RESULTS
Effects of the ethanol containing diet on mouse growth and weight
Anecdotal reports from others had suggested that mice would resist consumption of the ethanol containing diet and, as a result, they would lose weight and fail to grow. This was not our experience. As noted above, mice consumed all of the diet administered, regardless of whether or not it contained ethanol. However, to further and more objectively examine the possibility that ethanol administration might adversely effect the nutritional status of the mice, mice were weighed after consuming either the ethanol free diet or the “24% of calories as ethanol” diet for either three or six weeks. As shown in fig 1 ▶, the weight of mice receiving the ethanol free and ethanol containing diet for three weeks was similar and weight gain over the subsequent three weeks was not altered by administration of the ethanol containing diet.
Figure 1.

Effect of ethanol containing diet on mouse weight and weight gain. Seven mice were fed either the ethanol free (C) Lieber-DeCarli diet and 12 mice were fed the Lieber-DeCarli liquid diet containing 24% of calories as ethanol (E), as described in the text, and weighed after 3 (3W) or 6 (6W) weeks. Whiskers indicate 5 and 95% percentiles.
Effect of the ethanol containing diet on blood ethanol levels
To monitor the effects of the “24% of calories as ethanol” diet on blood ethanol levels, mice (n = 12) that had previously received the ethanol containing diet for three weeks were given fresh ethanol containing diet in the afternoon, two hours before initiation of the dark cycle. They were sacrificed at six hour intervals thereafter for measurement of serum ethanol. As shown in fig 2 ▶, administration of the ethanol containing diet resulted in a marked and persistent, but mildly fluctuating, elevation in serum ethanol levels. Serum ethanol levels ranged from 82 to 125 mM. Consistent with the fact that mice are nocturnal feeders, the highest serum ethanol levels were noted at the 10pm sampling time.
Figure 2.

Effect of the ethanol containing diet on blood ethanol (EtOH) levels. Mice (n = 12) were fed the Lieber-DeCarli diet containing 24% of calories as ethanol for three weeks. To evaluate the effects of the diet on blood ethanol levels, fresh diet was then administered at 4pm and blood samples were collected at selected times. Blood ethanol levels were measured as described in the text.
Effects of ethanol, caerulein, and ethanol plus caerulein on body weight and pancreas morphology
During the caerulein treatment phase, mild weight loss was noted in all animals and this loss was comparable in animals fed either the ethanol or control diet. After completion of the caerulein treatment phase, all animals began to gain weight and, by five weeks after the last dose of caerulein, the weights in each group were similar (for example, control diet/caerulein = 31.6 g (95% confidence interval (CI) 28.7–34.6); ethanol diet/caerulein = 28.5 (95% CI 25.5–31.4); p = 0.12).
Light microscopic examination of haematoxylin-eosin stained sections revealed normal morphology in samples obtained from mice fed either the ethanol free or ethanol containing diet but not given caerulein. Similar observations were made in samples obtained three and five weeks after the last dose of caerulein had been given to animals fed the ethanol free diet. In contrast, samples obtained three and five weeks after the last dose of caerulein had been given to mice fed the ethanol containing diet revealed the presence of fibrosis in pancreatic parenchyma (fig 3 ▶).
Figure 3.

Effects of ethanol (EtOH), caerulein, and EtOH plus caerulein on pancreas morphology. Mice were fed the EtOH free (control) or EtOH containing diet for eight weeks and then given repeated injections of caerulein or vehicle, as described in the text. They were sacrificed and pancreatic morphology after staining samples with haematoxylin-eosin was evaluated. Photomicrographs are representative of sections from animals sacrificed five weeks after the last caerulein injection. They were examined by an observer not familiar with sample identity.
Sirius red stained samples indicated that collagen deposition was not increased at any of the times studied in samples taken from the control or ethanol fed mice that were not given caerulein. Sirius red staining was increased one week and gradually decreased three and five weeks after caerulein treatment of mice fed the ethanol free diet. In contrast, more robust Sirius red staining was observed 1, 3, and 5 weeks after caerulein treatment of ethanol fed mice (fig 4 ▶). For the most part, Sirius red staining was most intense in periacinar regions of the pancreatic parenchyma (fig 4 ▶).
Figure 4.

Effects of ethanol (EtOH), caerulein, and EtOH plus caerulein on Sirius red staining of pancreas samples. Animal groups and feeding protocols are as described in fig 3 ▶ and photomicrographs depict adjacent sections to those shown in fig 3 ▶. Sirius red stains collagen red. Note intense red periacinar staining in sample taken from the EtOH fed mouse given caerulein but not in samples taken from animals in the other treatment groups.
Effects of ethanol, caerulein, and ethanol plus caerulein on expression of fibrosis related genes
Quantitative RT-PCR was used to evaluate expression of fibrosis related genes, one and three weeks after the last dose of caerulein or vehicle. Expression of the housekeeping gene acidic ribophosphoprotein (ARP), was not significantly altered in any of the animal groups studied (fig 5 ▶). Expression of α-SMA, TGF-β1, α-1 collagen I, TIMP-1, and MMP-9 was found to be similar, at both times studied, in animals given either the ethanol free or ethanol containing diet but not exposed to caerulein induced injury (fig 5 ▶). Expression of each of these genes was increased one week after caerulein induced injury of mice fed the ethanol free diet but the magnitude of that expression was either similar or somewhat lower by three weeks after the final dose of caerulein.
Figure 5.
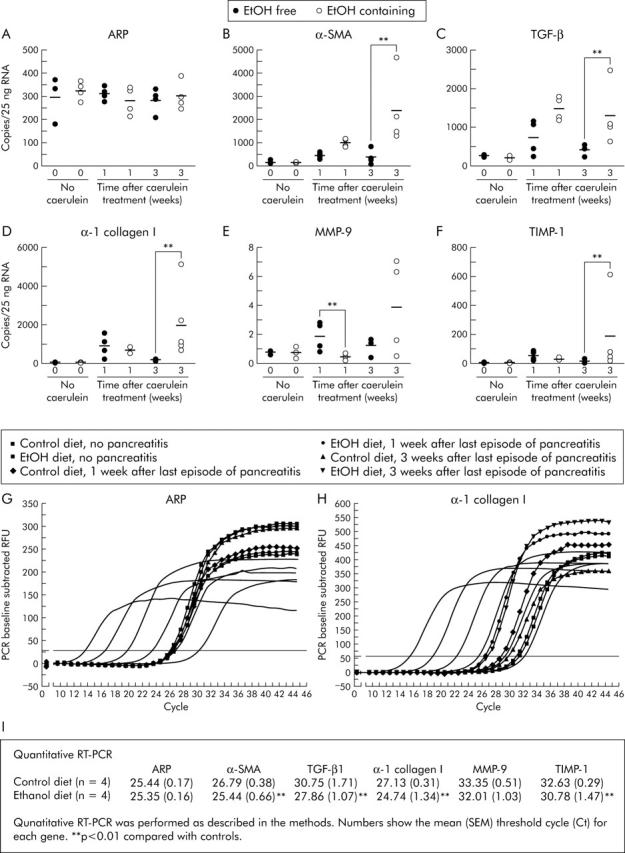
Effect of ethanol, caerulein, and ethanol plus caerulein on expression of genes related to fibrosis. Mice received the ethanol (EtOH) free or EtOH containing diet for 12 weeks. During the final three weeks, animals in each group received three series of caerulein injections per week for three consecutive weeks, as described in the text. They were then maintained on their respective diets and sacrificed one or three weeks later. Quantitative reverse transcription-polymerase chain reaction (PCR) for (B) α-smooth muscle actin (α-SMA), (C) transforming growth factor β (TGF-β1), (D) α-1 collagen I, (E) matrix metalloproteinase 9 (MMP-9), and (F) tissue inhibitor of metalloproteinase 1 (TIMP-1) was performed, as described in the methods. Data shown are from individual mice and bars reflect the mean obtained from three or more animals in each group. Expression of acidic ribophosphoprotein (ARP), a housekeeping gene, was measured and used as a control (A). **p<0.01, caerulein treated animals fed the ethanol containing diet compared with those from caerulein treated animals fed the ethanol free diet. (G, H) PCR amplification/cycle graphs for ARP and α-1 collagen I. The curves without symbols represent the amplification obtained using 0.1 fg to 10 pg of cDNA. The curves with symbols are from representative mice as shown in the figure. Similar curves were obtained for α-SMA, TGF-β1, TIMP-1, and MMP-9. (I) Mean (SEM) threshold cycle (Ct) for each gene from animals, three weeks after the last episode of pancreatitis. **p<0.01, mice fed the ethanol containing diet compared with mice fed the control diet.
In contrast with these mild and transient changes following caerulein induced acute injury in non-ethanol fed mice, a profibrotic expression pattern was observed in samples taken from ethanol fed mice that experienced caerulein induced acute injury (fig 5 ▶). Compared with non-ethanol fed mice that experienced caerulein induced pancreatic injury, expression of α-SMA and TGF-β1 in ethanol fed mice was further increased one and three weeks after the final dose of caerulein. Type 1 collagen expression and TIMP 1 expression were also further increased in the ethanol fed mice three weeks after the final dose of caerulein. Finally, MMP-9 expression was transiently reduced one week after the final dose of caerulein in the ethanol fed group compared with non-ethanol fed animals that received caerulein.
Effects of ethanol, caerulein, and ethanol plus caerulein on pancreatic collagen content
Pancreas collagen content was evaluated by measuring tissue HO-proline levels 1, 3, and 5 weeks after the last dose of caerulein or vehicle. As shown in fig 6 ▶, HO-proline content was not altered in animals given the ethanol containing diet but not exposed to caerulein induced acute injury. One week after the end of the caerulein induced acute injury, HO-proline content was elevated in animals fed the non-ethanol containing diet. Levels of HO-proline however declined over the following weeks to reach physiological levels five weeks after the last caerulein injection. When ethanol fed mice were exposed to caerulein induced acute injury, however, a more profound (already after the first week) and longlasting (up to five weeks) increase in HO-proline content was noted. Compared with the non-ethanol fed animals given caerulein, pancreas HO-proline content was significantly (p<0.01) increased in ethanol fed animals five weeks after the final dose of caerulein.
Figure 6.

Effect of ethanol, caerulein, and ethanol plus caerulein on pancreas hydroxyproline (HO-proline) content. Animal groups are as described in fig 5 ▶. Animals were sacrificed 1, 3, and 5 weeks after the final injection of caerulein. **p<0.01, logarithmic values from caerulein treated animals fed the ethanol (EtOH) containing diet compared with caerulein treated animals fed the EtOH free diet.
DISCUSSION
Previously reported efforts to develop models of experimental chronic pancreatitis can be separated into the following three groups: (a) those that involve ethanol induced sensitisation of either the pancreas in vivo or pancreatic cells in vitro to acute injury5,6,8,17; (b) those that involve in vitro exposure of pancreatic cells (that is, acinar cells or stellate cells) to agents implicated in ethanol induced pancreatitis18–20; and (c) those that involve administration of ethanol to rats.3 While studies employing each of these approaches have provided valuable insights into the overall issue of chronic pancreatitis, each of these types of model have significant limitations. For example, those models which involve ethanol sensitisation of the pancreas to acute injury5,6,8,17 are in reality models of ethanol induced acute pancreatitis and not models of chronic pancreatitis. Models which involve in vitro exposure of pancreatic cells, either acinar cells or stellate cells, to factors implicated in the pathogenesis of chronic pancreatitis18–20 may overlook significant cell-cell and tissue-tissue interactions that are important to the evolution of chronic pancreatitis. Finally, those that involve administration of ethanol to rats3 cannot be applied to mice and, as a result, do not take advantage of the numerous currently available genetically altered mouse strains that are ideally suited to mechanistic studies.
Here we described a model of ethanol dependent pancreatic fibrosis similar to that seen in chronic pancreatitis, which we believe overcomes most of these limitations. The model involves prolonged administration of an ethanol containing diet to mice and, after an eight week period of ethanol feeding, three weeks of repeated caerulein induced acute pancreatic injury. The model is characterised by deposition of collagen in the periacinar region of the pancreatic parenchyma, a profibrotic pattern of gene expression, and persistently increased pancreatic content of collagen. These changes are dependent on exposure to ethanol (that is, they are not observed when non-ethanol fed mice are subjected to caerulein induced acute injury).
None of the changes that characterise this model of ethanol dependent pancreatic fibrosis are observed in mice that are fed ethanol but not subjected to caerulein induced acute injury. We, along with many other groups, have noted that prolonged administration of an ethanol containing diet to experimental animals elicits little, if any, of the changes that are typical of chronic pancreatitis and, from a clinical standpoint, only a small fraction of chronic alcoholics ever develop chronic pancreatitis. These various observations suggest that ethanol, even at high concentrations and for prolonged periods, is not by itself the sole cause of pancreatic fibrosis and/or chronic pancreatitis. Rather, they suggest to us, as they have to others, that ethanol may be only part of the cause (that is, it may sensitise the pancreas to other injurious agents or cell biological events).
Ideally, a pair feeding protocol might have been the preferred method of administering an ethanol containing diet to our mice. Rather than adopt the pair feeding approach, we chose to restrict the volume of diet offered to the animals (16 kcal/day) and, as a result, the animals in each group consumed equal amounts of their assigned diets. The weight of animals receiving the ethanol containing diet was not different from that of animals given the ethanol free control diet. With administration of caerulein and induction of acute pancreatic injury, food intake was noted to decrease and this decrease in voluntary consumption led us to reduce the amount of each diet offered to the animals during the caerulein treatment phase of the protocol. With that reduced amount of diet, animals continued to consume all of the diet administered and, as a result, diet consumption by all groups was equal.
The currently reported studies were designed to develop and characterise an ethanol dependent model of pancreatic fibrosis and chronic pancreatitis in mice and, to a considerable extent, that goal has been reached. We have shown that prolonged administration of an ethanol containing diet, when combined with induction of acute pancreatic injury, leads to periacinar deposition of collagen and a persistent increase in pancreatic collagen content.
In the process of characterising this model however, some tantalising preliminary observations have been made which may provide clues to pathophysiological mechanisms that are involved in the evolution of chronic pancreatitis. We have found that induction of acute injury, by repeated supramaximal stimulation with caerulein, leads to changes suggestive of stellate cell activation (that is, increased expression of α-SMA and α-1 collagen I) even in the absence of an ethanol containing diet. We have also found that, in the absence of an ethanol containing diet, repeated episodes of caerulein induced injury lead to upregulated expression of both the profibrogenetic factor TGF-β1 and TIMP-1, an inhibitor of matrix degrading MMPs. Similar observations have been previously reported by Neuschwander-Tetri and colleagues21,22 who characterised an ethanol independent model of chronic pancreatitis that was induced by repeated (up to 10 weeks) administration of injurious doses of caerulein to mice fed a standard non-ethanol diet. According to this model, increased expression of α-1 collagen I mRNA already starts two weeks after the beginning of caerulein injections and is maintained throughout the experiment.21 Our studies have shown that each of the profibrogenetic changes that we observed were only transient when they were triggered by repeated caerulein induced injury of animals that had not been exposed to ethanol.
From a pathophysiological standpoint, our studies suggest that ethanol may contribute to the development of pancreatic fibrosis and chronic pancreatitis by sensitising the pancreas to these injury related changes (that is, by converting transient into persistent changes). We have found, for example, that α-SMA, α-1 collagen I, TGF-β, and TIMP-1 expression are each further upregulated and more persistent in animals who have been given the ethanol containing diet and caerulein compared with those that experienced caerulein induced injury superimposed on administration of the non-ethanol diet. Similarly, administration of the ethanol containing diet leads to transient downregulation of the matrix degrading enzyme MMP-9. Our observations are consistent with the hypothesis that: (a) ethanol itself does not trigger pancreatic fibrosis or chronic pancreatitis; (b) repeated episodes of injury trigger changes compatible with induction of chronic pancreatitis but these changes are only transient in the absence of ethanol; and (c) ethanol converts the transient changes associated with repeated injury into persistent changes that characterise chronic pancreatitis. Additional studies, including those that monitor levels of these various enzymes and profibrotic factors at the protein, rather than at the RNA, level will be needed to evaluate this important issue. Our preliminary observations lead us to speculate that clinical chronic pancreatitis may also be the result of repeated ethanol independent episodes of acute pancreatic injury which, in the absence of ethanol, would only lead to transient reversible changes but which, when superimposed on a background of chronically elevated blood ethanol levels, lead to pancreatic fibrosis and chronic pancreatitis.
In summary, we have described a murine model of ethanol dependent pancreatic fibrosis. In this model, administration of an ethanol containing diet appeared to promote persistence of the profibrotic responses that are elicited by repeated acute pancreatic injury. Clinical ethanol dependent chronic pancreatitis however is characterised by pancreatic exocrine atrophy and chronic inflammation in addition to fibrosis and, while we have observed inflammatory changes during the early period after caerulein treatment of ethanol fed mice in our model, chronic pancreatic inflammation was not observed five weeks after the last episode of acute pancreatic injury. Furthermore, no changes indicative of exocrine atrophy were observed in our model. To this extent, therefore, the currently described model could be considered primarily a model of ethanol dependent pancreatic fibrosis as the full spectrum of changes typical of chronic pancreatitis was not observed in this model. In spite of this limitation, however, our model may prove especially useful for future studies aimed at elucidating the mechanisms responsible for ethanol dependent chronic pancreatitis since, in contrast with previously described models3,4 in which fibrosis appears to be short lived (that is, one week), fibrosis in our model persisted for at least five weeks. This persistence of fibrosis will facilitate future studies designed to examine interventions that either promote or limit fibrosis. Furthermore, the fact that ours is a murine model will enable mechanistic studies that employ genetically altered mouse strains.
Acknowledgments
We would like to thank Robin Ruthazer, MPH at the Biostatistics Research Center at Tufts-New England Medical Center for her help with the statistical analysis, Dr Cederbaum at the Mount Sinai School of Medicine (New York, NY) for valuable information regarding the ethanol diet on mice, and Dr Neuschwander-Tetri (St Louis University, St Louis, MO) for providing us with a protocol for isolation of RNA. These studies were supported by grant RO1-AM31396-20 from the National Institutes of Health (to MLS) and the P30-DK34928-20 (to Tufts-NEMC GRASP Center). All experiments were approved by the Tuft-NEMC Institutional Animal Care and Use Committee.
Abbreviations
α-SMA, α-smooth muscle actin
TGF-β, transforming growth factor β
MMP-9, matrix metalloproteinase 9
TIMP-1, tissue inhibitor of metalloproteinase 1
RT-PCR, reverse transcription-polymerase chain reaction
ARP, acidic ribophosphoprotein
Conflict of interest: None declared.
Published online first 3 May 2005
REFERENCES
- 1.Siegmund S, Haas S, Schneider A, et al. Animal models in gastrointestinal alcohol research—a short appraisal of the different models and their results. Best Pract Res Clin Gastroenterol 2003;17:519–42. [DOI] [PubMed] [Google Scholar]
- 2.Schneider A, Whitcomb DC, Singer MV. Animal models in alcoholic pancreatitis—what can we learn? Pancreatology 2002;2:189–203. [DOI] [PubMed] [Google Scholar]
- 3.Pandol SJ, Gukovsky I, Satoh A, et al. Animal and in vitro models of alcoholic pancreatitis: role of cholecystokinin. Pancreas 2003;27:297–300. [DOI] [PubMed] [Google Scholar]
- 4.Deng X, Wang L, Elm MS, et al. Chronic alcohol consumption accelerates fibrosis in response to cerulein-induced pancreatitis in rats. Am J Pathol 2005;166:93–106. [DOI] [PMC free article] [PubMed] [Google Scholar]
- 5.Jerrells TR, Chapman N, Clemens DL. Animal model of alcoholic pancreatitis: role of viral infections. Pancreas 2003;27:301–4. [DOI] [PubMed] [Google Scholar]
- 6.Pandol SJ, Periskic S, Gukovsky I, et al. Ethanol diet increases the sensitivity of rats to pancreatitis induced by cholecystokinin octapeptide. Gastroenterology 1999;117:706–16. [DOI] [PubMed] [Google Scholar]
- 7.Apte MV, Wilson JS. Stellate cell activation in alcoholic pancreatitis. Pancreas 2003;27:316–20. [DOI] [PubMed] [Google Scholar]
- 8.Lu Z, Karne S, Kolodecik T, et al. Alcohols enhance caerulein-induced zymogen activation in pancreatic acinar cells. Am J Physiol Gastrointest Liver Physiol 2002;282:G501–7. [DOI] [PMC free article] [PubMed] [Google Scholar]
- 9.Gukovskaya AS, Hosseini S, Satoh A, et al. Ethanol differentially regulates NF-kappaB activation in pancreatic acinar cells through calcium and protein kinase C pathways. Am J Physiol Gastrointest Liver Physiol 2004;286:G204–13. [DOI] [PubMed] [Google Scholar]
- 10.Masamune A, Kikuta K, Satoh M, et al. Alcohol activates activator protein-1 and mitogen-activated protein kinases in rat pancreatic stellate cells. J Pharmacol Exp Ther 2002;302:36–42. [DOI] [PubMed] [Google Scholar]
- 11.Bonnichsen RK, Theorell H. An enzymatic method for the microdetermination of ethanol. Scand J Clin Lab Invest 1951;3:58–62. [DOI] [PubMed] [Google Scholar]
- 12.Lundquist F. The determination of ethyl alcohol in blood and tissues. In: Glick D, ed. Methods of biochemical analysis. New York: Interscience Publishers, 1957:217–51.
- 13.Junqueira LCU, Bingolas G, Brentani RR. Picrosirius staining plus polarization microscopy, a specific method for collagen detection in tissue sections. Histochem J 1979;11:447–55. [DOI] [PubMed] [Google Scholar]
- 14.Puchtler H, Waldrop FS, Valentine LS. Polarization microscopic studies of connective tissue stained with picro-sirius red FBA. Beitr Pathol 1973;150:174–87. [DOI] [PubMed] [Google Scholar]
- 15.Chomczynski P, Sacchi N. Single-step method of RNA isolation by acid guanidinium thiocyanate-phenol-chloroform extraction. Anal Biochem 1987;162:156–9. [DOI] [PubMed] [Google Scholar]
- 16.Ellis AJ, Curry VA, Powell EK, et al. The prevention of collagen breakdown in bovine nasal cartilage by TIMP, TIMP-2 and a low molecular weight synthetic inhibitor. Biochem Biophys Res Commun 1994;201:94–101. [DOI] [PubMed] [Google Scholar]
- 17.Gukovskaya AS, Mouria M, Gukovsky I, et al. Ethanol metabolism and transcription factor activation in pancreatic acinar cells in rats. Gastroenterology 2002;122:106–18. [DOI] [PubMed] [Google Scholar]
- 18.Apte MV, Norton ID, Wilson JS. Ethanol induced acinar cell injury. Alcohol Alcohol Suppl 1994;2:365–8. [PubMed] [Google Scholar]
- 19.Apte MV, Phillips PA, Fahmy RG, et al. Does alcohol directly stimulate pancreatic fibrogenesis? Studies with rat pancreatic stellate cells. Gastroenterology 2000;118:780–94. [DOI] [PubMed] [Google Scholar]
- 20.Schneider E, Schmid-Kotsas A, Zhao J, et al. Identification of mediators stimulating proliferation and matrix synthesis of rat pancreatic stellate cells. Am J Physiol Cell Physiol 2001;281:C532–43. [DOI] [PubMed] [Google Scholar]
- 21.Neuschwander-Tetri BA, Burton FR, Presti ME, et al. Repetitive self-limited acute pancreatitis induces pancreatic fibrogenesis in the mouse. Dig Dis Sci 2000;45:665–74. [DOI] [PubMed] [Google Scholar]
- 22.Neuschwander-Tetri BA, Bridle KR, Wells LD, et al. Repetitive acute pancreatic injury in the mouse induces procollagen alpha1(I) expression colocalized to pancreatic stellate cells. Lab Invest 2000;80:143–50. [DOI] [PubMed] [Google Scholar]