

Abstract
Background: Population based mortality rates from liver cirrhosis, and alcohol consumption, have increased sharply in Britain in the past 35 years. Little is known about the long term trends over time in mortality rates after hospital admission for liver cirrhosis.
Aims: To analyse time trends in mortality in the year after admission for liver cirrhosis from 1968 to 1999.
Subjects: A total of 8192 people who were admitted to hospital in a defined population of Southern England.
Methods: Analysis of hospital discharge statistics linked to death certificate data. The main outcome measures were case fatality rates (CFRs) and standardised mortality ratios (SMRs).
Results: At 30 days after admission, CFR was 15.9% and the SMR was 93 (86 in men and 102 in women, compared with 1 in the general population). At one year, the overall CFR was 33.6% and SMR was 16.3. There was no improvement from 1968 to 1999 in mortality rates. SMRs were highest for alcoholic cirrhosis of the liver (27.4 at one year) but lower for biliary cirrhosis (11.4) and chronic hepatitis (10.0). Mortality from most of the main causes of death, including accidents and suicides, was increased.
Conclusions: The high mortality rates after hospital admission, and the fact that they have not fallen in the past 30 years, show that liver cirrhosis remains a disease with a very poor prognosis. Increased mortality from accidents, suicides, and mental disorders, particularly among those with alcoholic cirrhoses, indicates that prognosis is influenced by behavioural as well as by physical pathology.
Keywords: liver cirrhosis, alcohol, hospital admission, prognosis, mortality
Liver cirrhosis and its complications are a major cause of morbidity and mortality in the Western world. Population based mortality rates from liver cirrhosis (chronic liver disease and cirrhosis) have increased by over threefold in England in the past 35 years.1,2 Concerns about this, and about the large increases in national alcohol consumption,3,4 have led to the recent development of a national alcohol harm reduction strategy.5 Trends in population based mortality rates in other Western countries are also well documented, but rates have fallen in most of these countries in recent years.6,7,8,9,10,11,12,13,14,15,16 Although several, mainly small, studies have reported on the poor prognosis of liver cirrhosis,17–21 there are few data reporting trends over time in post-admission mortality rates for patients admitted to hospital with liver cirrhosis.6 We used a unique large record linkage database in England to study long term trends in mortality rates after admission for liver cirrhosis, for a defined population from 1968 to 1999.
METHODS
Study population
The Oxford record linkage study comprises hospital discharge statistics that were systematically linked by the former Oxford NHS Regional Health Authority to data from death certificates. Hospital data were collected as the routine Hospital Activity Analysis systems (1968–86) or Hospital Episode Statistics (1987–1999), similar to these databases in other English NHS regions. The data covered two health districts and their constituent hospitals in the former Oxford National Health Service region from 1968 1974 (population of 0.9 million), six health districts from 1975 to 1986 (population 1.8 million), and eight districts from 1987 to 1999 (2.5 million). The data are now archived and anonymised.
We included all admissions among residents of the Oxford record linkage study region that included chronic liver disease and cirrhosis in any position on the hospital admission record (which we termed as the index admission), but excluded episodes of readmission that occurred within 365 days of a previous admission. At the end of each 365 day follow up period, any new admission for chronic liver disease and cirrhosis was included as a new index admission and was analysed for a subsequent period of one year of follow up. Additionally, we also present analyses using only the first admission for each person identified during the study period. Admissions for those aged under 15 years were excluded as the aetiologies of chronic liver disease and cirrhosis in children, usually due to inborn errors of metabolism or malformations, are normally distinct from those in adults.
For brevity in the text, and following convention, we have referred to “chronic liver disease and cirrhosis” as “liver cirrhosis”. For the purposes of some analyses, we grouped the International Classification of Diseases (ICD) rubrics for “alcoholic hepatitis”, “alcoholic cirrhosis of the liver”, and “other and unspecified alcoholic liver cirrhosis and disease” as “alcoholic cirrhoses”; and we grouped “chronic hepatitis”, “biliary cirrhosis”, and “other and unspecified liver cirrhosis and disease without mention of alcohol” as “non-alcoholic cirrhoses”. The ICD code used for liver cirrhosis was 571 in the ICD-8th and 9th revisions, and K70, K73, K74, and K76.0 in ICD-10. The codes 571.0 (ICD-8), 571.0–571.3 (ICD-9), and K70 (ICD-10) were used for alcoholic liver cirrhoses, and 571.9 (ICD-8), 571.4–571.9 (ICD-9), and K73, K74, and K76.0 were used for non-alcoholic liver cirrhoses. Subtypes such as alcoholic hepatitis, chronic hepatitis, and biliary cirrhosis were distinguishable from ICD-9 onwards (that is, for the period 1979–1998 only). The study period covered admissions from 1 January 1968 to 31 March 1998, with linkage to death certificates up to 31 March 1999.
Statistical methods
Case fatality rates (CFRs) were calculated from the day of admission, using admissions for liver cirrhosis as the denominator and subsequent deaths from any cause as the numerator. Standardised mortality ratios (SMRs) were calculated to compare mortality in the patient populations with that in the general population, using the indirect method, and applying the age and sex specific mortality rates in the Oxford regional population to the number of people admitted for liver cirrhosis in the equivalent age and sex strata. Cause specific SMRs were calculated using the underlying cause of death on the death certificate for deaths from natural causes, and coroners’ verdicts of “accidental death” for accidents and “suicide” or “open verdict” for suicides.
Relative survival over time was calculated as the ratio of the observed survival in those hospitalised for the different aetiologies of liver cirrhosis to that expected in the Oxford regional population of the same age and sex during the same time period. The influence on survival of sociodemographic characteristics such as age group, sex, and social class was presented using odds ratios derived through Cox’s proportional hazards survival models, incorporating time dependent covariates where appropriate to satisfy the proportional hazards assumption. Other statistical methods used include logistic regression modelling to test for significance of trends in CFRs, χ2 tests, and t tests.
RESULTS
There were 8192 people admitted to hospital with liver cirrhosis from 1968 to 1999; 4511 (55.1%) were men. Mean age of patients was 57.5 (SD 14.2) years overall; men 56.2 (SD 14.1) years, women 59.6 (SD 14.2) years. Excluding readmissions for patients when they occurred within one year of a previous admission for liver cirrhosis, 6510 (79.5%) were admitted on only one occasion, 1170 (14.3%) were admitted twice at least a year apart, 347 (4.2%) were admitted three times, and 165 (2.0%) on four or more occasions at least a year apart.
Of the 8192 index admissions, alcoholic liver cirrhoses were the principal diagnoses in 2802 (34.2%) cases and non-alcoholic liver cirrhoses in 2041 (24.9%). Liver cirrhosis was a secondary diagnosis in 3349 cases (40.1%), alongside principal diagnoses of other diseases of the digestive system (791; 23.6% of these 3349 cases), diseases of the circulatory system (665, 19.9%), diseases of the respiratory system (320, 9.6%), symptoms, signs, and ill defined conditions (316, 9.4%), neoplasms (234, 7.0%), injury and poisoning (170, 5.1%), mental disorders (133, 4.0%), and various other diseases (720, 21.5%).
Table 1 ▶ shows the demographic characteristics of the patients. Patients admitted with alcohol related liver cirrhoses were significantly younger (t = 15.4; p<0.001) and more commonly men (χ21 = 163; p<0.001) than those admitted with non-alcoholic liver cirrhoses. Patients admitted with alcoholic hepatitis were the youngest (mean age 47.7 years), and those with biliary cirrhosis the oldest (61.8 years).
Table 1.
Number of hospital admissions, and descriptive statistics for age and sex, and for subtypes of liver cirrhosis, 1968–98
| Principal diagnosis at admission | ICD-9 codes | No of admissions | Age (y) (mean (SD)) | No of admissions among men (%) |
| Alcoholic liver cirrhoses | 571.0–571.3 | 2802 | 53.3 (12.4) | 1717 (61.3%) |
| Alcoholic hepatitis* | 571.1 | 388 | 47.7 (12.6) | 238 (61.3%) |
| Alcoholic cirrhosis of liver* | 571.2 | 669 | 55.5 (12.1) | 400 (59.8%) |
| Other and unspecified alcoholic liver cirrhosis and disease* | 571.0, 571.3 | 1383 | 53.5 (12.3) | 864 (62.5%) |
| Non-alcoholic liver cirrhoses: | 571.4–571.9 | 2041 | 59.4 (14.9) | 871 (42.7%) |
| Chronic hepatitis* | 571.4 | 422 | 60.8 (11.1) | 165 (39.1%) |
| Biliary cirrhosis* | 571.6 | 322 | 61.8 (14.6) | 58 (18.0%) |
| Other and unspecified liver cirrhosis and disease without mention of alcohol* | 571.5, 571.8, 571.9 | 827 | 59.2 (14.3) | 441 (53.3%) |
| Liver cirrhosis as a secondary or subsidiary diagnosis | All other ICD codes | 3349 | 59.8 (14.4) | 1923 (57.4%) |
| All cases | 8192 | 57.5 (14.2) | 4511 (55.1%) |
*These subtypes were distinguishable from ICD-9 and ICD-10 coding only, and refer to the period 1979–98 only.
Mortality after hospital admission
In the first month after hospital admission, mortality was 86 times higher in men and 102 times higher in women than that in the general populations of men and women of equivalent age (SMR; mortality in the general population of equivalent age = 1) (fig 1A ▶). Mortality remained elevated throughout the year after admission: at month 12 it was still eight times higher than that in the general population. SMR was significantly higher in women than in men during the first month but there were no significant differences between women and men thereafter. Across the whole year after admission, SMR was 15.7 in men, 17.3 in women, and 16.3 overall.
Figure 1.
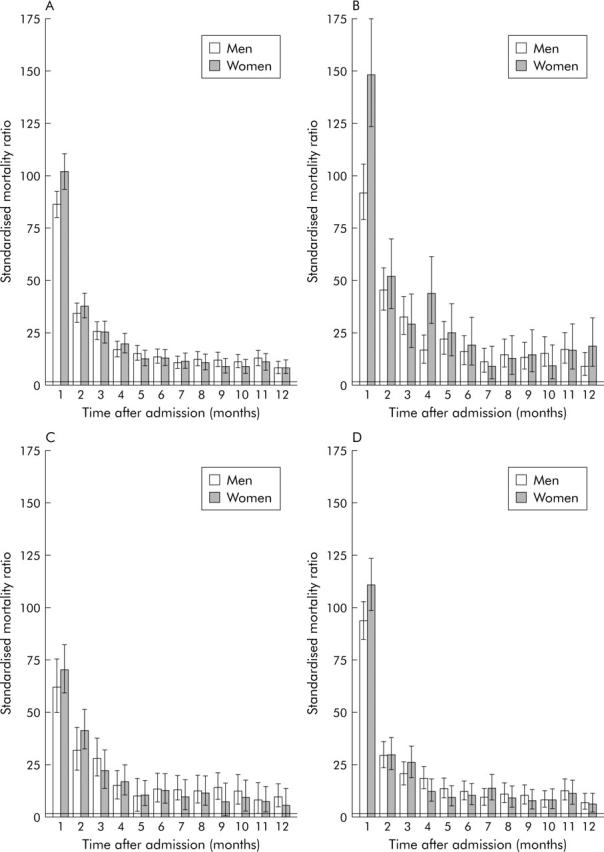
Standardised mortality ratios (SMRs) with 95% confidence intervals at monthly intervals following hospital admission for liver cirrhosis in men and women, 1968–98. (A) With all admissions for liver cirrhosis in any position on the admission record. (B) With alcoholic liver cirrhosis as the principal diagnosis. (C) With non-alcoholic liver cirrhosis as the principal diagnosis. (D) With liver cirrhosis as a secondary or subsidiary diagnosis.
Mortality was increased for all categories of cirrhotic patient but the highest SMRs were for subtypes that were alcohol related, and for those that often occurred in younger patients (table 2 ▶, fig 1 ▶), such as “alcoholic cirrhosis of the liver” (SMR at one year 27.4) and “other and unspecified alcoholic liver cirrhosis and disease” (SMR 21.5). SMRs were lower for biliary cirrhosis (11.4) and chronic hepatitis (10.0). There were no improvements in SMRs over time from 1968 to 1998 for any of the cirrhosis categories.
Table 2.
Number of hospital admissions for different subtypes of cirrhosis of the liver as the principal diagnosis, number of deaths, and standardised mortality ratios (SMRs) at 30 days and at 30–364 days after hospital admission, 1968–98
| Principal diagnosis at admission | No of hospital admissions | 30 day follow up | 30–364 day follow up | One year follow up | ||||||
| No of deaths | SMR | (95% CI) | No of deaths | SMR | (95% CI) | No of deaths | SMR | (95% CI) | ||
| Alcoholic liver cirrhoses | 2802 | 317 | 108 | (96.6, 121) | 458 | 16.8 | (15.3, 18.4) | 775 | 22.1 | (20.6, 23.7) |
| Alcoholic hepatitis* | 388 | 20 | 80.6 | (49.2, 120) | 39 | 15.7 | (11.1, 21.0) | 59 | 19.8 | (15.1, 25.1) |
| Alcoholic cirrhosis of liver* | 669 | 113 | 145 | (120, 174) | 143 | 22.0 | (18.5, 25.8) | 256 | 27.4 | (24.1, 30.8) |
| Other and unspecified alcoholic liver cirrhosis and disease* | 1383 | 146 | 102 | (86.2, 120) | 217 | 16.4 | (14.3, 18.7) | 363 | 21.5 | (19.3, 23.7) |
| Non-alcoholic liver cirrhoses | 2041 | 256 | 66.4 | (58.5, 74.8) | 392 | 12.0 | (10.8, 13.2) | 648 | 14.0 | (12.9, 15.1) |
| Chronic hepatitis* | 422 | 22 | 37.8 | (23.6, 55.2) | 49 | 8.6 | (6.3, 11.2) | 71 | 10.0 | (7.8, 12.5) |
| Biliary cirrhosis* | 322 | 13 | 28.7 | (15.2, 46.5) | 49 | 10.7 | (7.9, 13.9) | 62 | 11.4 | (8.7, 14.4) |
| Other and unspecified liver cirrhosis and disease without mention of alcohol* | 827 | 142 | 75.0 | (63.2, 87.8) | 208 | 13.5 | (11.7, 15.4) | 350 | 15.4 | (13.8, 17.1) |
| With liver cirrhosis as a secondary or subsidiary diagnosis | 3349 | 731 | 100 | (93.0, 108) | 602 | 11.0 | (10.2, 11.9) | 1333 | 15.2 | (14.4, 16.0) |
| All admissions | 8192 | 1304 | 92.5 | (87.6, 97.6) | 1452 | 12.7 | (12.1, 13.4) | 2756 | 16.3 | (15.7, 16.9) |
*These subtypes were distinguishable from ICD-9 and ICD-10 coding only, and refer to the period 1979–98 only.
95% CI, 95% confidence interval.
During the first month after hospital admission, the overall CFR was 15.9% (table 3 ▶). There was a slight but non significant reduction in the age and sex adjusted CFR over time from 17.4% in 1968–73 to 15.2% in 1994–98. However, because the decline in all-causes mortality among the general population was substantial over this period, the relative mortality among the study patients, expressed as SMRs, actually increased significantly from 77 in 1969–73 to 112 in 1994–98.
Table 3.
Number of hospital admissions for cirrhosis of the liver, number of deaths, percentage case fatality rates (CFRs), and standardised mortality ratios (SMRs) at 30 days and at 30–364 days after hospital admission, 1968–98, according to age group, sex, and time period
| No of hospital admissions | 30 day follow up | 30–364 day follow up | |||||||||
| Case fatality (%) | Standardised mortality | Case fatality (%) | Standardised mortality | ||||||||
| No of deaths | CFR | (95% CI) | SMR | (95% CI) | No of deaths | CFR | (95% CI) | SMR | (95% CI) | ||
| All admissions | 8192 | 1304 | 15.9 | (15.1, 16.8) | 92.5 | (87.6, 97.6) | 1452 | 17.7 | (16.8, 18.6) | 12.7 | (12.1, 13.4) |
| Time period* | |||||||||||
| 1968–73 | 465 | 88 | 17.4 | (13.6, 21.3) | 77.2 | (61.9, 94.2) | 82 | 16.7 | (13.0, 20.4) | 9.5 | (7.6, 11.7) |
| 1974–78 | 935 | 167 | 17.6 | (14.9, 20.3) | 91.7 | (78.3, 106) | 166 | 17.0 | (14.3, 19.6) | 12.6 | (10.8, 14.6) |
| 1979–83 | 1546 | 238 | 15.3 | (13.3, 17.2) | 80.4 | (70.5, 90.9) | 273 | 17.4 | (15.3, 19.5) | 11.2 | (9.9, 12.5) |
| 1984–88 | 1432 | 200 | 14.0 | (12.0, 16.0) | 81.9 | (70.8, 93.7) | 222 | 15.4 | (13.3, 17.4) | 11.3 | (9.9, 12.9) |
| 1989–93 | 1660 | 294 | 17.4 | (15.4, 19.4) | 104 | (92.3, 116) | 285 | 16.9 | (14.9, 18.9) | 12.5 | (11.1, 14.0) |
| 1994–98 | 2154 | 317 | 15.2 | (13.5, 16.9) | 112 | (100, 124) | 424 | 20.1 | (18.2, 22.1) | 17.4 | (15.8, 19.1) |
| Sex† | |||||||||||
| Men | 4511 | 727 | 16.1 | (14.9, 17.3) | 86.2 | (80.0, 92.6) | 855 | 19.0 | (17.7, 20.3) | 12.7 | (11.9, 13.6) |
| Women | 3679 | 577 | 15.7 | (14.4, 17.0) | 102 | (93.8, 110) | 597 | 16.2 | (14.9, 17.5) | 12.8 | (11.8, 13.8) |
| Age group (y)* | |||||||||||
| 15–35 | 504 | 21 | 4.2 | (2.4, 5.9) | 773 | (478, 1139) | 31 | 6.2 | (4.0, 8.3) | 108 | (73.0, 149) |
| 35–44 | 1073 | 87 | 8.1 | (6.4, 9.8) | 722 | (578, 882) | 96 | 8.9 | (7.2, 10.7) | 79.3 | (64.2, 95.9) |
| 45–54 | 1658 | 220 | 13.3 | (11.5, 15.0) | 422 | (368, 479) | 213 | 12.8 | (11.1, 14.6) | 43.0 | (37.5, 49.0) |
| 55–64 | 2229 | 331 | 14.9 | (13.3, 16.5) | 165 | (148, 183) | 374 | 16.8 | (15.1, 18.5) | 19.9 | (18.0, 22.0) |
| 65–74 | 1759 | 343 | 19.5 | (17.4, 21.6) | 80.5 | (72.2, 89.3) | 455 | 25.9 | (23.5, 28.2) | 12.2 | (11.1, 13.4) |
| 75+ | 951 | 299 | 31.4 | (27.9, 35.0) | 42.0 | (37.4, 46.9) | 280 | 29.4 | (26.0, 32.9) | 5.4 | (4.8, 6.1) |
*Mortality rates (CFRs and SMRs) are adjusted for age group and sex.
†Mortality rates (CFRs and SMRs) are adjusted for age group.
95% CI, 95% confidence interval.
CFRs were similar in men and women but, because the background all causes mortality rates are considerably higher in men than in women, SMR was significantly higher in women than in men. CFR increased sharply with age from 4.2% for those aged 15–34 years to 31.4% in those aged 75+ years (table 3 ▶). However, because the background all-causes mortality was considerably higher in the elderly than in the young, SMRs declined with increasing age.
At months 2–12 after admission, a further 17.7% of cases ended in death (table 3 ▶), which gave a total CFR in the year after admission of 33.6%. At months 2–12, the SMR was 12.7. There was no significant trend in CFR from 1968 to 1998, but because there was a large decline in mortality in the general population during this period of time, there was a significant increase in SMR from 9.5 in 1968–73 to 17.4 in 1994–98. CFR increased sharply with age and was significantly higher in men than in women.
During the first month after admission, age and sex adjusted case fatality rates were similar for social classes I and II (11.6%), III (12.8%), and IV and V (12.7%). At months 2–12, the CFR for social classes I and II (13.0%; 95% confidence interval (CI) 10.1–15.9) was slightly but not significantly lower than for class III (14.4%; 11.5–17.4) and for classes IV and V (16.0%; 11.7–20.3).
One year CFRs for the different aetiologies, for the period 1979–98, were as follows: alcoholic hepatitis (15.2%; 95% CI 11.8–19.2), alcoholic cirrhosis of the liver (38.3%; 34.6–42.1), other and unspecified alcoholic liver cirrhosis and disease (26.2%; 23.9–28.7), chronic hepatitis (16.8%; 13.4–20.7), biliary cirrhosis (19.3%; 15.1–24.0), other and unspecified liver cirrhosis and disease with no mention of alcohol (42.3%; 38.9–45.8), and diseases where liver cirrhosis was a secondary or subsidiary diagnosis (39.3%; 37.5–41.1).
First hospitalised admissions
The main study analysis includes, as new “index” cases, readmissions for liver cirrhosis that occurred at least one year after a previous admission for liver cirrhosis. When only the first identified admissions were considered, CFRs and trends in rates were not significantly different to those in table 3 ▶. Overall case fatality at 30 days increased very slightly from 15.9% to 16.3% and the rate at 30–364 days reduced very slightly from 17.7% to 16.6%.
For first admissions only, case fatality within 30 days during the six time periods 1968–73 through to 1994–98 were, respectively, 17.0%, 17.5%, 15.1%, 13.6%, 18.2%, and 16.6%, while those for case fatality at 30–364 days were 15.3%, 17.0%, 16.8%, 14.0%, 15.3%, and 18.9%. These are almost identical to the corresponding CFRs shown in table 3 ▶, and also show no significant increase or decline over time.
Survival analysis
Relative survival, compared with that in the Oxford regional population, at one year after admission was 0.85 for alcoholic hepatitis, 0.63 for alcoholic cirrhosis of the liver, 0.75 for other and unspecified alcoholic liver disease and cirrhosis, 0.85 for chronic hepatitis, 0.82 for biliary cirrhosis, 0.59 for other and unspecified liver disease and cirrhosis without mention of alcohol, and 0.62 for chronic liver disease and cirrhosis as a secondary or subsidiary diagnosis (fig 2 ▶).
Figure 2.
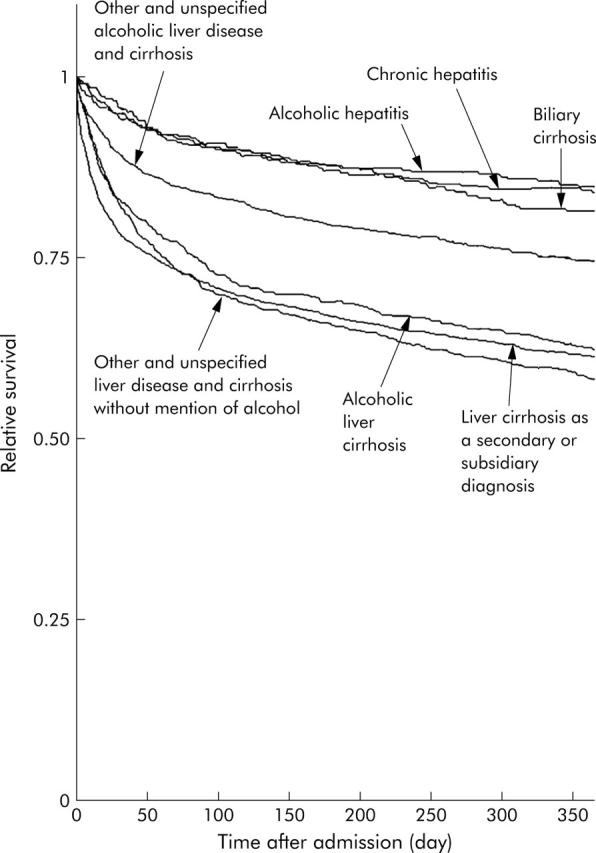
Relative survival for different aetiologies of liver cirrhosis as the principal diagnosis among those hospitalised with liver cirrhosis, 1979–98.
Survival in the first year after admission for liver cirrhosis was significantly better in women than in men (table 4 ▶). Survival also deteriorated sharply with increasing age. It has not changed significantly over time since the late 1960s and, on the basis of our limited data on social class up to the end of the 1980s, it may be worse for patients in social classes III, IV, and V than in the higher classes I and II. However, these class differences were not significant.
Table 4.
Effects of sociodemographic factors on survival up to one year after hospital admission for liver cirrhosis: odds ratios and their 95% confidence intervals derived through Cox’s proportional hazards survival models, 1968–98
| Sociodemographic factor | No of admissions | Odds ratio | (95% CI)* |
| Age group† | |||
| <35 | 504 | 1.00 | Ref |
| 35–44 | 1073 | 1.76 | (1.29, 2.39) |
| 45–54 | 1658 | 2.87 | (2.15, 3.83) |
| 55–64 | 2229 | 3.62 | (2.73, 4.79) |
| 65–74 | 1759 | 5.65 | (4.27, 7.49) |
| 75+ | 951 | 9.16 | (6.89, 12.2) |
| Sex† | |||
| Men | 4511 | 1.00 | Ref |
| Women | 3679 | 0.86 | (0.78, 0.95) |
| Time period† | |||
| 1968–73 | 465 | 1.00 | Ref |
| 1974–78 | 935 | 1.01 | (0.84, 1.22) |
| 1979–83 | 1546 | 0.89 | (0.74, 1.06) |
| 1984–88 | 1432 | 0.77 | (0.64, 0.93) |
| 1989–93 | 1660 | 0.92 | (0.76, 1.11) |
| 1994–98 | 2154 | 0.90 | (0.74, 1.09) |
| Social class† ‡ | |||
| I and II | 619 | 1.00 | Ref |
| III | 701 | 1.12 | (0.90, 1.39) |
| IV and V | 440 | 1.13 | (0.89, 1.43) |
*95% CI, 95% confidence interval; Ref, reference category.
†The prognostic effect of sex is adjusted for age group, that of age group is adjusted for sex, and those for time period and social class are adjusted for age group and sex. For the purposes of satisfying the proportional hazards assumptions of Cox’s model, time dependent covariates for sex and time period are included with, respectively, sex and time period.
‡Analyses for social class cover the period 1968–89 only.
Cause specific mortality
Of 2253 deaths within one year of admission from 1979 to 1998, liver cirrhosis was the certified underlying cause of death in 1147 (51%) of cases, with an SMR of 1577 (tables 5 ▶, 6 ▶). Mortality from all causes minus liver cirrhosis was elevated eightfold compared with the general population, and an increase of similar magnitude was found for all types of cirrhosis. For all cirrhotic patients combined, mortality was significantly increased for all ICD-9 chapters, with the exceptions of chapters XI, XV, and XVI (respectively, diseases in pregnancy and childbirth; other perinatal conditions; and symptoms, signs, and ill defined conditions). Mortality from infectious diseases and neoplasms was significantly increased for all cirrhosis subtypes except alcoholic hepatitis and biliary cirrhosis. Respiratory disease mortality was elevated in all but chronic hepatitis; circulatory disease, ischaemic heart disease, and stroke were increased for all except alcoholic hepatitis, chronic hepatitis, and biliary cirrhosis.
Table 5.
Number of deaths and cause specific standardised mortality ratios (SMRs) at one year after hospital admission for all admissions for liver cirrhoses and for alcoholic liver cirrhosis as the principal diagnosis, 1979–98
| Cause of death | ICD-9 code | All admissions for liver cirrhoses | Alcoholic liver cirrhoses as the principal diagnosis* | |||||||
| Alcoholic liver cirrhosis | Other and unspecified alcoholic liver cirrhosis and disease | |||||||||
| No of deaths | SMR | (95% CI) | No of deaths | SMR | (95% CI) | No of deaths | SMR | (95% CI) | ||
| Liver cirrhosis | 571 | 1147 | 1577 | (1488, 1670) | 173 | 2489 | (2132, 2874) | 245 | 1832 | (1608, 2069) |
| All causes except liver cirrhosis | 001–570, 572–999 | 1106 | 8.0 | (7.5, 8.5) | 83 | 8.6 | (6.9, 10.6) | 118 | 7.0 | (5.8, 8.3) |
| Other digestive diseases | 520–570, 572–579 | 177 | 49.8 | (42.7, 57.4) | 24 | 106.3 | (68.0, 153) | 22 | 54.7 | (34.2, 79.9) |
| Infectious diseases | 001–139 | 28 | 51.7 | (34.4, 72.7) | 2 | 48.0 | (4.5, 138) | 3 | 39.2 | (7.4, 96.2) |
| Neoplasms | 140–239 | 280 | 7.9 | (7.0, 8.8) | 9 | 3.2 | (1.5, 5.6) | 16 | 3.2 | (1.8, 4.9) |
| Endocrine disorders | 240–279 | 38 | 20.0 | (14.2, 26.9) | 1 | 7.8 | (0.0, 30.7) | 4 | 17.6 | (4.6, 39.1) |
| Mental disorders | 290–319 | 21 | 10.9 | (6.7, 16.0) | 2 | 21.5 | (2.0, 61.6) | 8 | 47.6 | (20.3, 86.3) |
| Diseases of the circulatory system | 390–459 | 313 | 5.4 | (4.8, 6.0) | 26 | 6.8 | (4.5, 9.7) | 30 | 4.5 | (3.0, 6.2) |
| Ischaemic heart disease | 410–414 | 120 | 4.2 | (3.5, 5.0) | 9 | 4.3 | (1.9, 7.5) | 13 | 3.5 | (1.9, 5.7) |
| Cerebrovascular disease | 430–438 | 98 | 7.2 | (5.8, 8.7) | 10 | 12.4 | (5.9, 21.4) | 7 | 5.0 | (2.0, 9.3) |
| Respiratory diseases | 460–519 | 149 | 9.0 | (7.6, 10.5) | 10 | 10.6 | (5.1, 18.2) | 24 | 14.3 | (9.2, 20.6) |
| Renal diseases | 580–629 | 20 | 12.1 | (7.4, 18.0) | 2 | 21.5 | (2.0, 61.6) | 3 | 18.3 | (3.4, 44.4) |
| Accidents† | 22 | 16.9 | (10.6, 24.7) | 2 | 18.7 | (1.8, 53.5) | 2 | 9.4 | (0.9, 26.9) | |
| Suicide† | 10 | 9.0 | (4.1, 15.8) | 3 | 20.7 | (1.9, 59.2) | 2 | 10.0 | (0.9, 28.6) | |
*A further 59 deaths occurred within one year of hospital admission for alcoholic hepatitis. The SMR for liver cirrhosis as the certified underlying cause of death was 1378 (based on 21 cases), for all causes except liver cirrhosis the SMR was 6.8 (based on 21 cases), for mental disorders the SMR was 60.9 (based on two cases), for accidents the SMR was 36.6 (based on two cases), for cerebrovascular disease the SMR was 3.9 (based on one case), for respiratory diseases the SMR was 10.9 (based on three cases), for neoplasms the SMR was 3.3 (based on three cases), for renal diseases the SMR was 66.1 (based on two cases). There were no deaths from suicide, ischaemic heart disease, or infectious diseases.
†Accidents were determined by coroners’ verdicts of “accidental death”, and suicides by verdicts of “suicide” or “open verdict”.
95% CI, 95% confidence interval.
Table 6.
Number of deaths and cause specific standardised mortality ratios (SMRs) at one year after hospital admission for non-alcoholic liver cirrhoses as the principal diagnosis and for liver cirrhosis as a secondary or subsidiary diagnosis, 1979–98
| Cause of death | ICD-9 code | Non-alcoholic liver cirrhoses as the principal diagnosis* | Liver cirrhosis as a secondary or subsidiary diagnosis | |||||||
| Chronic hepatitis | Other and unspecified liver cirrhosis and disease with no mention of alcohol | |||||||||
| No of deaths | SMR | (95% CI) | No of deaths | SMR | (95% CI) | No of deaths | SMR | (95% CI) | ||
| Liver cirrhosis | 571 | 34 | 790 | (543, 1082) | 187 | 1864 | (1607, 2141) | 428 | 1367 | (1241, 1500) |
| All causes except liver cirrhosis | 001–570, 572–999 | 37 | 4.5 | (3.2, 6.1) | 163 | 6.8 | (5.8, 7.9) | 664 | 8.0 | (7.5, 8.5) |
| Other digestive diseases | 520–570, 572–579 | 9 | 43.2 | (19.6, 76.0) | 29 | 46.2 | (30.9, 64.5) | 83 | 44.8 | (35.6, 54.9) |
| Infectious diseases | 001–139 | 2 | 62.1 | (5.9, 178) | 3 | 34.2 | (6.4, 83.7) | 18 | 69.0 | (40.8, 105) |
| Neoplasms | 140–239 | 13 | 6.1 | (3.2, 9.9) | 56 | 9.6 | (7.2, 12.2) | 179 | 10.6 | (9.1, 12.2) |
| Endocrine disorders | 240–279 | 2 | 17.7 | (1.7, 50.6) | 13 | 39.2 | (20.8, 63.3) | 16 | 16.6 | (9.5, 25.7) |
| Mental disorders | 290–319 | 0 | 1 | 2.8 | (0.0, 10.9) | 8 | 7.3 | (3.1, 13.2) | ||
| Diseases of the circulatory system | 390–459 | 5 | 1.5 | (0.5, 3.0) | 38 | 3.7 | (2.6, 5.0) | 209 | 7.0 | (6.1, 8.0) |
| Ischaemic heart disease | 410–414 | 1 | 0.6 | (0.0, 2.3) | 11 | 2.2 | (1.1, 3.7) | 84 | 6.0 | (4.7, 7.3) |
| Cerebrovascular disease | 430–438 | 3 | 3.8 | (0.7, 9.3) | 7 | 2.9 | (1.1, 5.4) | 68 | 9.4 | (7.3, 11.8) |
| Respiratory diseases | 460–519 | 3 | 3.1 | (0.6, 7.6) | 17 | 5.6 | (3.2, 8.5) | 88 | 9.8 | (7.8, 11.9) |
| Renal diseases | 580–629 | 2 | 20.8 | (2.0, 59.5) | 2 | 6.6 | (0.6, 19.0) | 9 | 10.1 | (4.6, 17.7) |
| Accidents† | 0 | 0 | 16 | 26.8 | (15.3, 41.5) | |||||
| Suicide† | 0 | 0 | 5 | 12.0 | (3.8, 24.9) | |||||
*A further 62 deaths occurred within one year of hospital admission for biliary cirrhosis. The SMR for liver cirrhosis as the certified underlying cause of death was 1049 (based on 42 cases), for all causes except liver cirrhosis the SMR was 3.0 (based on 20 cases), for ischaemic heart disease the SMR was 1.3 (based on 2 cases), for cerebrovascular disease the SMR was 3.3 (based on two cases), for respiratory diseases the SMR was 5.9 (based on four cases), for neoplasms the SMR was 2.1 (based on four cases). There were no deaths from mental disorders, accidents, suicide, infectious diseases, or renal diseases.
†Accidents were determined by coroners’ verdicts of “accidental death”, and suicides by verdicts of “suicide” or “open verdict”.
95% CI, 95% confidence interval.
The increase in mortality from respiratory disease, ischaemic heart disease, stroke, and renal disease was greater among patients with alcohol related aetiologies than in those with non-alcoholic subtypes (tables 5 ▶, 6 ▶). SMRs for accidents, suicides, and mental disorders were also increased, particularly for patients with alcoholic categories of cirrhosis or where cirrhosis was secondary to another disease, but not for patients with non-alcoholic types of cirrhosis.
DISCUSSION
Liver cirrhosis is a disease with a very high mortality in the year following hospital admission. The main strengths of the study were that it was conducted on a large geographically defined population, it covered more than 8000 people who were admitted to hospital with liver cirrhosis, it was based on systematic follow up through routine linkage to death certificate data, and it showed long term time trends in mortality after hospital admission. Its main limitations were a lack of clinical details and information on treatment, whether any liver transplant operations were undertaken on the study population outside the region’s NHS hospitals, a lack of information on alcohol consumption and other lifestyle risk factors that may have affected prognosis in the year after admission, and lack of information about timing of onset of chronic illness. The measures of prognosis reported here are those from the index admission and we recognise that these admissions may occur late in the natural history of the disease. However, even in studies conducted on an ambulatory population, establishment of the time of onset of illness, and therefore of prognosis over the full period from inception, would be difficult to define.
We found no appreciable decline in case fatality between 1968 and 1998 and, taking into account the declining mortality in the background population, an increase in SMR over time. The lack of improvement in prognosis was not related to a change in the population covered over time—addition of two further health districts to the Oxford record linkage study region in 1987—because mortality rates in these two districts were almost identical to those in the other six. However, we are unable to determine reliably from routine hospital data whether there have been genuine increases in comorbidity and severity of liver disease (manifesting, for example, in severe complications such as ascites and haemorrhaging oesophageal varices). Therefore, it is possible that the lack of reduction in mortality over time may be at least in part because of increases in case severity and comorbidity. None the less, our findings are consistent with an earlier study in West Birmingham that reported no improvement in relative survival for any chronic liver disease and cirrhosis categories from 1959 to 1976.6 The fact that mortality rates were substantially elevated for almost all major causes of death illustrates the diversity of adverse effects of liver cirrhosis, and of alcohol as its main underlying cause, on other vital organs and the immune system.
Our overall SMR at one year of 16.3 is lower than the value of 32.3 reported from a similar Danish study for the period 1983–92.21 Our CFRs at one year of 38.3% for alcoholic cirrhosis of the liver and 16.8% for chronic hepatitis are very similar to corresponding values of 39% and 17%, respectively, from the smaller but more detailed study of West Birmingham from 1959 to 1976.6
Mortality varied significantly according to the subtype of liver cirrhosis, with highest mortality for alcoholic liver cirrhosis, other and unspecified alcoholic liver cirrhosis and disease, or where cirrhosis was secondary to another disease, and much lower mortality for biliary cirrhosis and chronic hepatitis. These differentials are most likely to be due not only to differences in clinical course but also to lifestyle risk factors associated with the different types of cirrhosis. Mortality from accidents, suicides, and mental disorders was elevated for alcoholic cirrhoses, but not for any of the non-alcoholic aetiologies. Mortality from respiratory disease, ischaemic heart disease, stroke, and renal disease was also much higher among patients with alcoholic cirrhoses than in those with the non-alcoholic subtypes. Although we have no information on patients’ lifestyle factors, these findings on the profile of causes of death indicate that at least some of the excess mortality in patients with alcoholic cirrhosis was probably attributable to factors such as psychiatric morbidity, poor diet, smoking, and other lifestyle factors in addition to alcohol consumption.
Reductions in population based mortality rates from cirrhosis in most other Western countries during recent decades have been mainly attributed to a decline in per capita alcohol consumption, as well as to improved targeting and treatment of alcoholism.7,8,13,15,22,23 Our study shows little fall over time in post-admission mortality among those whose disease is serious enough to warrant hospitalisation. The lack of decline reflects the fact that there has been little recent effective innovation in treatment, and none that is widely available to patients, particularly for those with decompensated liver disease. The extremely high mortality after admission, and the fact that it has not fallen in recent years, further highlights the importance of primary preventative measures to reduce liver cirrhosis.
Acknowledgments
The Oxford record linkage database was funded by the former Oxford Regional Health Authority and, over many years, it was built by Leicester Gill, Glenys Bettley, and Myfanwy Griffith. Alan Watkins provided statistical advice.
The Research and Development Directorate of the Department of Health funds the Unit of Health Care Epidemiology to undertake research using the database. The views expressed in this paper are those of the authors and not necessarily those of the Department of Health.
Abbreviations
SMR, standardised mortality ratio
CFR, case fatality rate
Published online first 24 June 2005
Conflict of interest: None declared.
Ethics approval was provided by the Central and South Bristol Multi-Centre Research Ethics Committee (04/Q2006/176).
REFERENCES
- 1.Vass A. Rates of liver cirrhosis rise in England, fall in Europe. BMJ 2001;323:1388. [DOI] [PMC free article] [PubMed] [Google Scholar]
- 2.Department of Health. The Annual Report of the Chief Medical Officer of the Department of Health 2001. London: The Stationary Office, 2001.
- 3.Johnson CD, Hosking S. National statistics for diet, alcohol consumption, and chronic pancreatitis in England and Wales, 1960–88. Gut 1991;32:1401–5. [DOI] [PMC free article] [PubMed] [Google Scholar]
- 4.National Statistics. Living in Britain: results from the 2000 general household survey. London: HMSO, 2001:159.
- 5.Prime Minister’s Strategy Unit, Cabinet Office. Alcohol harm reduction strategy for England. London: Cabinet Office, 2004.
- 6.Saunders JB, Walters JR, Davies AP, et al. A 20-year prospective study of cirrhosis. BMJ (Clin Res Ed) 1981;282:263–6. [DOI] [PMC free article] [PubMed] [Google Scholar]
- 7.Mann RE, Smart RG, Anglin L. Reductions in liver cirrhosis mortality and morbidity in Canada: demographic differences and possible explanations. Alcohol Clin Exp Res 1988;12:290–7. [DOI] [PubMed] [Google Scholar]
- 8.Williams GD, Grant BF, Stinson FS, et al. Trends in alcohol-related morbidity and mortality. Public Health Rep 1988;103:592–7. [PMC free article] [PubMed] [Google Scholar]
- 9.Halliday ML, Coates RA, Rankin JG. Changing trends of cirrhosis mortality in Ontario, Canada, 1911–1986. Int J Epidemiol 1991;20:199–208. [DOI] [PubMed] [Google Scholar]
- 10.Savolainen VT, Penttila A, Karhunen PJ. Delayed increases in liver cirrhosis mortality and frequency of alcoholic liver cirrhosis following an increment and redistribution of alcohol consumption in Finland: evidence from mortality statistics and autopsy survey covering 8533 cases in 1968–1988. Alcohol Clin Exp Res 1992;16:661–4. [DOI] [PubMed] [Google Scholar]
- 11.Shim YK, Perper JA, Kuller LH. Factors associated with the decline in cirrhosis death rates among young adults in Allegheny County, Pennsylvania, 1973–1985. Am J Epidemiol 1993;138:531–43. [DOI] [PubMed] [Google Scholar]
- 12.Corrao G, Ferrari P, Zambon A, et al. Trends of liver cirrhosis mortality in Europe, 1970–1989: age-period-cohort analysis and changing alcohol consumption. Int J Epidemiol 1997;26:100–9. [DOI] [PubMed] [Google Scholar]
- 13.Ludviksdottir D, Skulason H, Jakobsson F, et al. Epidemiology of liver cirrhosis morbidity and mortality in Iceland. Eur J Gastroenterol Hepatol 1997;9:61–6. [DOI] [PubMed] [Google Scholar]
- 14.Adang RP, Wensing JW, Stockbrugger RW. Alcohol consumption and alcohol-related liver disease in The Netherlands. Scand J Gastroenterol Suppl 1998;225:70–4. [DOI] [PubMed] [Google Scholar]
- 15.Smart RG, Mann RE, Suurvali H. Changes in liver cirrhosis death rates in different countries in relation to per capita alcohol consumption and Alcoholics Anonymous membership. J Stud Alcohol 1998;59:245–9. [DOI] [PubMed] [Google Scholar]
- 16.Roizen R, Kerr WC, Fillmore KM. Cirrhosis mortality and per capita consumption of distilled spirits, United States, 1949–94: trend analysis. BMJ 1999;319:666–70. [DOI] [PMC free article] [PubMed] [Google Scholar]
- 17.Schlichting P, Christensen E, Fauerholdt L, et al. Main causes of death in cirrhosis. Scand J Gastroenterol 1983;18:881–8. [DOI] [PubMed] [Google Scholar]
- 18.Bouchier IA, Hislop WS, Prescott RJ. A prospective study of alcoholic liver disease and mortality. J Hepatol 1992;16:290–7. [DOI] [PubMed] [Google Scholar]
- 19.Nevens F, Broeckaert L, Rutgeerts P, et al. The long-term morbidity and mortality rate in a cohort of patients with liver cirrhosis and oesophageal varices. Hepatogastroenterology 1995;42:979–84. [PubMed] [Google Scholar]
- 20.Propst A, Propst T, Zangerl G, et al. Prognosis and life expectancy in chronic liver disease. Dig Dis Sci 1995;40:1805–15. [DOI] [PubMed] [Google Scholar]
- 21.Sorensen HT, Thulstrup AM, Mellemkjar L, et al. Long-term survival and cause-specific mortality in patients with cirrhosis of the liver: a nationwide cohort study in Denmark. J Clin Epidemiol 2003;56:88–93. [DOI] [PubMed] [Google Scholar]
- 22.Holder HD, Parker RN. Effect of alcoholism treatment on cirrhosis mortality: a 20-year multivariate time series analysis. Br J Addict 1992;87:1263–74. [DOI] [PubMed] [Google Scholar]
- 23.Ramstedt M. Per capita alcohol consumption and liver cirrhosis mortality in 14 European countries. Addiction 2001;96 (suppl 1) :S19–33. [DOI] [PubMed] [Google Scholar]