

Abstract
Background: Breakdown of tolerance against the commensal microflora is believed to be a major factor in the pathogenesis of inflammatory bowel disease (IBD). Dendritic cells (DC) have been implicated in this process in various animal models, but data on human DC in IBD are very limited.
Aim: To characterise plasmacytoid DC (PDC) and myeloid DC (MDC) in patients with active versus inactive IBD and healthy controls.
Patients and Methods: Peripheral blood was obtained from 106 patients (Crohn’s disease (CD) n = 49, ulcerative colitis (UC) n = 57) and healthy controls (n = 19). Disease activity was scored using the modified Truelove Witts (MTWSI) for UC and the Harvey Bradshaw severity indices (HBSI) for CD. Four colour flow cytometric analysis was used to identify, enumerate, and phenotype DC. DC from patients with acute flare ups and healthy controls were cultured and stimulated with CpG ODN 2006 or lipopolysaccharide (LPS).
Results: IBD patients in remission (PDC UC, 0.39%; CD, 0.35%; MDC-1 UC, 0.23%; CD, 0.22% of PBMC) have slightly lower numbers of circulating DC compared with healthy controls (PDC 0.41%, MDC-1 0.25% of PBMC). In acute flare ups IBD patients experience a significant drop of DC (PDC UC, 0.04%; CD, 0.11%; MDC-1 UC, 0.11%; CD, 0.14% of PBMC) that correlates with disease activity (correlation coefficients: PDC MTWSI, 0.93; HBSI, 0.79; MDC-1 MTWSI, 0.75; HBSI, 0.81). Moreover, both express α4β7 integrin and display an immature phenotype. Freshly isolated PDC and MDC-1 from untreated flaring IBD patients express higher baseline levels of CD86 which increases further in culture and upon stimulation compared with healthy controls.
Conclusion: IBD patients lack immature blood DC during flare ups which possibly migrate to the gut. An aberrant response to microbial surrogate stimuli suggests a disturbed interaction with commensals.
Keywords: inflammatory bowel disease, dendritic cells, antigen presentation, T cells, tolerance, CpG oligonucleotides
Dendritic cells (DC) are the longest known professional antigen presenting cells and were first described by Langerhans in 1868 at Charité in Berlin.1 They are located at mucosal interfaces with the outside world, and migrate and patrol the organism ubiquitously via the blood stream. Dendritic cells control several aspects of the immune response including type (Th1, Th2, Th3, or Tr) and homing of antigen specific effector cells. Dendritic cells are thought to be involved in maintenance of oral tolerance depending on their location, number, and maturational state.2,3
The expression of molecular pattern recognition receptors such as toll-like receptors (TLRs) on dendritic cells suggests a close interaction with microbes and microbial products, which in turn determines their influence on the respective immune response—that is, immunity versus tolerance.4,5 Several lines of evidence, particularly from animal and in vitro studies, suggest that dendritic cell function is critical for intestinal immune regulation—for example, colonic lamina propria dendritic cells display an activated phenotype; T cell proliferation in mucosal dendritic cell aggregates suggests direct involvement in T cell activation/silencing; the number of activated (CD134L positive) dendritic cells dramatically increases in mesenteric lymph nodes of a T cell transfer model of colitis and can be abrogated by CD134L antibody treatment; dendritic cells were shown to directly sample bacterial through the epithelial layer in an in vitro model; and dendritic cells from Peyer’s patches induce high levels of α4β7 integrin in T cells, thereby likely mediating gut tropism of T cells.6,7–21 Thus, dendritic cells are likely to be involved in the balance between immunity and non-responsiveness against the commensal microflora. Breakdown of oral tolerance against the commensal microflora is believed to be a key factor in the pathogenesis of inflammatory bowel disease (IBD).22–24
To date, the data on human DC in IBD are very limited. Due to their low frequency and the absence of a specific antibody it was very difficult to identify, isolate, and enrich them. Modern flow cytometry allowing staining with multiple fluorochromes simultaneously, employment of complex gating strategies, and the discovery of new dendritic cell specific antibodies such as BDCA-1 to 4 provide new tools to study this cell population.25–29
Here we present the first comprehensive analysis of all three peripheral blood DC populations known to date in patients with IBD and healthy controls.
MATERIALS AND METHODS
Patients and controls
Human peripheral blood was obtained from 106 patients with IBD (Crohn’s disease (CD) n = 49, ulcerative colitis (UC) n = 57) seen at our IBD clinic and 19 controls (total n = 125). Table 1 ▶ summarises the demographic data of patients and healthy controls. Samples were preferably analysed from patients off immunomodulators or prior to adding them to control flare ups; however some patients were receiving IBD related drugs. Figure 1 ▶ summarises the medication data. All patients gave informed consent to the study. The study protocol was approved by the institutional review board.
Table 1.
Demographic data of patients and controls
| (n) | % | Mean (SD) | Min | Max | |
| Number | 125 | 100 | |||
| Ethnicity | |||||
| White | 120 | 96 | |||
| Arabic | 5 | 4 | |||
| Crohn’s disease | 49 | 39 | |||
| Male | 12 | ||||
| Female | 37 | ||||
| Age (years) | 40 (11) | 19 | 63 | ||
| Disease duration (years) | 14 (11) | 2 | 45 | ||
| Age at diagnosis (years) | 27 (10) | 10 | 50 | ||
| Ulcerative colitis | 57 | 46 | |||
| Male | 26 | ||||
| Female | 31 | ||||
| Age (years) | 40 (16) | 21 | 74 | ||
| Disease duration (years) | 10 (6) | 2 | 28 | ||
| Age at diagnosis (years) | 33 (14) | 14 | 55 | ||
| Healthy controls | 19 | 15 | |||
| Male | 8 | ||||
| Female | 11 | ||||
| Age (years) | 37 (13) | 28 | 46 |
Figure 1.

Inflammatory bowel disease medications summary. Bars show percentages.
Scoring of disease activity
Two widely accepted scores, the modified Truelove Witts severity index (MTWSI) for UC and the Harvey Bradshaw severity index (HBSI) for CD were used to quantitate disease activity.30–32 Both scores and modifications of it have been validated in numerous clinical trials (tables 2 ▶ and 3 ▶).33,34 UC patients who scored ⩾10 on the MTWSI and CD patients who scored ⩾7 on the HBSI were classified to have active disease (flare up). The average MTWSI for flaring UC patients was 16 (range 10–21) and the average HBSI for flaring CD patients 14 (range 11–17), respectively.
Table 2.
Calculation of the modified Truelove Witts severity index (MTWSI) for ulcerative colitis
| Category | Score | |
| A | Diarrhoea | 0 = 1–2 BM/day |
| 1 = 3–4 BM/day | ||
| 2 = 5–6 BM/day | ||
| 3 = 7–9 BM/day | ||
| 4 = 10 or more BM/day | ||
| B | Nocturnal diarrhoea/ | 0 = No 1 = Yes |
| Early AM awakening for BM | ||
| C | Bloody stools | 0 = None |
| 1 = Occasionally with BM | ||
| 2 = 50% of BM | ||
| 3 = With every BM | ||
| D | Fecal incontinence/soiling | 0 = No 1 = Yes |
| E | Abdominal | 0 = None |
| pain/cramping | 1 = Mild; aware, but tolerable | |
| 2 = Moderate; interferes with usual activities | ||
| 3 = Severe; incapacitating | ||
| F | General | 0 = Excellent |
| wellbeing | 1 = Very Good | |
| 2 = Good | ||
| 3 = Fair | ||
| 4 = Poor | ||
| 5 = Terrible | ||
| G | Antidiarrhoeals/narcotics | 0 = No 1 = Yes |
| H | Abdominal | 0 = None |
| tenderness | 1 = Mild to moderate; localised | |
| 2 = Mild to moderate; diffuse | ||
| 3 = Severe or rebound tenderness |
BM, bowel movement.
Table 3.
Calculation of the Harvey Bradshaw severity index (HBSI) for Crohn’s disease
| Category | Score | |
| A | General wellbeing | 0 = Very well |
| 1 = Slightly below par | ||
| 2 = Poor | ||
| 3 = Very poor | ||
| 4 = Terrible | ||
| B | Abdominal pain | 0 = None |
| 1 = Mild | ||
| 2 = Moderate | ||
| 3 = Severe | ||
| C | Number of liquid stools per day | Number of stools |
| D | Abdominal mass | 0 = None |
| 1 = Dubious | ||
| 3 = Definite | ||
| 4 = Definite and tender | ||
| E | Complications | Score 1 for each of: |
| Arthralgia | ||
| Uveitis | ||
| Erythema nodosum | ||
| Pyoderma gangrenosum | ||
| Aphthous ulcers | ||
| Anal fissure | ||
| New fistula | ||
| Abscess |
Preparation of peripheral blood mononuclear cells
Peripheral blood mononuclear cells (PBMC) were isolated using a protocol published previously.35 Briefly, 10 ml of freshly drawn blood treated with NH4 heparin was diluted in phosphate buffered saline (PBS) 1:2 and well mixed. 20 ml of diluted blood were then carefully layered over 18 ml of Ficoll Paque (Pharmacia, Freiburg, Germany). The tubes were centrifuged without brakes at 2200 rpm for 20 minutes at 20°C. The interphase containing mononuclear cells was transferred into a new Falcon tube. Cells were washed twice in 10× their volume PBS and spun for six minutes at 1700 rpm at 4°C. The final pellet was resuspended in FACS staining buffer (PBS with 20% FCS and 1% NaN3, pH 7.4) and counted using a Neubauer chamber. Only vital cells were counted using Trypan blue exclusion. Viability was greater than 98%. 1×10⁵–1×10⁶ cells were resuspended in 100 μl FACS staining buffer prior to staining with the respective fluorochrome labelled antibodies on ice.
FACS staining
Three colour or four colour flow cytometric analysis was used to identify and enumerate different populations of peripheral blood dendritic cells (PBDC) as described previously.36 Briefly, before staining all cell preparations were first incubated with human Ig (Beriglobin, Behring, Marburg, Germany). 100 μl of each sample were pipetted in 96 V bottom well plates (Falcon, BD Biosciences, Heidelberg, Germany) and spun at 2000 rpm for two minutes at 4°C. Cells were resuspended in 50 μl FACS buffer and placed on ice. The appropriate amount of antibody was added and the cells were incubated for 30 minutes on ice in the dark. After washing them three times in FACS buffer they were analysed immediately on a FACS Calibur (BD Biosciences) flow cytometer.
Antibodies
Antibodies were obtained from commercial sources as fluorochrome and/or biotin conjugates. Streptavidin FITC, streptavidin PE, and streptavidin APC were purchased from Caltag, San Diego, CA, USA and used to detect reactivity of biotinylated primary antibodies. Light (forward and side) scatter gates were set to include all viable cells. Fluorochrome conjugated isotype matched control antibodies against mouse IgM, IgG1, and IgG2b (BD Biosciences, Heidelberg, Germany) as well as mouse IgG2a (Caltag, San Diego, CA, USA) were used to control for non-specific reactivity and anti-CD3 and anti-CD19 as fluorochrome compensation controls, respectively.
Identification of plasmacytoid dendritic cells
Plasmacytoid dendritic cells (PDC) were identified using double staining for both BDCA-2 (Miltenyi Biotec, Bergisch Gladbach, Germany) and CD123 (BD Biosciences, Heidelberg, Germany).
Identification of myeloid dendritic cells (MDC-1 and MDC-2)
As there is some cross reactivity with monocytes, granulocytes, and B cells when using the BDCA-1 and CD-11c antibodies to identify MDC-1 myeloid dendritic cells, these populations were removed from the analysis by using exclusion gates on anti-CD14 and anti-CD19 positive cells (BD Biosciences) prior to double staining with CD11c (BD Biosciences) and BDCA-1 (Miltenyi Biotech). Identification of MDC-2 required only the exclusion of granulocytes prior to staining with the respective antibody. MDC-2 were identified using BDCA-3 (Miltenyi Biotec) and HLA-DR (BD Biosciences) counterstaining. For some experiments a newly developed dendritic cell enumeration kit using BDCA-1, 2, and 3 antibodies manufactured by Miltenyi Biotec was used to assess the numbers of dendritic cells in blood. Cells were prepared according to a protocol supplied by the manufacturer. Side by side experiments demonstrated similar, reproducible results when compared with individual staining (data not shown).
Assessment of maturation and activation markers
Anti-CD1a, anti-CD40, anti-CD83, anti-CD80, and anti-CD86 as known markers of activated/mature DC were purchased from BD Biosciences. Staining was performed after gating on PDC, MDC-1, or MDC-2, respectively.
Assessment of migration markers
Anti-CD62L, anti-CD49d (α4 integrin), and anti-β7 integrin were purchased from BD Biosciences. Staining was performed after gating on PDC, MDC-1, or MDC-2, respectively.
Isolation of plasmacytoid and myeloid dendritic cells
Plasmacytoid dendritic cells (PDC) were isolated using magnetic cell separation using the BDCA-4 and myeloid dendritic cells (MDC-1) using BDCA-1 (CD1c) antibodies and microbeads (Miltenyi Biotec) from PBMC as described previously.37 As a subset of peripheral blood B cells also expresses CD1c, cells were depleted using CD19 microbeads prior to enrichment of CD1c myeloid DC. The purity of the isolated DC population was checked with FACS and samples with less than 90% PDC or MDC-1 were not used for culture and stimulation experiments.
Culture and stimulation of plasmacytoid and myeloid dendritic cells
PDC were cultured and stimulated as described previously.38–40 Briefly, 15 000 freshly isolated PDC were resuspended in 150 μl RPMI plus L-glutamine, medium with 1% penicillin/streptomycin, 1% sodium pyruvate, and 10% FCS (all from Invitrogen, Karlsruhe, Germany) and with IL-3 at 10 ng/ml (R&D Systems, Wiesbaden, Germany) (to prevent apoptosis) and incubated for 24 hours at 37°C and 5% CO2. MDC-1 were cultured in the same manner except for the IL-3 supplementation.
The sequence of the CpG B (ODN 2006) used to stimulate PDC at a concentration of 2 μg/ml in the present study was 5′-TCG TCG TTT TGT CGT TTT GTC GTT-3′. Phosphorothioate ODN 2006 was synthesised at TIB Molbiol, Berlin, Germany. MDC-1 were stimulated with 5 μg/ml lipopolysaccharide (LPS) (Sigma, Taufkirchen, Germany).
Flow cytometry
Before running the samples on a flow cytometer, propidium iodide (PI) (1:100 of a 1 mg/ml stock, Sigma, USA) was added to label dead cells. Flow cytometry was performed on a FACS Calibur (BD Biosciences) four colour flow cytometer. Data were analysed using Cell Quest (BD Biosciences) software. Advanced gating strategies were used to exclude dead (PI positive) cells and debris.
Statistical analysis
Statistical analysis including linear regression to assess correlation between dendritic cell counts, and established disease activity indices was performed using SPSS Science version 11.5 (SPSS Inc, Chicago, IL, USA) software. Curve fit was expressed as R-Square with 95% mean and individual prediction intervals. The correlation coefficient (CC) was calculated by extracting the square root from r2.
RESULTS
IBD patients in remission have slightly lower numbers of circulating PBDC (MDC < PDC) compared with healthy controls. In acute flare ups IBD patients experience a significant drop of both PDC and MDC.
The fraction of PDC in UC patients in remission was calculated to be on average 0.39% of vital PBMC and dropped to 0.04% in acute flare ups (figs 2A, B ▶, and 3A ▶). The MDC-1 fraction in UC patients in remission was calculated to be 0.23% of vital PBMC and dropped to 0.11% in acute flare ups (figs 2C, D ▶, and 4A ▶).
Figure 2.
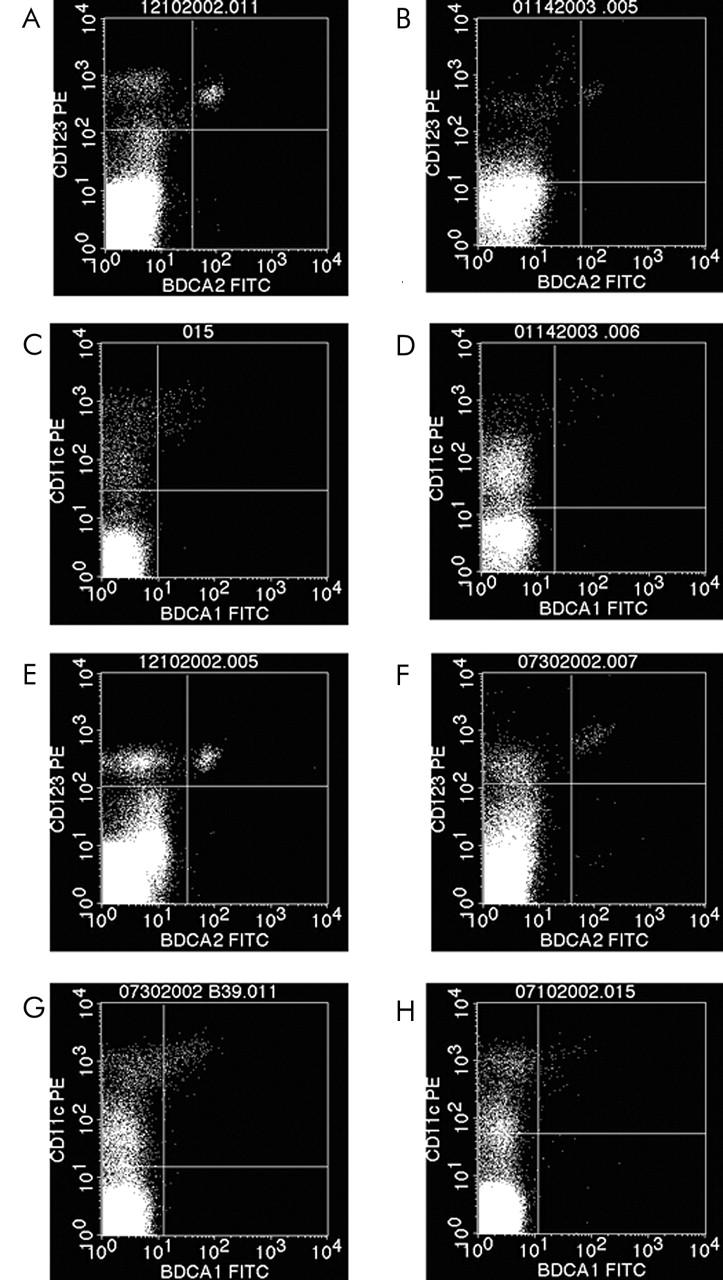
FACS plots from representative experiments illustrating the significant drop of peripheral blood dendritic plasmacytoid (PDC = PI-(vital), CD123+, BDCA-2+ cells) and myeloid dendritic (MDC-1 = PI-(vital), CD14-, CD19-, CD11c+, BDCA-1) cells in patients with active ulcerative colitis and Crohn’s disease. The same trend was seen with MDC-2 (data not shown). Ulcerative colitis PDC: (A) remission v (B) flare up: 0.66% PDC v 0.06% PDC). Ulcerative colitis MDC-1: (C) remission v (D) flare up: 0.25% MDC-1 v 0.06% MDC-1. Crohn’s disease PDC: (E) remission v (F) flare up: 0.31% PDC v 0.12% PDC. Crohn’s disease MDC-1: (G) remission v (H) flare up: 0.23% MDC-1 v 0.06% MDC-1.
Figure 3.
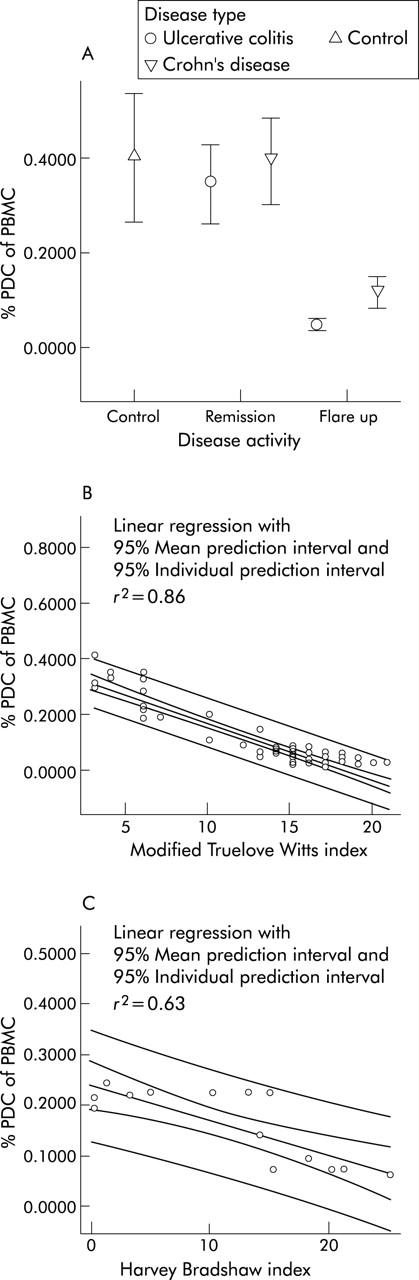
Assessment of circulating plasmacytoid dendritic cells (PDC) in IBD. (A) IBD patients in remission have slightly lower numbers of circulating peripheral blood plasmacytoid dendritic cells compared with healthy controls. In IBD flare-ups PDC drop significantly. Data is expressed as mean percentage of vital PBMC. (B) The fraction of circulating PDC correlates (CC: 0.93) with the modified Truelove Witts severity index (MTWSI) in patients with ulcerative colitis. (C) The fraction of circulating PDC shows a high correlation (CC: 0.80) with the Harvey Bradshaw severity index (HBSI) in patients with Crohn’s disease.
Figure 4.
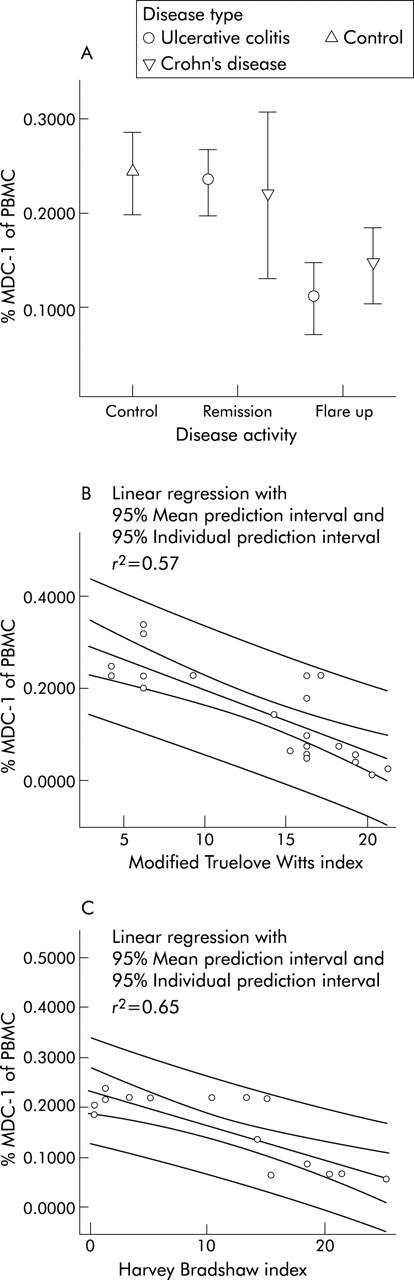
Assessment of circulating myeloid dendritic cells (MDC) in IBD. (A) IBD patients in remission have slightly lower numbers of circulating peripheral blood myeloid (MDC-1) dendritic cells compared with healthy controls. In IBD flare ups MDC drop significantly. Data are expressed as mean percentage of vital PBMC. (B) The fraction of circulating MDC correlates (CC: 0.75) with the modified Truelove Witts severity index (MTWSI) in patients with ulcerative colitis. (C) The fraction of circulating MDC shows a high correlation (CC: 0.81) with the Harvey Bradshaw severity index (HBSI) in patients with Crohn’s disease.
For CD patients in remission a mean PDC fraction of 0.35% of vital PBMC was calculated that dropped to 0.11% in acute flare ups (figs 2E ▶, 2F ▶, and 3A ▶). The mean MDC-1 fraction of CD patients in remission was calculated to be 0.22% of vital PBMC and dropped to 0.14% in acute flare ups (figs 2G, H ▶, and 4A ▶). The same trend was observed for the MDC-2 fraction (data not shown).
Healthy controls were found to have a mean PDC fraction of 0.41% and a mean MDC-1 fraction of 0.25% of vital PBMC, respectively (figs 3A ▶ and 4A ▶).
The fraction of circulating PBDC correlates with established IBD disease activity indices
A nearly perfect correlation between disease activity and the fraction of circulating PBDC was found for PDC in UC patients at linear regression analysis expressed as quality of fit (r2) and correlation coefficient (CC)—PDC and MTWSI (r2, 0.86; CC, 0.93) (fig 3B ▶). The other DC fractions were found to have a very high correlation with the respective indices as well—PDC and HBSI (r2, 0.63; CC, 0.79) (fig 3C ▶); MDC-1 and MTWSI (r2, 0.57; CC, 0.75) (fig 4B ▶); MDC-1 and HBSI (r2, 0.65; CC, 0.81) (fig 4C ▶). A similar trend was observed in MDC-2; however due to the low cell numbers no meaningful statistical analysis could be performed.
Circulating PBDC in IBD patients display an immature phenotype which does not change in active disease
Having demonstrated disease activity related changes of PDC and MDC numbers in UC and CD patients, we were interested in the phenotype of the respective cell populations to assess their maturational status. We therefore decided to look at commonly used DC maturation markers.
Virtually all PDC and MDC express MHC class II (HLA-DR) molecules. Low level expression of the co-stimulatory molecule CD86 and the PBDC marker CD62L were detected as well. Other co-stimulators, such as CD80 migration and CD40 and activation markers such as CD83 and CD1a were essentially not expressed at all. Maturational state of PDC and MDC-1 does not change in acute flare ups of IBD—that is, the percentage of activation marker positive cells is not increased (fig 5 ▶). No difference between UC and CD was detected. The phenotype of MDC-2 was similar to MDC-1 (data not shown). Taken together, these data suggest that patients with IBD lack immature dendritic cells during acute flare ups.
Figure 5.
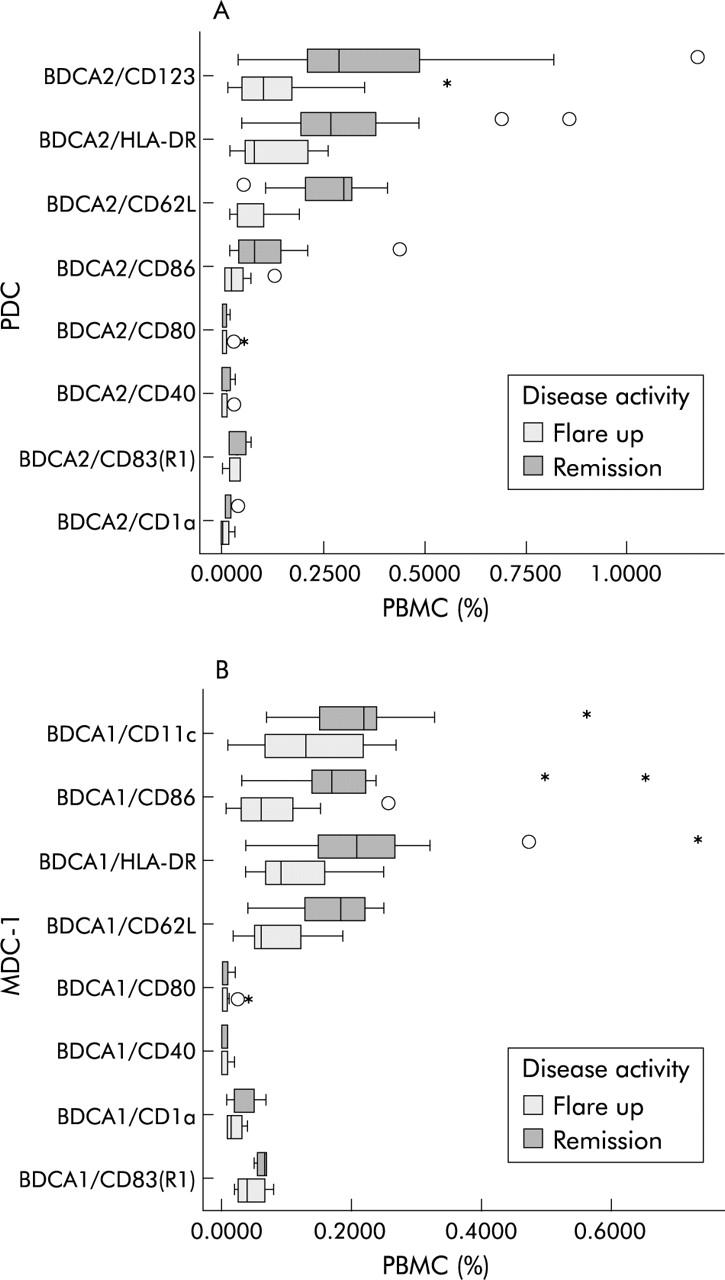
FACS analysis of maturation markers on PDC and MDC in heparinised whole blood. (Stars and asterisks denote extremes and outliers, respectively.) (A) PDC and (B) MDC-1 display an immature phenotype that does not change in acute flare ups.
PBDC express gut homing marker
The observed decrease of all three blood dendritic cell types in active IBD suggests a migration to secondary lymphatic organs. As the gut is an obvious site for such a migratory process in IBD patients, we assessed the expression of a well accepted gut homing marker—α4β7 integrin—which has been associated with intestinal homing of other immune cell populations.41,42
PDC, MDC-1, and MDC-2 express α4β7 integrin. The strongest expression was seen in myeloid DC (fig 6 ▶). This correlates with preliminary data from our group on intestinal DC, where a rise of the myeloid subpopulations in active IBD was seen (DCB, unpublished data) and the work from other groups.43 No difference between active and inactive UC and CD was detected (data not shown).
Figure 6.
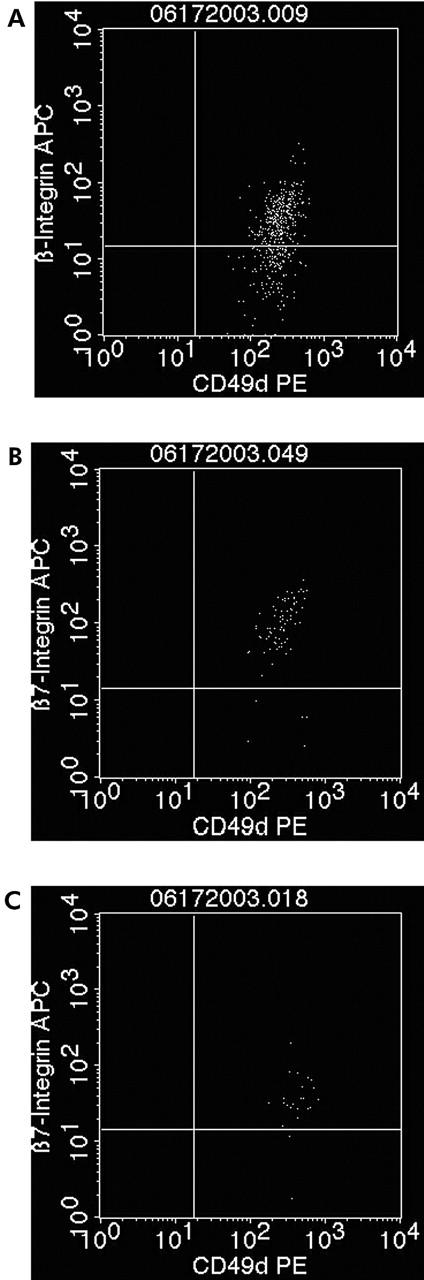
PDC, MDC-1, and MDC-2 express the gut homing marker α4β7 integrin. Example of a patient with Crohn’s disease (expression in ulcerative colitis is similar (data not shown)). (A) 93.6% of all vital MDC-1 are double positive for α4β7 integrin. (B) 67.1% of all vital PDCs are double positive for α4β7 integrin. (C) 98.2% of all vital MDC-2 are double positive for α4β7 integrin.
Upon culture, the mean CD86 expression went up in DC from both healthy controls and untreated patients with active CD and UC. However, cultured PDC and MDC-1 from flaring IBD patients on average had a more than twofold higher CD86 expression compared with healthy controls (fig 7 ▶, table 4 ▶).
Figure 7.
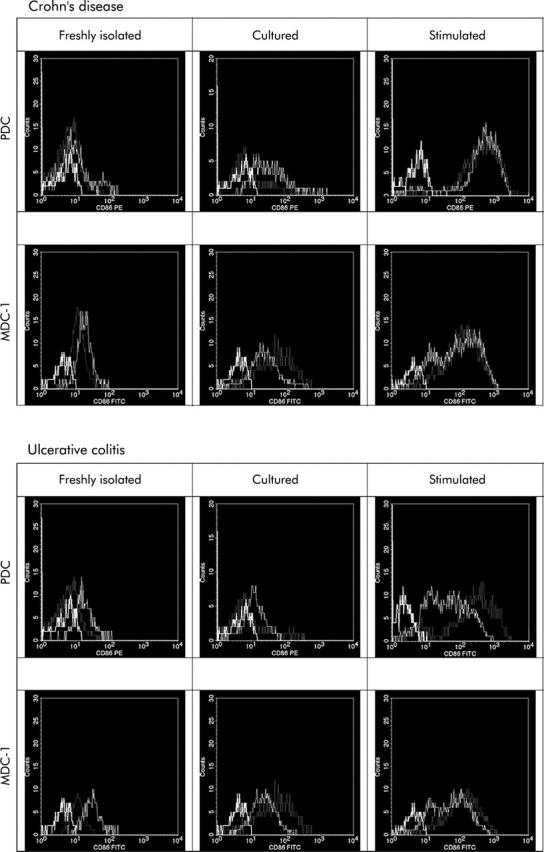
Histograms summarising the regulation of the co-stimulatory molecule CD86, a DC maturation marker, in healthy controls (dotted line), and IBD patient PDC and MDC-1, freshly isolated, 24 hour cultured, or stimulated (dotted line) as well as isotype matched controls (bold line). Plots are representative for five independent experiments. Cultured PDC and MDC-1 from untreated IBD patients with acute flare ups express higher levels of the co-stimulatory molecule CD86 compared with healthy controls. CD86 is upregulated faster and to a higher level upon stimulation with microbial surrogate stimuli such as CpG ODN 2006 or LPS, respectively.
Table 4.
Expression of the maturation marker CD86
| Disease type | DC population | CD86 Expression | ||
| Freshly isolated (% of PBMC) | Cultured (% of PBMC) | Stimulated (% of PBMC) | ||
| Healthy | PDC | 8.0 | 27.1 | 93.2 |
| controls | MDC-1 | 71.1 | 77.4 | 85.3 |
| Crohn’s | PDC | 15.6 | 42.7 | 99.3 |
| disease | MDC-1 | 75.7 | 92.1 | 95.7 |
| Ulcerative | PDC | 14.3 | 37.3 | 81.7 |
| colitis | MDC-1 | 67.3 | 91.1 | 90.2 |
PBDC of patients with active IBD respond differently to microbial surrogate stimuli compared with controls
As we hypothesised that PBDC migrate to the gut in patients with active IBD, we were curious to investigate their response to microbial stimuli they might encounter there. We picked two microbial surrogate stimuli, LPS (a bacterial wall compound known to act on MDC) and CpG-ODN 2006 (a bacterial DNA motif known to act uniquely on PDC). Both have been demonstrated to induce maturation, activation, and survival in DC in previous studies.40,44,45 As our phenotypic analysis of circulating PBDC identified low levels of CD86 on both PDC and MDC-1, while all other currently known maturation markers were negative, we decided to further study this co-stimulatory molecule in the following stimulation experiments.
On average, freshly isolated blood DC from healthy controls and untreated patients with active CD and UC display higher base line levels of the co-stimulatory molecule CD86 than their respective circulating counterparts analysed in whole blood (figs 5 ▶ and 7 ▶).
Of note, freshly isolated PDC from both flaring CD and UC patients had a twofold higher mean expression of CD86 compared with healthy controls (fig 7 ▶, table 4 ▶). Freshly isolated MDC-1 from both healthy controls as well as flaring IBD patients were found to have an almost tenfold higher baseline mean CD86 expression compared with PDC. Differences between healthy controls and patients with active IBD were not as striking as seen with PDC, but CD patients showed a slightly higher CD86 expression (fig 7 ▶, table 4 ▶).
Following CpG ODN 2006 or LPS stimulation of PDC or MDC-1, the mean expression of CD86 went up even higher in both healthy controls and untreated flaring IBD patients. Most interestingly though, stimulated PDC and MDC-1 from flaring CD patients reached the highest CD86 expression compared with healthy controls and flaring UC patients (fig 7 ▶, table 4 ▶).
In summary, freshly isolated PDC and MDC-1 from untreated flaring IBD patients express higher baseline levels of the co-stimulatory molecule CD86 compared with healthy controls. The expression increases further in culture and upon stimulation with microbial surrogate stimuli such as CpG ODN 2006 and LPS to an overall higher level compared with healthy controls.
DISCUSSION
Dendritic cells are thought to be involved in the maintenance of tolerance depending on their location, number, and maturational state.2,46 Despite the effectiveness of central (thymic) tolerance, self-reactive T cells can escape deletion and editing. In addition, the human body is constantly exposed to environmental antigens including food proteins and the intestinal commensal microflora. These limitations require additional mechanisms to effectively silence (auto) reactive T cells.47 It is assumed that blood DC in healthy individuals display an immature phenotype and induce T cell unresponsiveness.48,49 Little is known about circulating DC in IBD patients.
Our data demonstrate that patients with acute flare ups of Crohn’s disease and ulcerative colitis experience a significant drop in their peripheral PDC and MDC dendritic cell populations. The observed changes in the studied DC populations may not be IBD specific, but the demonstrated striking correlation with established disease activity indices underscore their importance in the disease process. Certainly, other, acute inflammatory bowel conditions such as infectious colitis or diverticulitis may share some of the observed phenomena.
Similar changes in the circulating DC population have been reported in patients with other immune disorders—for example, systemic lupus (SLE) and HIV, where the number of DC dropped peripherally and—for SLE patients—at the same time increased in skin lesions.50–52 This suggests a migration of peripheral DC to other sites, possibly to the gut in IBD patients. We provide evidence for this hypothesis by demonstrating the expression of a widely accepted gut homing marker α4β7 integrin on PBDC (fig 6 ▶). Our view is further substantiated by the work of other groups that demonstrated functional chemokine receptors required for migration on both plasmacytoid and myeloid dendritic cells.53–57
A well accepted concept for the pathogenesis of IBD is an inappropriate T cell response towards luminal antigens of microbial origin.23,24 The inappropriate inflammatory response may not occur primarily or exclusively due to T cell dysfunction, but is probably also promoted by a disturbed intestinal barrier and/or an aberrant antigen presenting cell—that is, DC function.58,59 The resulting imbalance between proinflammatory (that is, TNF-α, IFN-γ) and anti-inflammatory cytokines (that is, TGF-β, IL10), is caused by a differential activation of Th1, Th2 and Tr, Th3 cells, respectively, which is in part disease specific (Crohn’s disease, Th1; ulcerative colitis, Th2).60,61 We provide preliminary evidence for DC dysfunction by demonstrating a different regulation of the co-stimulatory molecule CD86, a well accepted DC maturation marker, in flaring IBD patients. The observed differences between PDC and MDC as well as CD and UC likely reflect the long known differences in the pathophysiology of these two disorders.
Due to their dual role as tolerogenic or activating antigen presenting cells, depending on their maturational state, DC may induce the differentiation of distinct T cell subsets in IBD patients compared with healthy individuals. In other words it is conceivable that circulating, immature DC normally maintain tolerance by inducing Th3 and Tr cells and, once migrated to the (inflamed) intestine and matured, promote inflammation by activating Th1 cells in IBD patients.
Our study provides preliminary evidence for this hypothesis by demonstrating a more vigorous response of circulating PDC and MDC towards microbial surrogate stimuli such as LPS and CpG ODN 2006. The postulated migration and aberrant activation process may subsequently induce the lack of circulating DC reported in our study. Although this response may occur in other inflammatory bowel conditions, such as infectious colitis and diverticulitis (not included in this analysis) our findings further support the hypothesis of their potential involvement in the breakdown of tolerance in IBD.
We are aware that medications may influence the phenotype of circulating DC, although a recent meta-analysis concluded that immunomodulators do not influence DC maturation.62 Certainly, it would have been ideal to study exclusively cells from patients off all drugs. It is unrealistic and unethical though to study a large cohort of untreated IBD patients when most medications are widely available and in use. However, as demonstrated in figure 1 ▶ we have preferably analysed samples from patients off immune modulators or prior to adding them to control flare ups. Several patients in remission were receiving IBD related drugs. Interestingly though, the reported drop of circulating DC occurred in the group that received the least drugs—patients with acute flare ups before therapy. The patients in remission had PDC and MDC fractions closer to those of controls, which in our opinion supports the view that the DC counts and phenotypes in our study are drug independent.
Two other groups found that PBDC from patients with UC showed significantly increased stimulatory capacities and produced significantly higher levels of nitric oxide compared with controls with infectious or ischaemic colitis. In contrast to our study, UC patients’ blood DC displayed a mature, activated phenotype in one study.63,64 However, due to the lack of specific antibodies these studies did not distinguish between PDC or MDC and the unequivocal identification of DC versus monocytes/macrophages must be questioned because of the lack of specific antibodies at that time.
In conclusion, we have demonstrated a lack of immature, possibly tolerogenic peripheral DC in patients with active IBD. Circulating DC express the gut homing marker, α4β7 integrin. Moreover, preliminary evidence suggests a different response of IBD patient DC to microbial surrogate stimuli. Taken together these data suggest a migratory process of blood DC in IBD patients to secondary lymphatic organs such as the intestine, where they potentially mature, become activated, and contribute to gut inflammation and tissue damage. Our data support the hypothesis that dendritic cells are involved in the breakdown of tolerance in IBD. Future studies will need to address functional properties of blood in DC in IBD in detail and elucidate the interaction of peripheral and intestinal subsets.
Acknowledgments
This work was supported by research grants of The Eli & Edythe L Broad Foundation, Los Angeles, CA, USA and Deutsche Forschungsgemeinschaft, Bonn, Germany as well as a Humboldt-University Bonus Research Grant to DCB. The authors thank the patients, medical, laboratory, and nursing staff of the Charité Inflammatory Bowel Disease Clinic for generously donating their blood for this study.
Abbreviations
CD, Crohn’s disease
DC, dendritic cell(s)
HBSI, Harvey Bradshaw severity index
IBD, inflammatory bowel disease
LPS, lipopolysaccharide
MDC, myeloid dendritic cells
MTWSI, modified Truelove Witts severity index
PDC, plasmacytoid dendritic cells
PBDC, peripheral blood dendritic cells
PBMC, peripheral blood mononuclear cells
PBS, phosphate buffered saline
UC, ulcerative colitis
REFERENCES
- 1.Langerhans P . Über die Nerven der menschlichen Haut. Virchows Arch Pathol Anat Physiol Klin Med 1868;44:325. [Google Scholar]
- 2.Banchereau J , Briere F, Caux C, et al. Immunobiology of dendritic cells. Annu Rev Immunol 2000;18:767–811. [DOI] [PubMed] [Google Scholar]
- 3.Banchereau J , Steinman R M. Dendritic cells and the control of immunity. Nature 1998;392:245–52. [DOI] [PubMed] [Google Scholar]
- 4.Hornung V , Rothenfusser S, Britsch S, et al. Quantitative expression of toll-like receptor 1-10 mRNA in cellular subsets of human peripheral blood mononuclear cells and sensitivity to CpG oligodeoxynucleotides. J Immunol 2002;168:4531–7. [DOI] [PubMed] [Google Scholar]
- 5.Krug A , Towarowski A, Britsch S, et al. Toll-like receptor expression reveals CpG DNA as a unique microbial stimulus for plasmacytoid dendritic cells which synergizes with CD40 ligand to induce high amounts of IL-12. Eur J Immunol 2001;31:3026–37. [DOI] [PubMed] [Google Scholar]
- 6.Stagg AJ, Kamm MA, Knight SC. Intestinal dendritic cells increase T cell expression of alpha4beta7 integrin. Eur J Immunol 2002;32:1445–54. [DOI] [PubMed] [Google Scholar]
- 7.Leithauser F , Trobonjaca Z, Moller P, et al. Clustering of colonic lamina propria CD4(+) T cells to subepithelial dendritic cell aggregates precedes the development of colitis in a murine adoptive transfer model. Lab Invest 2001;81:1339–49. [DOI] [PubMed] [Google Scholar]
- 8.Mora JR, Bono MR, Manjunath N, et al. Selective imprinting of gut-homing T cells by Peyer’s patch dendritic cells. Nature 2003;424:88–93. [DOI] [PubMed] [Google Scholar]
- 9.Iwasaki A , Kelsall BL. Mucosal immunity and inflammation. I. Mucosal dendritic cells: their specialized role in initiating T cell responses, Am J Physiol 1999;276:G1074–G1078. [DOI] [PubMed] [Google Scholar]
- 10.Singh B , Read S, Asseman C, et al. Control of intestinal inflammation by regulatory T cells. Immunol Rev 2001;182:190–200. [DOI] [PubMed] [Google Scholar]
- 11.Rescigno M , Urbano M, Valzasina B, et al. Dendritic cells express tight junction proteins and penetrate gut epithelial monolayers to sample bacteria. Nat Immunol 2001;2:361–7. [DOI] [PubMed] [Google Scholar]
- 12.Iwasaki A , Kelsall BL. Unique functions of CD11b+, CD8 alpha+, and double-negative Peyer’s patch dendritic cells. J Immunol 2001;166:4884–90. [DOI] [PubMed] [Google Scholar]
- 13.Iwasaki A , Kelsall BL. Freshly isolated Peyer’s patch, but not spleen, dendritic cells produce interleukin 10 and induce the differentiation of T helper type 2 cells. J Exp Med 1999;190:229–39. [DOI] [PMC free article] [PubMed] [Google Scholar]
- 14.Iwasaki A , Kelsall BL. Localization of distinct Peyer’s patch dendritic cell subsets and their recruitment by chemokines macrophage inflammatory protein (MIP)-3alpha, MIP-3beta, and secondary lymphoid organ chemokine. J Exp Med 2000;191:1381–94. [DOI] [PMC free article] [PubMed] [Google Scholar]
- 15.Singh B , Powrie F, Mortensen NJ. Immune therapy in inflammatory bowel disease and models of colitis. Br J Surg 2001;88:1558–69. [DOI] [PubMed] [Google Scholar]
- 16.Maraskovsky E , Brasel K, Teepe M, et al. Dramatic increase in the numbers of functionally mature dendritic cells in Flt3 ligand-treated mice: multiple dendritic cell subpopulations identified. J Exp Med 1996;184:1953–62. [DOI] [PMC free article] [PubMed] [Google Scholar]
- 17.Henri S , Vremec D, Kamath A, et al. The dendritic cell populations of mouse lymph nodes. J Immunol 2001;167:741–8. [DOI] [PubMed] [Google Scholar]
- 18.Belyakov IM, Hel Z, Kelsall B, et al. Mucosal AIDS vaccine reduces disease and viral load in gut reservoir and blood after mucosal infection of macaques. Nat Med 2001;7:1320–6. [DOI] [PubMed] [Google Scholar]
- 19.Kelsall BL, Strober W. Dendritic cells of the gastrointestinal tract. Springer Semin Immunopathol 1997;18:409–20. [DOI] [PubMed] [Google Scholar]
- 20.Malmstrom V , Shipton D, Singh B, et al. CD134L expression on dendritic cells in the mesenteric lymph nodes drives colitis in T cell-restored SCID mice. J Immunol 2001;166:6972–81. [DOI] [PubMed] [Google Scholar]
- 21.Stagg AJ, Hart AL, Knight SC, et al. The dendritic cell: its role in intestinal inflammation and relationship with gut bacteria. Gut 2003;52:1522–9. [DOI] [PMC free article] [PubMed] [Google Scholar]
- 22.Mayer L . Oral tolerance: new approaches, new problems. Clin Immunol 2000;94:1–8. [DOI] [PubMed] [Google Scholar]
- 23.Duchmann R , Kaiser I, Hermann E, et al. Tolerance exists towards resident intestinal flora but is broken in active inflammatory bowel disease (IBD) (see comments). Clin Exp Immunol 1995;102:448–55. [DOI] [PMC free article] [PubMed] [Google Scholar]
- 24.MacDonald TT. Breakdown of tolerance to the intestinal bacterial flora in inflammatory bowel disease (IBD). Clin Exp Immunol 1995;102:445–7. [DOI] [PMC free article] [PubMed] [Google Scholar]
- 25.Baumgarth N , Roederer M. A practical approach to multicolor flow cytometry for immunophenotyping. J Immunol Methods 2000;243:77–97. [DOI] [PubMed] [Google Scholar]
- 26.Steinman RM. DC-SIGN: a guide to some mysteries of dendritic cells. Cell 2000;100:491–4. [DOI] [PubMed] [Google Scholar]
- 27.Jameson B , Baribaud F, Pohlmann S, et al. Expression of DC-SIGN by dendritic cells of intestinal and genital mucosae in humans and rhesus macaques. J Virol 2002;76:1866–75. [DOI] [PMC free article] [PubMed] [Google Scholar]
- 28.Dzionek A , Fuchs A, Schmidt P, et al. BDCA-2, BDCA-3, and BDCA-4: three markers for distinct subsets of dendritic cells in human peripheral blood. J Immunol 2000;165:6037–46. [DOI] [PubMed] [Google Scholar]
- 29.Dzionek A , Sohma Y, Nagafune J, et al. BDCA-2, a novel plasmacytoid dendritic cell-specific type II C-type lectin, mediates antigen capture and is a potent inhibitor of interferon alpha/beta induction. J Exp Med 2001;194:1823–34. [DOI] [PMC free article] [PubMed] [Google Scholar]
- 30.Truelove SC, Witts LJ. Cortisone in ulcerative colitis; preliminary report on a therapeutic trial. BMJ 1954;4884:375–8. [DOI] [PMC free article] [PubMed] [Google Scholar]
- 31.Truelove SC, Witts LJ. Cortisone in ulcerative colitis; final report on a therapeutic trial. BMJ 1955;4947:1041–8. [DOI] [PMC free article] [PubMed] [Google Scholar]
- 32.Harvey RF, Bradshaw JM. A simple index of Crohn’s-disease activity. Lancet 1980;1:514. [DOI] [PubMed] [Google Scholar]
- 33.Maier K , von Gaisberg U, Kraus B. Ulcerative colitis. Activity index for the clinical and histological classification of inflammatory activity. Schweiz Med Wochenschr 1988;118:763–6. [PubMed] [Google Scholar]
- 34.Seo M , Okada M, Yao T, et al. Evaluation of disease activity in patients with moderately active ulcerative colitis: comparisons between a new activity index and Truelove and Witts’ classification. Am J Gastroenterol 1995;90:1759–63. [PubMed] [Google Scholar]
- 35.Li B , Bassiri H, Rossman MD, et al. Involvement of the Fas/Fas ligand pathway in activation-induced cell death of mycobacteria-reactive human gamma delta T cells: a mechanism for the loss of gamma delta T cells in patients with pulmonary tuberculosis. J Immunol 1998;161:1558–67. [PubMed] [Google Scholar]
- 36.Baumgart DC, Olivier WA, Reya T, et al. Mechanisms of intestinal epithelial cell injury and colitis in interleukin 2 (IL2)-deficient mice. Cell Immunol 1998;187:52–66. [DOI] [PubMed] [Google Scholar]
- 37.Dzionek A , Fuchs A, Schmidt P, et al. BDCA-2, BDCA-3, and BDCA-4: three markers for distinct subsets of dendritic cells in human peripheral blood. J Immunol 2000;165:6037–46. [DOI] [PubMed] [Google Scholar]
- 38.Krug A , Towarowski A, Britsch S, et al. Toll-like receptor expression reveals CpG DNA as a unique microbial stimulus for plasmacytoid dendritic cells which synergizes with CD40 ligand to induce high amounts of IL-12. Eur J Immunol 2001;31:3026–37. [DOI] [PubMed] [Google Scholar]
- 39.Krug A , Rothenfusser S, Hornung V, et al. Identification of CpG oligonucleotide sequences with high induction of IFN-alpha/beta in plasmacytoid dendritic cells. Eur J Immunol 2001;31:2154–63. [DOI] [PubMed] [Google Scholar]
- 40.Krieg AM. CpG motifs in bacterial DNA and their immune effects. Annu Rev Immunol 2002;20:709–60. [DOI] [PubMed] [Google Scholar]
- 41.Farstad IN, Halstensen TS, Lien B, et al. Distribution of beta 7 integrins in human intestinal mucosa and organized gut-associated lymphoid tissue. Immunology 1996;89:227–37. [DOI] [PMC free article] [PubMed] [Google Scholar]
- 42.Wagner N , Lohler J, Kunkel EJ, et al. Critical role for beta7 integrins in formation of the gut- associated lymphoid tissue. Nature 1996;382:366–70. [DOI] [PubMed] [Google Scholar]
- 43.te Velde AA, van Kooyk Y, Braat H, et al. Increased expression of DC-SIGN+IL-12+IL-18+ and CD83+IL-12-IL-18- dendritic cell populations in the colonic mucosa of patients with Crohn’s disease. Eur J Immunol 2003;33:143–51. [DOI] [PubMed] [Google Scholar]
- 44.Krug A , Rothenfusser S, Hornung V, et al. Identification of CpG oligonucleotide sequences with high induction of IFN-alpha/beta in plasmacytoid dendritic cells. Eur J Immunol 2001;31:2154–63. [DOI] [PubMed] [Google Scholar]
- 45.Krug A , Towarowski A, Britsch S, et al. Toll-like receptor expression reveals CpG DNA as a unique microbial stimulus for plasmacytoid dendritic cells which synergizes with CD40 ligand to induce high amounts of IL-12. Eur J Immunol 2001;31:3026–37. [DOI] [PubMed] [Google Scholar]
- 46.Banchereau J , Steinman RM. Dendritic cells and the control of immunity. Nature 1998;392:245–52. [DOI] [PubMed] [Google Scholar]
- 47.Steinman RM, Nussenzweig MC. Avoiding horror autotoxicus: the importance of dendritic cells in peripheral T cell tolerance. Proc Natl Acad Sci U S A 2002;99:351–8. [DOI] [PMC free article] [PubMed] [Google Scholar]
- 48.Hawiger D , Inaba K, Dorsett Y, et al. Dendritic cells induce peripheral T cell unresponsiveness under steady state conditions in vivo. J Exp Med 2001;194:769–79. [DOI] [PMC free article] [PubMed] [Google Scholar]
- 49.Steinman RM, Nussenzweig MC. Avoiding horror autotoxicus: the importance of dendritic cells in peripheral T cell tolerance. Proc Natl Acad Sci U S A 2002;99:351–8. [DOI] [PMC free article] [PubMed] [Google Scholar]
- 50.Cederblad B , Blomberg S, Vallin H, et al. Patients with systemic lupus erythematosus have reduced numbers of circulating natural interferon-alpha- producing cells. J Autoimmun 1998;11:465–70. [DOI] [PubMed] [Google Scholar]
- 51.Blanco P , Palucka AK, Gill M, et al. Induction of dendritic cell differentiation by IFN-alpha in systemic lupus erythematosus. Science 2001;294:1540–3. [DOI] [PubMed] [Google Scholar]
- 52.Chehimi J , Campbell DE, Azzoni L, et al. Persistent decreases in blood plasmacytoid dendritic cell number and function despite effective highly active antiretroviral therapy and increased blood myeloid dendritic cells in HIV-infected individuals. J Immunol 2002;168:4796–801. [DOI] [PubMed] [Google Scholar]
- 53.Liu YJ, Kanzler H, Soumelis V, et al. Dendritic cell lineage, plasticity and cross-regulation. Nat Immunol 2001;2:585–9. [DOI] [PubMed] [Google Scholar]
- 54.Liu YJ. Dendritic cell subsets and lineages, and their functions in innate and adaptive immunity. Cell 2001;106:259–62. [DOI] [PubMed] [Google Scholar]
- 55.Penna G , Vulcano M, Sozzani S, et al. Differential migration behavior and chemokine production by myeloid and plasmacytoid dendritic cells. Hum Immunol 2002;63:1164–71. [DOI] [PubMed] [Google Scholar]
- 56.Steinman R , Hoffman L, Pope M. Maturation and migration of cutaneous dendritic cells. J Invest Dermatol 1995;105 (1 Suppl) :2S–7S. [DOI] [PubMed] [Google Scholar]
- 57.Jonuleit H , Knop J, Enk AH. Cytokines and their effects on maturation, differentiation and migration of dendritic cells. Arch Dermatol Res 1996;289:1–8. [DOI] [PubMed] [Google Scholar]
- 58.Baumgart DC, Dignass AU. Intestinal barrier function. Curr Opin Clin Nutr Metab Care 2002;5:685–94. [DOI] [PubMed] [Google Scholar]
- 59.Baumgart DC, Dignass AU. Mucosal dendritic cells: reaching out for the unknown (antigen). Z Gastroenterol 2002;40:375–7. [DOI] [PubMed] [Google Scholar]
- 60.Blumberg RS, Strober W. Prospects for research in inflammatory bowel disease. JAMA 2001;285:643–7. [DOI] [PubMed] [Google Scholar]
- 61.Neurath MF, Finotto S, Glimcher LH. The role of Th1/Th2 polarization in mucosal immunity. Nat Med 2002;8:567–73. [DOI] [PubMed] [Google Scholar]
- 62.Lagaraine C , Lebranchu Y. Effects of immunosuppressive drugs on dendritic cells and tolerance induction. Transplantation 2003;75 (9 Suppl) :37S–42S. [DOI] [PubMed] [Google Scholar]
- 63.Ikeda Y , Akbar F, Matsui H, et al. Characterization of antigen-presenting dendritic cells in the peripheral blood and colonic mucosa of patients with ulcerative colitis. Eur J Gastroenterol Hepatol 2001;13:841–50. [DOI] [PubMed] [Google Scholar]
- 64.Vuckovic S , Florin TH, Khalil D, et al. CD40 and CD86 upregulation with divergent CMRF44 expression on blood dendritic cells in inflammatory bowel diseases. Am J Gastroenterol 2001;96:2946–56. [DOI] [PubMed] [Google Scholar]