

Abstract
Background and aims: The distinction between benign and malignant gastrointestinal stromal tumours (GISTs) is often unclear at the clinical and histopathology levels. GISTs are believed to arise from the stem cells of Cajal. In order to define genetic biomarkers and identify target genes related to GIST progression, we analysed and compared benign and malignant GISTs with verified follow up data using cDNA expression arrays.
Methods: Eight genes were frequently overexpressed in malignant GISTs and their overexpression was confirmed using quantitative real time reverse transcription-polymerase chain reaction. These genes included ezrin (villin 2 (VIL2)), collagen 8 alpha 1 subunit (COL8A1), G2/mitotic specific cyclin B1 (CCNB1), high mobility group protein (HMG2), TSG101 tumour susceptibility protein, CENP-F kinetochore protein, protein tyrosine kinase 2 (FAK), and protein kinase DYRK2. To test these genes in a clinical setting, we obtained diagnostic samples of 16 additional GISTs that were classified at diagnosis as benign, malignant, and uncertain malignant potential (UMP).
Results: There was remarkable gene overexpression in all malignant GISTs. Statistical analyses revealed significant correlations between overexpression of several gene pairs in malignant GISTs. We found the strongest correlations (ρ>0.70) among the significant correlations (p<0.01) between CCNB1-CENP-F (ρ = 0.87) and CCNB1-FAK (ρ = 0.73). Gene expression of the UMP GISTs suggested two different groups. Three UMP GISTs had gene expression consistent with malignant tumours and their follow up data revealed that indeed these patients had recurrences later on. On the other hand, UMP GISTs that had low gene expression levels continued free of disease for several years.
Conclusions: These results provide insight into the oncogenesis of GISTs and suggest that testing the expression profile of a number of genes may segregate GISTs into groups of different tumour behaviour.
Keywords: gene expression, gastrointestinal stromal tumour
Gastrointestinal stromal tumours (GISTs), previously uniformly classified as smooth muscle tumours, are the most common primary mesenchymal tumours of the gastrointestinal tract. GISTs represent a spectrum of tumours including benign and malignant variants that occur at all levels of the gastrointestinal tract and usually present between the sixth and eighth decades. The immunophenotypic characteristics and genetic profile of GISTs have clearly placed them as a separate tumour entity different from other mesenchymal tumours of the gastrointestinal tract.1,2 Immunohistochemically, GISTs are usually positive for CD34 and characteristically express the c-KIT oncoprotein, a transmembrane tyrosine kinase receptor for stem cell factor. c-KIT activation is a ubiquitous feature of GISTs and its mutations translate into constitutive activation of the KIT kinase.1,3–5 The tyrosine kinase inhibitor imatinib mesylate (STI571) is an orally administered selective inhibitor of certain tyrosine kinases, including c-KIT, that has revolutionised the treatment of GISTs.6,7 Clinically and pathologically, the prediction of biological potential is difficult, as larger tumours with lower mitotic activity may also occasionally metastasise. Accordingly, prognostic evaluation of GISTs remained a difficult issue requiring a complex multi-parametric approach with uncertainty for the clinical outcome.4 Accordingly, the prognostic evaluation of GISTs has remained a difficult issue requiring a complex multi-parametric approach.2,3
GISTs are believed to arise from stem cells of Cajal.8 Therefore, it becomes unfeasible to compare malignant tumours to the true normal cell population in experiments that require significant amounts of mRNA, such as gene expression arrays. In this study, we have developed our analyses based on comparing malignant tumours to benign tumours in cases with verified follow up in order to identify distinct genes that may be related to the malignant behaviour of GISTs.
MATERIALS AND METHODS
Tumours
Twenty five GISTs were included in the study. All tumours were immunohistochemically verified as c-KIT-positive, and histologically were in the spectrum of GIST.3 GISTs were divided into three groups by expected biological potential.4 At diagnosis, eight tumours were classified as benign based on the mitotic rate not exceeding 5 mitoses per 50 high power field (HPF), and tumour size not exceeding 5 cm (gastric location) or 2 cm (intestinal location). Six tumours were classified as having uncertain malignant potential (UMP) based on tumour size more than 5 cm but not greater than 10 cm (gastric) or more than 2 cm but not greater than 5 cm (intestine). Eleven tumours were classified as malignant based on mitotic activity of more than 5 per 50 HPF or size greater than 10 cm (stomach) or 5 cm (intestine). Details and clinical follow up data are shown in table 1 ▶.
Table 1.
Histopathological and clinical data of 25 gastrointestinal stromal tumours (GISTs)
| Sample | Diagnosis* | Histology† | Follow up‡ | Survival (months) | Sex/age (y) | Site | Size (cm) | Mitosis/50 HPF |
| GIST 1 | Bn | Sp | ANED | 53 | M/63 | Stomach | 3.5 | 1 |
| GIST 2 | Bn | Ep | ANED | 50 | M/40 | Stomach | 3.3 | 1 |
| GIST 3 | Bn | Ep | ANED | 57 | M/45 | Stomach | 4.5 | 2 |
| GIST 4 | Mg | Sp | AWD, met | 75 | F/47 | Stomach | 6 | 30 |
| GIST 5 | Mg | Sp | NA | NA | M/44 | Stomach | 17 | 6 |
| GIST 6 | Mg | Sp | AWD, rec | 36 | M/41 | Stomach | 18 | 30 |
| GIST 7 | Mg | Sp | ANED | 51 | M/63 | Rectum | 11 | 6 |
| GIST 8 | Mg | Sp | ANED | 48 | F/69 | Stomach | 12 | 44 |
| GIST 9 | Mg | Ep | AWD, rec | 54 | M/44 | Stomach | 17 | 17 |
| GIST 10 | UMP | Sp | ANED | 52 | M/52 | Stomach | 7 | 1 |
| GIST 11 | UMP | Ep | ANED | 52 | F/61 | Stomach | 7 | 1 |
| GIST 12 | UMP | Sp | DOD, rec | 52 | F/64 | Rectum | 10 | 0 |
| GIST 13 | UMP | Ep | ANED | 43 | M/67 | Stomach | 7.5 | 0 |
| GIST 14 | UMP | Ep | DOD, rec | 21 | M/64 | Rectum | 13 | 4 |
| GIST 15 | UMP | Sp | DOD, rec (mi>100) | 12 | M/64 | Intestine | 16.5 | 1 |
| GIST 16 | Mg | Sp | AWD, met | 78 | F/69 | Stomach | 6.5 | 12 |
| GIST 17 | Mg | Ep | DOD | 26 | M/70 | Stomach | 13 | 120 |
| GIST 18 | Mg | Sp | AWD, met | 58 | F/47 | Rectum | 5.6 | 16 |
| GIST 19 | Mg | Ep | DOD, met | 25 | F/53 | Stomach | 7.9 | 40 |
| GIST 20 | Mg | Ep | AWD, rec | 40 | M/61 | Stomach | 17 | 15 |
| GIST 21 | Bn | Sp | ANED | 84 | M/58 | Stomach | 4 | 2 |
| GIST 22 | Bn | Sp | D, sigmoid carcinoma | 14 | M/68 | Stomach | 0.5 | 0 |
| GIST 23 | Bn | Sp | D | 21 | F/85 | Stomach | 2.5 | 0 |
| GIST 24 | Bn | Sp | ANED | 34 | M/52 | Stomach | 0.7 | 0 |
| GIST 25 | Bn | Sp | D, renal failure | 1 | F/84 | Stomach | 1.8 | 0 |
*Diagnosis as per records of the primary tumours: Bn, benign; Mg, malignant; UMP, uncertain malignant potential.
†Sp, spindle; Ep, epitheloid.
‡D, died of other causes, DOD, died of disease; ANED, alive no evidence of disease; AWD, alive with disease; rec, recurrence; met, metastasis; NA, not available.
HPF, high power field.
Total RNA was extracted from diagnostic samples using Qiagen RNA maxiprep (Qiagen, GmbH, Germany) following the procedure recommended by the manufacturer. Total RNA was treated using Qiagen RNase-Free DNase set (Qiagen) to eliminate any contaminating DNA. The integrity of the RNA was verified on 1% agarose gel electrophoresis.
cDNA array hybridisation
Six malignant and three benign GISTs were included in the gene array analyses (GIST samples Nos 1–9). Expression of 1174 genes was evaluated in each sample (Atlas Human Cancer 1.2K; Clontech Laboratories Inc., Palo Alto, California, USA). Total RNA (3–4 μg) was converted to cDNA and labelled with 33PdATP using a Clontech cDNA array labelling kit. Hybridisations and washes were performed following the recommended manufacturer’s protocol with minor modifications. Hybridisation images were obtained with a phosphoimager (Bio-Imaging Analyzer, BAS-2500; Fuji, Kanagawa, Japan). Gene expression analyses were performed using Atlas image analysis software (Clontech). The data were viewed using TreeView software (Michael Eisen, Stanford University, California, USA). Each malignant tumour sample was compared with three benign tumour samples (GIST Nos 1–3) to obtain overexpression ratios. Any two compared samples were normalised using nine housekeeping genes that are printed on the array, and a normalisation coefficient that was calculated for each comparison was used to correct signal intensities. Based on our previous studies9 and the present report, analysis of any two hybridisation controls obtained from a given sample showed no differences using a ratio of 1.5 for overexpression. However, to increase the stringency of our analyses, we used a value of ⩾2.5 for overexpression. Reproducibility of the results was confirmed using three malignant samples that were hybridised twice, each in a different membrane and in a different experiment.
Quantitative real time RT-PCR
Single stranded cDNA was synthesised using AdvantageTM RT-for-PCR (Clontech). Quantitative real time reverse transcription-polymerase chain reaction (RT-PCR) was performed using iCycler (Biol-Rad, Hercules, California, USA) and threshold cycle number was determined using iCycler software version 3.0. Reactions were performed in triplicate and threshold cycle numbers were averaged. Gene specific primers for ezrin (villin 2 (VIL2)), collagen 8 alpha 1 subunit (COL8A1), G2/mitotic specific cyclin B1 (CCNB1), high mobility group protein (HMG2), TSG101 tumour susceptibility protein, CENP-F kinetochore protein, protein tyrosine kinase 2 (FAK), and protein kinase DYRK2 were designed. The primers used for RT-PCR were obtained from GeneLink (Hawthorne, New York, USA). Gene expression results were normalised to two housekeeping genes (β-actin (ACTB) and hypaxanthine phosphoribosyl-transferase I (HPRTI)). Malignant and UMP GISTs were compared with benign GISTs to obtain an overexpression fold. The overexpression fold was calculated as described previously.10 Gene overexpression was considered at ⩾5.0-fold based on our previous experience.10
Statistical methods
T tests were used to examine possible differences in mean gene expression for the nine genes. A natural log transformation of (gene expression+1) was used to stabilise variance. Bivariate correlations were used to examine the relationships between gene expression values for all possible gene pairs. Statistical tests were assessed at a significance level of α = 0.05. Pearson correlations were computed for all possible genes to identify possible correlations between genes.
RESULTS
cDNA array hybridisation
Analyses of nine GIST samples (GIST Nos 1–9) using cDNA arrays showed that the c-KIT oncogene was expressed in all GIST samples, irrespective of histopathology. Comparison of malignant GISTs with benign GISTs detected changes related to tumour progression and revealed 27 overexpressed genes in malignant GISTs compared with benign GISTs (fig 1 ▶). These genes included proliferation markers, cell cycle regulators, and several kinases. From the 27 overexpressed genes in the array analyses, we found that eight genes were overexpressed in the majority of malignant tumours (five or more) compared with benign tumours. Thus these genes are likely the most consistent with regard to tumour progression. These genes included VIL2, COL8A1, CCNB1, HMG2, TSG101 tumour susceptibility protein, CENP-F kinetochore protein, protein tyrosine kinase 2 (FAK), and protein kinase DYRK2 (table 2 ▶).
Figure 1.

Visual demonstration of expression intensities in malignant gastrointestinal stromal tumours (GIST Nos 4–9) compared with benign GISTs using Treeview software (Michael Eisen, Stanford University, California, USA). Twenty seven genes were overexpressed in one or more malignant GISTs compared with the average of benign GISTs (GIST Nos 1–3). Expression intensity correlates with the brightness of the red colour.
Table 2.
cDNA array overexpression ratio and quantitative real time RT-PCR* overexpression fold in malignant gastrointestinal stromal tumours (GISTs) compared with benign GISTs
| Gene | VIL2 | COL8 | CCNB1 | HMG2 | TSG101 | CENP-F | FAK | DYRK2 |
| GeneBank accession No | X51521 | X57527 | M25753 | X62534 | X13293 | U19769 | L13616 | Y13493 |
| Chromosomal locus | 6q25.3 | 3q12−q13.1 | 5q12 | 4q31 | 11p15 | 1q32–q41 | 8q24−qter | 12q13.13 |
| Sample | ||||||||
| GIST4 | 9.1 (2.3)) [8] | 3.4 (0.4)) [1.2] | 3.1 (0.4) [1.9] | 3.9 (1.1) [13.8] | 3.6 (1.2) [1.1] | 5.1 (1.7) [5.5] | 5.8 (0.7) [2.9] | 5.7 (0.5) [1.9] |
| GIST5 | 8.6 (3.1) [4.6] | 9.7 (0.6) [11.4] | 2.7 (0.9) [1] | 2.9 (0.9) [18.3] | 4.1 (0.5) [2.4] | 1 (0.3) [1.4] | 2.7 (0.2) [1] | 2.7 (0.4) [1.2] |
| GIST6 | 6.8 (1.4) [3.7] | 4.7 (0.8) [16] | 6.2 (1.5) [24.2] | 4.3 (1.7) [18.6] | 3.2 (1.4) [2.4] | 8.7 (2.7) [1.4] | 4.9 (1.4) [2.6] | 4.7 (0.8) [6.3] |
| GIST7 | 3.2 (1.1) [13.7] | 5.4 (1.1) [59.6] | 3.1 (1.5) [8.6] | 3.2 (0.4) [7] | 2.8 (0.6) [2.6] | 2.5 (1.9) [8.2] | 2.5 (0.6) [5.3] | 2.5 (0.5) [5.7] |
| GIST8 | 9.8 (1.3) [13.7] | 4.3 (0.9) [9.2] | 6.1 (1.8) [12.1] | 3.1 (0.4) [1.9] | 2 (0.4) [1.5] | 3.8 (1.1) [11.1] | 5.2 (1.2) [1.9] | 3.6 (0.7) [1.2] |
| GIST9 | 2.6 (0.7) [1.5] | 0.8 (0.2) [0] | 3.1 (0.8) [13.0] | 4.7 (1.3) [6.4] | 3.8 (0.6) [1.8] | 4.8 (1.2) [10.9] | 3.5 (0.7) [2.3] | 1.3 (0.8) [1.7] |
Gene expression alterations in six malignant GISTs (GIST 4–9) compared with expression of three benign GISTs (GIST 1–3) using cDNA arrays and quantitative real time reverse transcription-polymerase chain reaction (RT-PCR).
*Standard deviation for microarray overexpression fold is shown in parentheses and quantitative real time RT-PCR overexpression is shown in square parentheses.
VIL2, villin 2; COL8A1, collagen 8 alpha 1 subunit; CCNB1, G2/mitotic specific cyclin B1; HMG2, high mobility group protein; TSG101, TSG101 tumour susceptibility protein; CENP-F, CENP-F kinetochore protein; FAK, protein tyrosine kinase 2; DYRK2, protein kinase DYRK2.
Quantitative real time RT-PCR
Quantitative real time RT-PCR using gene specific primers for the eight genes (VIL2, COL8A1, CCNB1, HMG2, TSG101, CENP-F, FAK, and DYRK2) confirmed the gene expression array findings, as shown in table 2 ▶. There were few differences in real time RT-PCR expression folds compared with the expression array ratios. These differences were related to the higher sensitivity of real time RT-PCR in quantifying fold changes whereas the array approach is, at best, a ratio based semiquantitative approach.
To test these eight genes in a clinical setting, we obtained diagnostic samples of 16 additional GISTs (GIST 10–25) that were classified, at diagnosis, as benign, malignant, and UMP GISTs (table 1 ▶). On performing quantitative real time RT-PCR, using the same eight genes, we noted remarkable gene overexpression in all five malignant GISTs (fig 2 ▶). In contrast, gene expression of the six UMP GISTs suggested two different groups that corresponded to the follow up data that were later obtained (table 1 ▶).
Figure 2.
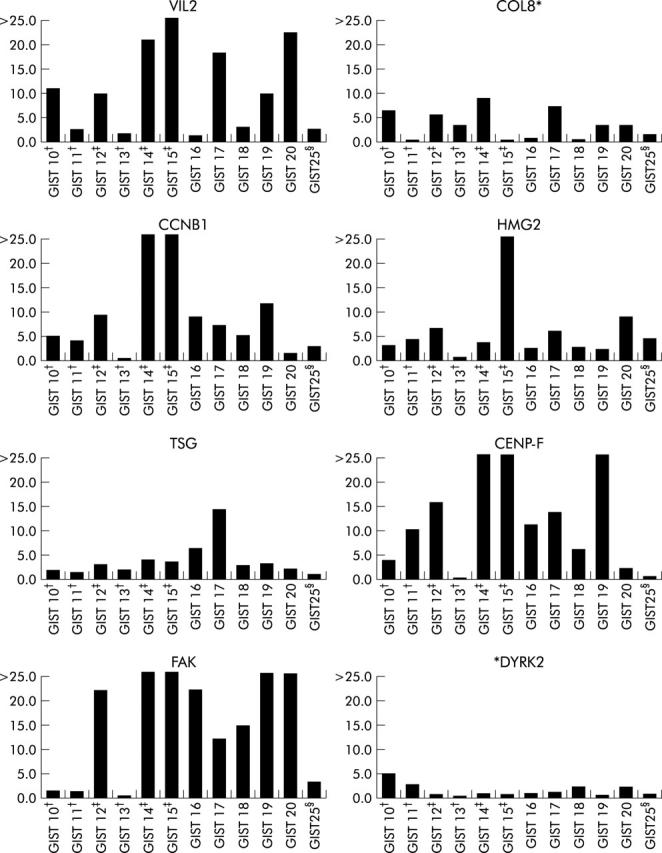
Quantitative real time reverse transcription-polymerase chain reaction (RT-PCR) analyses of eight genes (VIL2, villin 2; COL8, collagen 8 alpha 1 subunit; CCNB1, G2/mitotic specific cyclin B1; HMG2, high mobility group protein; TSG, TSG101 tumour susceptibility protein; CENP-F, CENP-F kinetochore protein; FAK, protein tyrosine kinase 2; and DYRK2, protein kinase DYRK2) in gastrointestinal stromal tumour (GIST) Nos 10–25. Malignant and uncertain malignant potential (UMP) GISTs were compared with benign GISTs (GIST Nos 21–24) to obtain overexpression folds. Gene overexpression was considered significant at a ratio of ⩾5.0. The overexpression fold was calculated as described previously.10 *COL8 and *DYRK2 were not statistically significant, as shown in table 3 ▶. Sample numbers are shown on the x axis; overexpression folds are shown on the y axis. †Primary diagnosis was UMP GIST, patients had no recurrence on follow up. ‡Primary diagnosis was UMP GIST, patients developed recurrences on follow up. §Primary diagnosis was benign, patients died after one month of renal failure.
Statistical analyses of gene expression levels in all GIST tumours (table 3 ▶) indicated that six genes were significantly overexpressed in malignant tumours: VIL2 (p<0.001), CCNB1 (p<0.001), HMG2 (p<0.001), TSG101 (p<0.02), CENP-F (p<0.001), and FAK (p<0.03). Furthermore, computing Pearson correlations revealed significant correlations between overexpression of several gene pairs in malignant GISTs. We found the strongest correlations (ρ>0.70) among the significant correlations (p<0.01) between CCNB1-CENP-F (ρ = 0.87) and CCNB1-FAK (ρ = 0.73). Further assessments of associations were not possible due to the relatively limited sample.
Table 3.
Median, and 25th and 75th percentile expression values (original scale) with p values (t test)
| Gene | Benign | Malignant | |||||
| Median | 25th | 75th | Median | 25th | 75th | p Value | |
| CCNB1 | 0.76 | 0.25 | 1.62 | 8.97 | 4.67 | 13.01 | <0.001* |
| CENP-F | 0.86 | 0.08 | 1.39 | 11.10 | 6.18 | 27.10 | <0.001* |
| COL8 | 1.21 | 0.55 | 9.17 | 3.37 | 0.07 | 9.18 | 0.75 |
| DYRK2 | 1.11 | 0.73 | 1.23 | 1.22 | 0.65 | 2.30 | 0.08 |
| FAK | 0.97 | 0.21 | 3.00 | 13.30 | 2.55 | 27.19 | 0.003* |
| HMG2 | 1.29 | 0.34 | 2.26 | 6.63 | 2.72 | 13.85 | 0.001* |
| TSG101 | 0.91 | 0.75 | 2.09 | 2.73 | 1.94 | 3.67 | 0.024* |
| VIL2 | 1.94 | 0.50 | 3.48 | 9.85 | 3.68 | 18.38 | <0.001* |
VIL2, villin 2; COL8, collagen 8 alpha 1 subunit; CCNB1, G2/mitotic specific cyclin B1; HMG2, high mobility group protein; TSG101, TSG101 tumour susceptibility protein; CENP-F, CENP-F kinetochore protein; FAK, protein tyrosine kinase 2; DYRK2, protein kinase DYRK2.
*Significant test result.
DISCUSSION
The gene expression array analyses revealed that the c-KIT oncogene was overexpressed in all GISTs, irrespective of histopathology, which is in agreement with our immunohistochemistry staining results. We developed our analyses based on comparing malignant tumours with benign tumours to detect those changes that may be related to tumour progression as it was not feasible to analyse the true normal cell of origin—“stem cells of Cajal”. In our analyses we used cases with verified long follow up data in order to minimise artefacts. We found 27 genes that were variably overexpressed in two or more malignant GISTs compared with benign GISTs. These genes included several tyrosine kinases, MAP kinases, growth factors, and cell cycle regulators (fig 1 ▶). Therefore, the known functions of these genes support their overexpression in tumours with malignant behaviour.
Eight genes were frequently overexpressed in malignant GISTs. These included VIL2, COL8A1, CCNB1, HMG2, TSG101, CENP-F, FAK, and DYRK2. Quantitative real time RT-PCR with gene specific primers and statistical analyses of gene expression levels in all GISTs (table 3 ▶) indicated that six of these genes were significantly overexpressed in malignant tumours: CCNB1 (p<0.001), CENP-F (p<0.001), FAK (p<0.03), HMG2 (p<0.001), TSG101 (p<0.02), and Ezrin (p<0.001). Thus it is most likely that these genes are related to the malignant behaviour of GISTs.
Interestingly, testing gene expression levels in 16 additional diagnostic GIST samples was in agreement with the clinical outcome after several years (fig 2 ▶). Three UMP GISTs (GIST Nos 12, 14, 15) had gene overexpression (⩾5 fold) of at least four genes, thus suggesting a true malignant potential. The follow up data of these three patients revealed that all had indeed developed recurrences or metastases (table 1 ▶). GIST 15 was diagnosed as UMP and had a mitotic index of 1 at diagnosis. This patient developed aggressive tumour recurrence at 12 months with a dramatic increase in the mitotic index up to >100. This sample showed the highest overexpression fold noted in all cases. GIST 13 had low gene expression levels and continued free of disease for 43 months. GIST 25, who was diagnosed with benign GIST and died a month later from other causes, had low gene expression levels consistent with benign behaviour. Although GISTs 10 and 11 had expression patterns suggesting malignant potential, they have continued without disease to date (table 1 ▶). It remains possible that these patients may develop recurrences on longer follow up.
Several of the aforementioned overexpressed genes are involved in signalling pathways relevant to cancer. Ezrin is an important signal transduction protein that undergoes phosphorylation and translocation on stimulation by growth factors. Ezrin is a downstream effector of trafficking PKC-integrin complexes involved in the control of cell motility. Ezrin phosphorylation and translocation are thought to be correlated with cell motility, invasion, and carcinoma metastasis.11,12 During mitosis, CENP-F kinetochore protein is associated with kinetochores from prometaphase until early anaphase13 whereas CCNB1 has a cell cycle regulation function and its cyclin kinase activity appears only at the G2 to M transition.14 CCNB1 is responsible, at least in part, for radioresistance after fractionated irradiation of tumours.15 Accordingly, overexpression of CENP-F and CCNB1 may be related to the increased mitotic activity during malignant transformation. The enzymatic properties of DYRK related kinases have the ability to catalyse tyrosine directed autophosphorylation as well as phosphorylation of serine/threonine residues in exogenous substrates that are involved in the regulation of cellular growth and/or development.16,17 Recently, TSG101 has been shown to be essential for the growth, proliferation, and survival of mammary epithelial cells.18 Overexpression of TSG101 has been shown in human papillary thyroid carcinomas and progression of cervical neoplasia.19,20 Nevertheless, FAK is a member of a growing family of non-receptor protein tyrosine kinases and is centrally implicated in the regulation of cell motility and adhesion.21 FAK is involved in tumour progression and its overexpression in subpopulations of tumour cells leads to populations of cells with a high propensity towards invasion and metastasis.22 This observation has been reported in oral, ovarian, and prostate cancer.23–25 Therefore, we have shown, in malignant GISTs, overexpression of genes that are involved in oncogenesis related multiple signal transduction pathways.
In summary, our results suggest that expression profiling of GISTs may be used as a complementary diagnostic tool for the prognostication of GISTs and for the differentiation between benign and malignant tumours. We further highlighted expression of several genes that may be related to the malignant behaviour of GISTs. Therefore, testing the expression profile of a number of genes may segregate GIST into groups of different tumour behaviour.
Acknowledgments
This study was supported by grant awards from the National Cancer Institute 1R01CA93999-01 (W El-Rifai) and by the University of Virginia Funds (W El-Rifai). The contents of this work are solely the responsibility of the authors and do not necessarily represent the official views of the NCI or the University of Virginia.
Abbreviations
GIST, gastrointestinal stromal tumour
HPF, high power field
UMP uncertain malignant potential,
RT-PCR, reverse transcription-polymerase chain reaction
VIL2, villin 2
COL8A1, collagen 8 alpha 1 subunit
CCNB1, G2/mitotic specific cyclin B1
HMG2, high mobility group protein
FAK, protein tyrosine kinase 2
REFERENCES
- 1.Sarlomo-Rikala M, El-Rifai W, Lahtinen T, et al. Different patterns of DNA copy number changes in gastrointestinal stromal tumors, leiomyomas, and schwannomas. Hum Pathol 1998;29:476–81. [DOI] [PubMed] [Google Scholar]
- 2.El-Rifai W, Sarlomo-Rikala M, Andersson LC, et al. DNA sequence copy number changes in gastrointestinal stromal tumors: tumor progression and prognostic significance. Cancer Res 2000;60:3899–903. [PubMed] [Google Scholar]
- 3.Miettinen M, Lasota J. Gastrointestinal stromal tumors—definition, clinical, histological, immunohistochemical, and molecular genetic features and differential diagnosis. Virchows Arch 2001;438:1–12. [DOI] [PubMed] [Google Scholar]
- 4.Miettinen M, El-Rifai W, Lasota J, et al. Evaluation of malignancy and prognosis of gastrointestinal stromal tumors: a review. Hum Pathol 2002;33:478–83. [DOI] [PubMed] [Google Scholar]
- 5.Rubin BP, Singer S, Tsao C, et al. KIT activation is a ubiquitous feature of gastrointestinal stromal tumors. Cancer Res 2001;61:8118–21. [PubMed] [Google Scholar]
- 6.Dematteo RP, Heinrich MC, El-Rifai WM, et al. Clinical management of gastrointestinal stromal tumors: before and after STI-571. Hum Pathol 2002;33:466–77. [DOI] [PubMed] [Google Scholar]
- 7.Joensuu H, Fletcher C, Dimitrijevic S, et al. Management of malignant gastrointestinal stromal tumours. Lancet Oncol 2002;3:655–64. [DOI] [PubMed] [Google Scholar]
- 8.Kindblom L, Remotti H, Aldenborg F, et al. Gastrointestinal pacemaker cell tumor (GIPACT). Gastrointestinal stromal tumors show phenotypic characteristics of the intestinal cell sof Cajal. Am J Pathol 1998;152:1259–69. [PMC free article] [PubMed] [Google Scholar]
- 9.El-Rifai W, Frierson HJ, Harper J, et al. Expression profiling of gastric adenocarcinoma using cDNA array. Int J Cancer 2001;92:832–8. [DOI] [PubMed] [Google Scholar]
- 10.El-Rifai W, Smith MF jr, Li G, et al. Gastric cancers overexpress DARPP-32 and a novel isoform, t-DARPP. Cancer Res 2002;62:4061–4. [PubMed] [Google Scholar]
- 11.Chen Z, Fadiel A, Feng Y, et al. Ovarian epithelial carcinoma tyrosine phosphorylation, cell proliferation, and ezrin translocation are stimulated by interleukin 1alpha and epidermal growth factor. Cancer 2001;92:3068–75. [DOI] [PubMed] [Google Scholar]
- 12.Ng T, Parsons M, Hughes WE, et al. Ezrin is a downstream effector of trafficking PKC-integrin complexes involved in the control of cell motility. Embo J 2001;20:2723–41. [DOI] [PMC free article] [PubMed] [Google Scholar]
- 13.Chan GK, Schaar BT, Yen TJ. Characterization of the kinetochore binding domain of CENP-E reveals interactions with the kinetochore proteins CENP-F and hBUBR1. J Cell Biol 1998;143:49–63. [DOI] [PMC free article] [PubMed] [Google Scholar]
- 14.Sartor H, Ehlert F, Grzeschik KH, et al. Assignment of two human cell cycle genes, CDC25C and CCNB1, to 5q31 and 5q12, respectively. Genomics 1992;13:911–12. [DOI] [PubMed] [Google Scholar]
- 15.Li Z, Li JJ. Effector genes altered in mcf-7 human breast cancer cells after exposure to fractionated ionizing radiation. Radiat Res 2001;155:543–53. [DOI] [PubMed] [Google Scholar]
- 16.Becker W, Joost HG. Structural and functional characteristics of Dyrk, a novel subfamily of protein kinases with dual specificity. Prog Nucleic Acid Res Mol Biol 1999;62:1–17. [DOI] [PubMed] [Google Scholar]
- 17.Becker W, Weber Y, Wetzel K, et al. Sequence characteristics, subcellular localization, and substrate specificity of DYRK-related kinases, a novel family of dual specificity protein kinases. J Biol Chem 1998;273:25893–902. [DOI] [PubMed] [Google Scholar]
- 18.Wagner KU, Krempler A, Qi Y, et al. Tsg101 is essential for cell growth, proliferation, and cell survival of embryonic and adult tissues. Mol Cell Biol 2003;23:150–62. [DOI] [PMC free article] [PubMed] [Google Scholar]
- 19.Liu RT, Huang CC, You HL, et al. Overexpression of tumor susceptibility gene TSG101 in human papillary thyroid carcinomas. Oncogene 2002;21:4830–7. [DOI] [PubMed] [Google Scholar]
- 20.Klaes R, Kloor M, Willeke F, et al. Significant increase of a specific variant TSG101 transcript during the progression of cervical neoplasia. Eur J Cancer 1999;35:733–7. [DOI] [PubMed] [Google Scholar]
- 21.Martens HJ, Geenen V. Focal adhesion kinases: interest in immunoendocrinology, developmental biology, and cancer. Endocrine 2000;13:233–42. [DOI] [PubMed] [Google Scholar]
- 22.Kornberg LJ. Focal adhesion kinase and its potential involvement in tumor invasion and metastasis. Head Neck 1998;20:745–52. [DOI] [PubMed] [Google Scholar]
- 23.Judson PL, He X, Cance WG, et al. Overexpression of focal adhesion kinase, a protein tyrosine kinase, in ovarian carcinoma. Cancer 1999;86:1551–6. [DOI] [PubMed] [Google Scholar]
- 24.Zheng DQ, Woodard AS, Fornaro M, et al. Prostatic carcinoma cell migration via alpha(v)beta3 integrin is modulated by a focal adhesion kinase pathway. Cancer Res 1999;59:1655–64. [PubMed] [Google Scholar]
- 25.Schneider GB, Kurago Z, Zaharias R, et al. Elevated focal adhesion kinase expression facilitates oral tumor cell invasion. Cancer 2002;95:2508–15. [DOI] [PubMed] [Google Scholar]