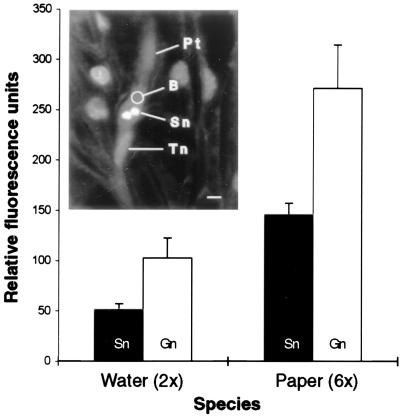
Figure 2.
DNA content of haploid nuclei. (Inset) Two sperm nuclei at late telophase of inception. A net photometric value for each section of a nucleus was determined by taking an initial reading of one sperm nucleus, and then subtracting background fluorescence of nearby cytoplasm and embedding medium (B). Relative nuclear DNA content was determined by summation of individual fluorescence values of serial sections through the nucleus, less background fluorescence. Filled columns represent sperm nuclei (Sn). Empty columns represent generative cell nuclei (Gn). Error bars represent 1 SD. Pt, pollen tube; Tn, tube nucleus. (Bar = 10 μm.)

