Abstract
We previously mapped a quantitative trait locus (QTL) affecting milk production to bovine chromosome 14. To refine the map position of this QTL, we have increased the density of the genetic map of BTA14q11–16 by addition of nine microsatellites and three single nucleotide polymorphisms. Fine-mapping of the QTL was accomplished by a two-tiered approach. In the first phase, we identified seven sires heterozygous “Qq” for the QTL by marker-assisted segregation analysis in a Holstein-Friesian pedigree comprising 1,158 individuals. In a second phase, we genotyped the seven selected sires for the newly developed high-density marker map and searched for a shared haplotype flanking an hypothetical, identical-by-descent QTL allele with large substitution effect. The seven chromosomes increasing milk fat percentage were indeed shown to carry a common chromosome segment with an estimated size of 5 cM predicted to contain the studied QTL. The same haplotype was shown to be associated with increased fat percentage in the general population as well, providing additional support in favor of the location of the QTL within the corresponding interval.
It is well established that quantitative trait loci (QTL) underlying the genetic variance of continuously distributed traits can be mapped in experimental as well as outbred populations (1, 2). However, estimators of QTL map position obtained with conventional techniques lack both accuracy and precision. Support intervals are often in the 20 to 30 cM range, and application of incorrect genetic models may lead to erroneous localizations (so-called “ghost” QTL; ref. 3). Positional candidate cloning of QTL therefore is hampered at present by the lack of suitable fine-mapping methods.
Strategies to overcome these limitations in experimental crosses recently have been evaluated by Darvasi (4). All of the described approaches share the need to generate large numbers of progeny, which may be applicable when working with experimental organisms but is impossible for humans and impractical with most domestic animal species. Rather than generating new recombination events de novo by producing more offspring, alternative fine-mapping strategies have been devised that take advantage of historical recombinants: so-called linkage disequilibrium and identity-by-descent (IBD) mapping methods (5). Such approaches have been used extensively to map genes underlying simple traits, but are only beginning to be applied to the analysis of complex phenotypes. In this paper, we report the successful application of IBD mapping principles to fine-map a QTL segregating in an outbred dairy cattle population by using a small number of carefully selected individuals.
MATERIALS AND METHODS
Pedigree Material and QTL Mapping.
QTL mapping was performed in a previously described Holstein-Friesian granddaughter design (6) comprising 1,158 sons distributed over 29 paternal half-sib families (7, 8). The phenotypes used for linkage analysis were daughter yield deviations (DYDs, corresponding to estimates of half breeding values; ref. 9) for milk yield (Kg), protein yield (Kg), fat yield (Kg), protein percentage, and fat percentage. DYDs were obtained directly from Holland Genetics (Arnhem, The Netherlands) and Livestock Improvement Corporation (Hamilton, New Zealand). Linkage analyses were performed by using a previously described multipoint sum-of-rank-based method (10) adapted for half-sib pedigrees and implemented with the hsqm software package (7). Chromosome-wide significance thresholds were determined empirically by phenotype permutation as described by Churchill and Doerge (11). Experiment-wide significance thresholds were obtained by applying a Bonferroni correction to the chromosome-wide thresholds to account for the analysis of multiple chromosomes and traits (7, 8).
Marker Development and Map Construction.
Comparative anchored tagged sequences (CATS) (12) were designed by aligning the coding sequences of human genes mapping to HSA8q23-ter (ref. 13 with supplementary data from the Whitehead Institute/Massachusetts Institute of Technology Center for Genome Research, Human Genetic Mapping Project, data release 11.9, May 1997) with their murine orthologue and targeting primers to the most conserved segments of the gene. The yeast artificial chromosome (YAC) (M.G., unpublished data) and bacterial artificial chromosome (BAC) (14) libraries were screened by PCR on DNA pools generated as described (14, 15). Microsatellites were isolated from large insert clones according to Cornelis et al. (16). To develop single nucleotide polymorphisms (SNPs) from large insert clones, random fragments were subcloned into plasmids, sequenced, and analyzed on a sample of four individuals by single-stranded conformation polymorphism. Alternate alleles from polymorphic fragments were sequenced to characterize the corresponding SNPs that were genotyped by using a PCR/oligonucleotide ligation assay (17) with electrophoretic separation of the ligation products by using an automatic ABI373 sequencer (Applied Biosystems). The map location of the developed CATS, microsatellites, and SNPs was verified by using a bovine-hamster whole-genome radiation hybrid (RH) panel (18) and the rhmap package (19). Discrimination between the rodent and bovine CATS’ amplification products was obtained by using single-stranded conformation polymorphism analysis or by designing bovine-specific primers from the sequence of the bovine PCR product. Table 1 reports the primer sequences used for the amplification of the corresponding CATS. Linkage maps were constructed by using the crimap package (20).
Table 1.
Primer sequences used for the amplification of CATS
| CYTC1 | 5′-CAC CGG GCA TGC AAA GGA C-3′ | 5′-TGG GCG CAT GAA CAT CTC C-3′ |
| KIAA0124 | 5′-AGG AGA AGA CCC AAG GCT GG-3′ | 5′-CCG TGA AGG TGC TCA AGG GG-3′ |
| E48 | 5′-TGC CAC GTG TGC ACC AGC TC-3′ | 5′-GGT CTT GCA GAA GCT GGA GC-3′ |
| FxProt | 5′-TAA GAA GAC AGC CAG TAA TGC-3′ | 5′-AGG GTG TGA ACC GGA AGT C-3′ |
| KIAA0278 | 5′-TGC AGG ACG GCC TGG AGC C-3′ | 5′-GGC GGG CGT GAG GGA CTC G-3′ |
| CYPB | 5′-GGC CAT CCA GTA GTC GTG TC-3′ | 5′-GGT TCA TCC CCA GCT CTG CC-3′ |
| SIAT4 | 5′-GCG GGG GCT TTC CGA AAG AC-3′ | 5′-TCA TCT CCC CTT GAA GAT CCG-3′ |
| SRC | 5′-TCT CCC TGA TGT ACA GTG GG-3′ | 5′-GCT AGT CCT CAA AGT ACG GT-3′ |
| TG | 5′-TCT GTC GTT CTG CCA GCT GCA GA-3′ | 5′-AGT AAT CCC CTG AAT CCT GAC ACT G-3′ |
Identification of a Shared Chromosome Segment Among Qq Heterozygous Sires.
Selection of segregating sire families was done with the hsqm package (7). Haplotyping of the individuals in the granddaughter design was performed by using purpose-built analyses programs (F.F., unpublished work). Statistical significance of the haplotype sharing observed within the pools of sire chromosomes was measured with dismult (21), by using the sire chromosomes as case and 620 randomly selected dam chromosomes as controls.
Association Study.
The effect of the BULGE14-CSSM66-BULGE17-BULGE16-BULGE15 haplotype on phenotype was evaluated by comparing the DYDs of sons sorted by maternally inherited haplotype: 4–4–1–1–2 versus non-4–4–1–1–2. DYDs were precorrected for half of the predicted transmitting abilities (corresponding to estimates of half breeding values; ref. 9) of sire and dam. Phenotypic distributions were compared between groups by using a t test.
RESULTS
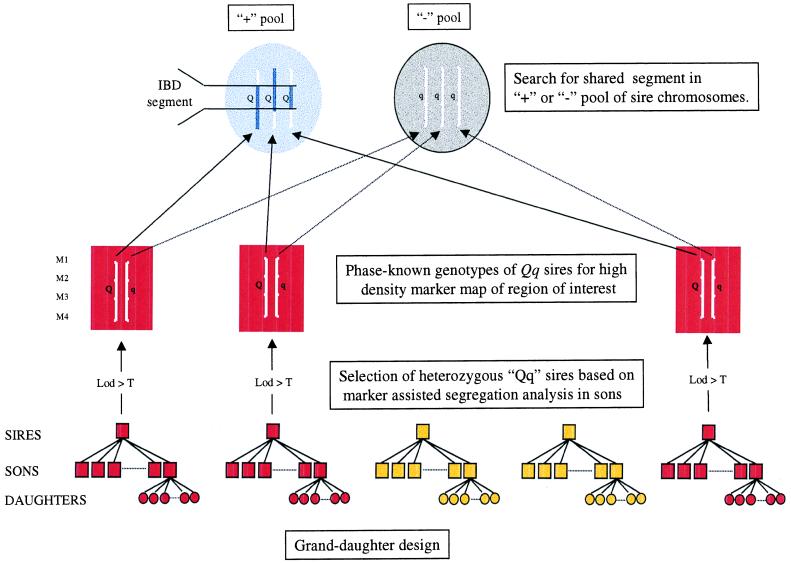
We and others recently mapped a QTL with major effect on milk yield and composition to the centromeric end of bovine chromosome 14 (8, 22). The experimental design used in both studies takes advantage of progeny testing to increase the power of QTL mapping (Fig. 1). Although the existence of this QTL was firmly established, its map position needed to be refined for optimal use in marker-assisted selection, as well as in preparation for positional cloning of the corresponding gene(s).
Figure 1.
General principles of the proposed IBD fine-mapping method for QTL. In dairy cattle, QTL typically are mapped by using the granddaughter design, i.e., a series of paternal half-brother-ships with phenotypic values corresponding to the sons’ breeding values estimated from the milking performances of their daughters. The proposed approach consists of (i) identifying heterozygous Qq sires (highlighted in red) based on marker-assisted segregation analysis in their respective sons, (ii) genotyping these sires for a high-density marker map in the region of interest and establishing the linkage phase, (iii) sorting the sire chromosomes into two pools according to the associated effect on phenotype, and (iv) identifying a shared haplotype flanking the IBD QTL allele with large substitution effect present in one of the two pools.
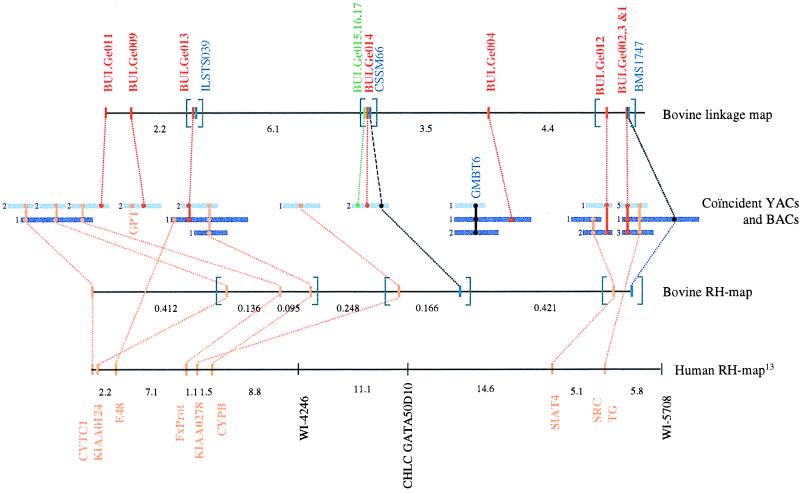
To improve the genetic map of proximal BTA14, we developed nine microsatellite markers from large insert clones (YACs and BACs) isolated with CATS (12) mapping to the orthologous region on the human map (HSA8q23.3-ter): CYTC1, KIAA0124, E48, FxProt, KIAA0278, CYPB, SIAT4, SRC, and Tg. Before screening the large insert libraries, we confirmed that the generated CATS mapped to the chromosomal segment of interest in cattle by using a hamster-bovine whole-genome RH panel. All generated CATS did indeed map to BTA14q11–16, yielding the RH map shown in Fig. 2. The entire granddaughter design was genotyped for all newly generated microsatellites as well as those available from the literature (23) and the map shown in Fig. 2 constructed by linkage analysis.
Figure 2.
Generation of a high-density marker map of BTA14q11–16. CATS were developed from genes positioned on the human RH map corresponding to HSA8q23-ter, shown in orange. The map position of the bovine orthologues was verified by using a hamster-bovine whole-genome RH panel. The corresponding bovine RH map is shown with most likely marker order and centirays between adjacent markers as estimated with rhmap. Marker sets that could not be ordered with odds >1,000 are in brackets. CATS mapping to BTA14q11–16 in cattle were used to screen a bovine YAC and BAC library. Resulting YACs are shown as dark blue bars, while BACs are shown as light blue bars. The numbers shown adjacent to the BAC and YAC clones correspond to the number of clones with identical sequence tagged site content. GMBT6, a variable number of tandem repeat known to map to BTA14q11–16 (29) also was used to screen the YAC and BAC libraries. Microsatellites and SNPs were isolated from the large insert clones as described and used to generate the illustrated linkage map. Most likely marker order and recombination rates between adjacent markers are shown. Marker sets that could not be ordered with odds >1,000 are in brackets. Newly developed microsatellites are shown in red, previously described markers in blue, and SNPs in green.
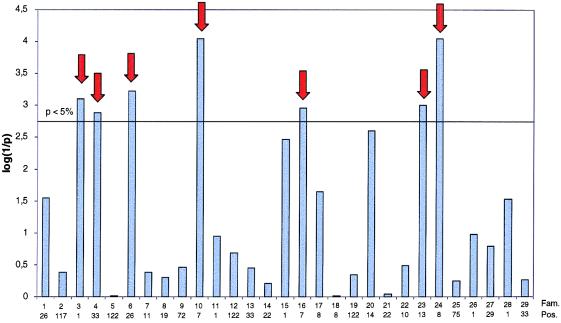
We then identified among the 29 founder sires those that were most likely to be heterozygous Qq for the identified QTL (Fig. 1). This identification was achieved by selecting the half-sib families yielding a significant phenotypic contrast between sons having inherited alternate paternal homologues for proximal BTA14. The analysis was performed by using a previously described sum-of-rank-based multipoint approach adapted to half-sib designs (7, 10). Selection was based on the analysis of fat percentage, the trait showing the most pronounced QTL effect in the joint analysis of all pedigrees (8). Seven of the 29 pedigrees yielded a contrast significant at the chromosome-wide 5% level, including a Bonferroni correction to account for the analysis of multiple pedigrees (Fig. 3).
Figure 3.
Maximal log(1/p) values (obtained by chromosome-wide phenotype permutations) for fat percentage in each of the 29 analyzed half-sib families by using a previously described rank-sum approach (7). The experiment-wide significance levels obtained by Bonferroni correction accounting for the analysis of multiple (29) families is shown as a horizontal line. Numbers underneath the bar graph correspond to family number and most likely chromosome position (cM). The selected families are indicated by the red arrows.
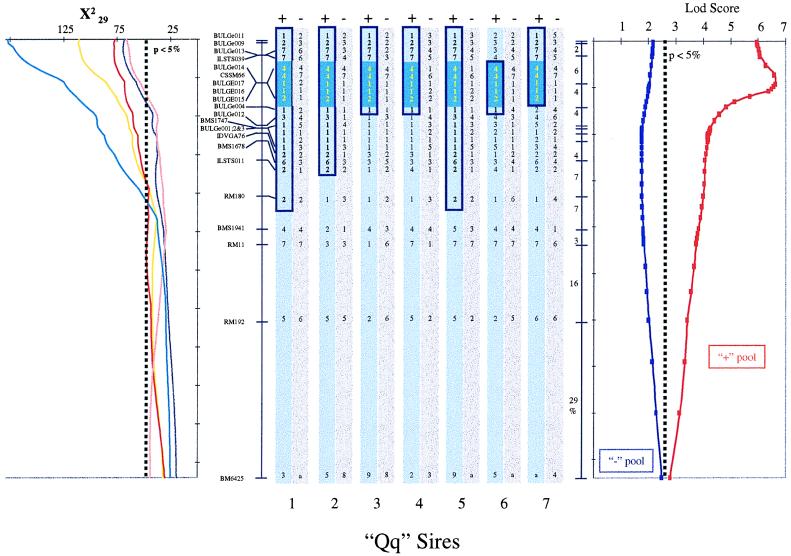
The most likely marker-marker and marker-QTL linkage phase was determined for the seven sires from the analysis of the genotypes and phenotypes of their respective sons. The resulting 14 haplotyped sire chromosomes then were sorted in two pools: one corresponding to the chromosomes increasing fat percentage (+ pool), the other causing a corresponding decrease (− pool). We reasoned that the phenotypic contrast observed among the sons of these seven sires might reflect the effect of a common, IBD QTL allele characterized by a large substitution effect. Based on this hypothesis, we predicted the occurrence of a shared chromosome segment encompassing the postulated QTL allele in one of the two chromosome pools (Fig. 1). Analysis of the + pool indeed revealed a common haplotype shared by all seven sires (Fig. 4). The significance of the observed haplotype sharing was evaluated by using the likelihood method developed by Terwilliger (21) for the multipoint analysis of linkage disequilibrium between a trait locus and linked markers. The chromosomes in the + pool were treated as case chromosomes, while a random selection of 620 haplotyped chromosomes sampled in the same population were used as controls. To account for background haplotype sharing that might exist in the studied population, chromosome-wide significance thresholds were determined empirically by permutation. Sets of seven chromosomes were randomly selected from the available collection of 620 chromosomes and treated as case, the remaining representing the controls. The distribution of the likelihood-ratio test statistic [highest logarithm of odds (lod) score obtained along the chromosome map for each permutation] was evaluated for 1,000 such permutations. By using this approach and applying a Bonferroni correction to account for the analysis of two pools, the lod score value of 6.7 obtained by using the + pool proved to be highly significant (Fig. 4), clearly indicating an association between the identified haplotype and the phenotypic segregation observed within the selected pedigrees. When analyzing the pool of − chromosomes by using the same approach the lod score did not exceed the 2.6 threshold associated with a type I error of 5%.
Figure 4.
Identification of a shared haplotype in the + pool of Qq sire chromosomes. The graph on the left shows the location scores obtained along the marker map of BTA14 for milk yield (yellow line), protein yield (red line), fat yield (purple line), protein percentage (pink line), and fat percentage (blue line) by using the hsqm analysis software (7, 8). The location scores are expressed as χ2 statistics with 29 degrees of freedom. The experiment-wide threshold associated with a type I error of 5% is shown. Order and recombination rates between microsatellite markers and SNPs composing the BTA14 linkage map are given. The vertical bars in the center illustrate the genotypes of the seven postulated Qq sires. The gray bars correspond to the chromosomes of the − pool, while the blue bars correspond to the + pool. The postulated ancestral chromosome carrying the Q QTL allele is boxed in dark blue, while the chromosome segment shared identical-by-state by all seven sires is filled dark blue. The graph on the right illustrates the results obtained with dismult (21), measuring the statistical significance of the haplotype sharing observed in the + and − chromosome pools as a lod score. The experiment-wide threshold associated with a type I error of 5% as obtained by permutation is shown.
Three additional SNPs were isolated from the BAC clone containing the CSSM66 and BULGE014 microsatellites shared identical-by-state within the + pool. Genotyping the seven sires with these markers showed these to be identical-by-state as well in the + pool, therefore adding confidence to the prediction that the shared haplotype is indeed IBD (Fig. 4).
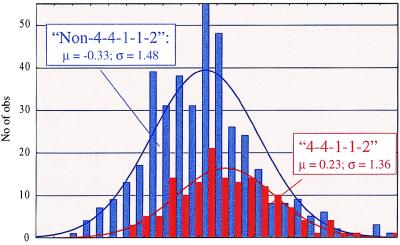
To further strengthen the evidence in favor of the location of the QTL in the identified chromosome segment, we reasoned that if a QTL allele with large substitution effect was indeed associated with the haplotype shared by the seven sires selected as described, the same association should hold within the general population as well. To verify this assumption, we genotyped and determined the most likely marker phase for proximal BTA14 for all bulls in the granddaughter design. Individuals were sorted according to the maternally inherited BULGE14-CSSM66-BULGE17-BULGE16-BULGE15 haplotype: 4–4–1–1–2 or not 4–4–1–1–2. To avoid extracting redundant information, maternal grandsons of the seven Qq founder sires were excluded from this analysis. Fig. 5 shows the effect of the maternal BULGE14-CSSM66-BULGE17-BULGE16-BULGE15 haplotype on the sons’ breeding values for fat percentage (corrected for half the sire and dam breeding values), clearly confirming a very significant effect of the 4–4–1–1–2 haplotype in the general population as well (P < 0,0002). The sign of the 4–4–1–1–2 effect in the general population, i.e., an increase in fat percentage, was in agreement with the positive substitution effect found to be associated with this haplotype in the offspring of the seven founder sires.
Figure 5.
Effect of the maternal BULGE14-CSSM66-BULGE17-BULGE16-BULGE15 haplotype on fat percentage. Mean and SD of the DYDs for fat percentage are given for each class.
DISCUSSION
The results reported in this work provide strong evidence for the location of the studied QTL within a chromosome segment of less than 9.5 cM flanked by the closest non-identical-by-state markers: ILSTS039 and BULGE004. Further marker development in that interval should refine the boundaries of the chromosome segment shared IBD by the seven founder sires. Based on the available data, the expected size of this segment is 4.5–5 cM. This resolution would facilitate positional candidate strategies for cloning the QTL. Moreover, the identification of a marker haplotype in linkage disequilibrium with a specific QTL allele in the general population allows one to exploit this association by using marker-assisted selection. Preliminary analyses suggest that marker haplotypes other than 4–4–1–1–2 have significantly different substitution effects in the general population as well (data not shown), possibly extending the scope of marker-assisted selection based on linkage disequilibrium.
The hypothesis underlying the proposed approach assumes homogeneity of QTL alleles with large substitution effects in populations with reduced effective population size. Note that because of the extensive use of artificial insemination, the effective population size of the Holstein-Friesian cattle breed has been estimated at approximately 100 despite a total population size of tens of millions of individuals for the North American continent and Western Europe only. Our approach was inspired by the frequently observed homogeneity of mutations underlying specific inherited diseases in genetically isolated populations (e.g., refs. 24–27). The prediction of allelic homogeneity proved to be correct for the seven individuals selected in this specific case. It is unknown at this point, however, how often such allelic homogeneity will occur and be readily detectable by using the available marker density, as has been the case in this study. Note that even if a shared chromosome segment could not be unambiguously identified among Qq sires as a result of allelic and/or locus heterogeneity, the effect on phenotype of the haplotypes carried by the identified Qq individuals could be tested in the general population by using a variety of tests including the transmission disequilibrium test (28), thereby contributing to fine-mapping the corresponding QTL. Analysis of microsatellite genotypes in the Holstein-Friesian population clearly demonstrates that linkage disequilibrium extends over several tens of centimorgans in these populations (F.F., unpublished work). It is therefore likely that linkage disequilibrium will be exploitable for mapping purposes in these populations by using the relatively coarse marker maps that are presently available in domestic animal species.
We believe that the proposed approach or variants thereof should be applicable to most species characterized by genetically isolated, outbred populations with relatively small effective population sizes.
Acknowledgments
Continuous support from Nanke den Daas, Jeremy Hill, Brian Wickham, Denis Volckaert, and Pascal Leroy is greatly appreciated. We thank Johan van Arendonk, Richard Spelman, Henk Bovenhuis, Marco Bink, and Dorian Garrick for fruitful discussions. This work was funded by grants from Holland Genetics, Livestock Improvement Corporation, the Vlaamse Rundvee Vereniging, the Ministère des Classes Moyennes et de l’Agriculture (Belgium), and European Union Grants B104-CT95-0073 and PL970471.
ABBREVIATIONS
- QTL
quantitative trait loci
- IBD
identity by descent
- CATS
comparative anchored tagged sequences
- YAC
yeast artificial chromosome
- BAC
bacterial artificial chromosome
- SNP
single nucleotide polymorphism
- RH
radiation hybrid
- lod
logarithm of odds
- DYD
daughter yield deviation
References
- 1.Lander E S, Schork N J. Science. 1994;265:2037–2048. doi: 10.1126/science.8091226. [DOI] [PubMed] [Google Scholar]
- 2.Paterson A H. Genome Res. 1995;5:321–333. doi: 10.1101/gr.5.4.321. [DOI] [PubMed] [Google Scholar]
- 3.Knott S A, Haley C S. Genet Res. 1992;60:139–151. [Google Scholar]
- 4.Darvasi A. Nat Genet. 1998;18:19–24. doi: 10.1038/ng0198-19. [DOI] [PubMed] [Google Scholar]
- 5.Schork N J, Cardon L R, Xu X. Trends Genet. 1998;14:266–272. doi: 10.1016/s0168-9525(98)01497-8. [DOI] [PubMed] [Google Scholar]
- 6.Weller J I, Kashi Y, Soller M. J Dairy Sci. 1990;73:2525–2537. doi: 10.3168/jds.S0022-0302(90)78938-2. [DOI] [PubMed] [Google Scholar]
- 7.Coppieters W, Kvasz A, Arranz J J, Grisart B, Farnir F, Mackinnon M, Georges M. Genetics. 1998;149:1547–1555. doi: 10.1093/genetics/149.3.1547. [DOI] [PMC free article] [PubMed] [Google Scholar]
- 8.Coppieters W, Riquet J, Arranz J J, Berzi P, Cambisano N, Grisart B, Karim L, Marcq F, Simon P, Vanmanshoven P, et al. Mamm Genome. 1998;9:540–544. doi: 10.1007/s003359900815. [DOI] [PubMed] [Google Scholar]
- 9.Van Raden P M, Wiggans G R. J Dairy Sci. 1991;74:2737–2746. doi: 10.3168/jds.S0022-0302(91)78453-1. [DOI] [PubMed] [Google Scholar]
- 10.Kruglyak L, Lander E S. Genetics. 1995;139:1421–1428. doi: 10.1093/genetics/139.3.1421. [DOI] [PMC free article] [PubMed] [Google Scholar]
- 11.Churchill G A, Doerge R W. Genetics. 1995;138:963–971. doi: 10.1093/genetics/138.3.963. [DOI] [PMC free article] [PubMed] [Google Scholar]
- 12.Lyons A L, Laughlin T F, Copeland N G, Jenkins N A, Womack J E, O’Brien S J. Nat Genet. 1996;15:47–56. doi: 10.1038/ng0197-47. [DOI] [PubMed] [Google Scholar]
- 13.Hudson T J, Stein L D, Gerety S S, Ma J, Castle A B, Silva J, Slonim D K, Baptista R, Kruglyak L, Xu J M, et al. Science. 1995;270:1945–1954. doi: 10.1126/science.270.5244.1945. [DOI] [PubMed] [Google Scholar]
- 14.Cai L, Taylor J F, Wing R A, Gallagher D S, Woo S-S, Davis S K. Genomics. 1995;29:413–425. doi: 10.1006/geno.1995.9986. [DOI] [PubMed] [Google Scholar]
- 15.Libert F, Lefort A, Okimoto R, Georges M. Genomics. 1993;18:270–276. doi: 10.1006/geno.1993.1465. [DOI] [PubMed] [Google Scholar]
- 16.Cornelis F, Hashimoto L, Loveridge J, MacCarthy A, Buckle V, Julier C, Bell J. Genomics. 1992;13:820–825. doi: 10.1016/0888-7543(92)90159-p. [DOI] [PubMed] [Google Scholar]
- 17.Landegren U, Kaiser R, Sanders J, Hood L. Science. 1988;241:1077–1080. doi: 10.1126/science.3413476. [DOI] [PubMed] [Google Scholar]
- 18.Womack J E, Johnson J S, Owens E K, Rexroad C E, 3rd, Schlapfer J, Yang Y P. Mamm Genome. 1997;8:854–856. doi: 10.1007/s003359900593. [DOI] [PubMed] [Google Scholar]
- 19.Lunetta K L, Boehnke M, Lange K, Cox D R. Genome Res. 1995;5:151–163. doi: 10.1101/gr.5.2.151. [DOI] [PubMed] [Google Scholar]
- 20.Lander E, Green P. Proc Natl Acad Sci USA. 1987;84:2363–2367. doi: 10.1073/pnas.84.8.2363. [DOI] [PMC free article] [PubMed] [Google Scholar]
- 21.Terwilliger J D. Am J Hum Genet. 1995;56:777–787. [PMC free article] [PubMed] [Google Scholar]
- 22.Ron M, Heyen D W, Weller J I, Band M, Feldmesser E, Pasternak H, Da Y, Wiggans G R, Vanraden P M, Ezra E, Lewin H A. Proceedings of the 6th World Congress on Genetics Applied to Livestock Production, January 11–16, 1998, Armidale NSW Australia. Armidale, Australia: 6WCCALP Congress; 1998. pp. 422–425. [Google Scholar]
- 23.Kappes S M, Keele J W, Stone R T, McGraw R A, Sonstegard T S, Smith T P L, Lopez-Corrales N L, Beattie C W. Genome Res. 1997;7:235–249. doi: 10.1101/gr.7.3.235. [DOI] [PubMed] [Google Scholar]
- 24.Hästbacka J, De La Chapelle A, Kaitila I, Sistonen P, Weaver A, Lander E. Nat Genet. 1992;2:204–211. doi: 10.1038/ng1192-204. [DOI] [PubMed] [Google Scholar]
- 25.Puffenberger E G, Kauffman E R, Bolk S, Matise T C, Washington S S, Angrist M, Weissenbach J, Garver K L, Mascari M, Ladda R, et al. Hum Mol Genet. 1994;3:1217–1225. doi: 10.1093/hmg/3.8.1217. [DOI] [PubMed] [Google Scholar]
- 26.Houwen R H J, Baharloo S, Blankenship K, Raeymaekers P, Juyn J, Sandkuijl L A, Freimer N B. Nat Genet. 1995;8:380–386. doi: 10.1038/ng1294-380. [DOI] [PubMed] [Google Scholar]
- 27.Charlier C, Farnir F, Berzi P, Vanmanshoven P, Brouwers B, Georges M. Genome Res. 1996;6:580–589. doi: 10.1101/gr.6.7.580. [DOI] [PubMed] [Google Scholar]
- 28.Allison D B. Am J Hum Genet. 1997;60:676–690. [PMC free article] [PubMed] [Google Scholar]
- 29.Georges M, Gunawardana A, Threadgill D, Lathrop M, Olsaker I, Mishra A, Sargeant L, Steele M, Terry Ch, Zhao X, et al. Genomics. 1991;11:24–32. doi: 10.1016/0888-7543(91)90098-y. [DOI] [PubMed] [Google Scholar]


