

Abstract
The Rho GTPase cellular signaling cascade was investigated in pro-monocyte and (monocyte-)macrophage cells by examining GTPase expression and activation in serum-containing cultures on model biomaterials. Abundance of Rho GDI and the Rho GTPase proteins RhoA, Cdc42 and Rac1 was determined in cells grown on tissue culture polystyrene, polystyrene, poly-l-lactide and Teflon® AF surfaces. Protein expression was compared based on cell maturity (pro-monocyte to monocyte to macrophage lineages) and by model surface chemistry: Rho proteins were present in the majority of macrophage cells tested on model surfaces suggesting that a pool of Rho proteins is readily available for signaling events in response to numerous activating cues, including biomaterials surface encounter. Rho GTPase activation profiles in these cell lines indicate active Cdc42 and Rho proteins in RAW 264.7, Rac1 and Rho in J774A.1, and Cdc42 and Rac1 in IC-21 cell lines, respectively. Collectively, these proteins are known to play critical roles in all actin-based cytoskeletal rearrangement necessary for cell adhesion, spreading and motility, and remain important to establishing cellular responses required for foreign body reactions in vivo. Differences in Rho GTPase protein expression levels based on cell sourcing (primary versus secondary-derived cell source), or as a function of surface chemistry were insignificant. Rho GTPase expression profiles varied between pro-monocytic non-adherent precursor cells and mature adherent monocyte/macrophage cells. The active GTP-bound forms of the Rho GTPase proteins were detected from monocyte-macrophage cell lines RAW 264.7 and J774A.1 on all polymer surfaces, suggesting that while these proteins are central to cell adhesive behavior, differences in surface chemistry are insufficient to differentially regulate GTPase activation in these cell types. Active Cdc42 was detected from cells cultured on the more-polar tissue culture polystyrene and poly-l-lactide surfaces after several days, but absent from those grown on apolar polystyrene and Teflon® AF, indicating some surface influence on this GTPase in serum-containing cultures.
Keywords: Macrophage, GTPase, Rho, Cdc, Rac, biomaterial, signaling cascade, foreign body reaction
INTRODUCTION
The Rho GTPase family of intracellular signaling proteins is implicated in numerous cellular behaviors, including cytoskeletal reorganization and resultant cell adhesion, shape and motility changes, membrane trafficking, cellular proliferation and transcriptional regulation in mammalian cells [1, 2]. Rho GTPases are key enzymes positioned at signal convergence points from numerous receptors and, when activated, mobilize groups of functionally divergent molecules to elicit diverse responses [3]. Numerous interactions of Rho GTPase proteins with upstream regulators and downstream targets create a vast, complex cell-signaling network [1, 3].
Rho, Rac and Cdc are the most frequently studied Rho GTPase proteins and, like other G proteins, function as intracellular molecular switches, cycling between active (GTP bound) and inactive (GDP bound) forms. Cellular regulation of these proteins, based on the exchange of substrate GDP for GTP, is complex and affected by multiple regulatory factors including Guanine Nucleotide Exchange Factors (GEFs), that catalyze the exchange of bound GDP for GTP [1], Guanine Activating Proteins (GAPs), that increase the intrinsic Rho protein GTPase activity, and Rho GDP-Dissociation Inhibitors (GDIs), that prevent release of bound GDP, stabilizing inactive forms of Rho proteins [4, 5].
Rho GTPases influence the ability of many cell types to adhere, proliferate and spread, mobilizing elements of the cytoskeleton in response to environmental stimuli that are both physical and chemical in nature [5–7]. Significant environmental cues in the context of biomaterials include both (solid) physical and (soluble) chemical stimuli such as culture plastics and implantable materials interfaced with host tissues, as well as altered physiological states of tissues adjacent to a biomaterial (hypoxia, edema, mechanical and chemokine gradients, etc.). Many attachment-dependent cell types require surface contact, haptotaxis, adhesion, spreading and migration to initiate proliferative and phenotypic responses [8]. Other cells (e.g., leukocytes), while not requiring attachment for normal functions, use outside–inside receptor-initiated interrogation of both natural and synthetic surfaces in homeostatic and immuno-modulatory responses. Rho GTPases are implicated in these cells’ phenotypic functions and signaling [9–12].
Implanted biomaterials initiate a host ‘foreign body’ inflammatory reaction involving a series of cell–materials surface-mediated interactions [13, 14]. Rho GTPases are likely involved in mediating this ubiquitous host cell–materials interaction. Monocyte, macrophage and fibroblast recruitment to and presence at biomaterial implant sites correlate with histological events producing implant-associated fibrosis and unresolved wound healing [13]. Gross cellular responses (e.g., morphological changes in cytoskeletal features) to biomaterials surfaces can be directly observed [15], yet cell-surface signaling mechanisms underlying propagation of key events in this context remain poorly understood. Ultimate control of this adverse host inflammatory response requires an improved understanding of implant surface reactions with various cell types crucial to healing response mechanisms. In particular, monocyte and macrophage recruitment, followed by cell-surface attachment, monocyte maturation to differentiated macrophage phenotypes, and ensuing signaling events initiating the foreign body reaction, including characteristic foreign body giant cell (FBGC) development [13, 14, 16, 17] all plausibly involve Rho GTPases.
Directly relevant to implant-associated cell types, Rho GTPases have been studied extensively in adherent Swiss 3T3 fibroblast and Bac1.2F5 macrophage cell lines [1–4, 18]. Less work is reported for other cell lines, including J774A.1 (monocyte-macrophage) [12] and a sub-line of the RAW 264.7 monocyte-macrophage, RAW LR/FMLPR 2 [19]. In these cells, Rho GTPase expression has been linked to regulation of specific cytoskeletal features: RhoA is associated with control of stress fiber formation (fibroblasts) and actin and myosin attachment to the cell membrane at focal adhesion sites [1, 2]. Rac controls lamellipodial protrusion and membrane ruffle formation [18] and Cdc42 induces formation of microspikes and filopodia, and influences cell polarity [4]. In Swiss 3T3 fibroblasts, a hierarchical signaling cascade exists beginning with Cdc activation, then Rac, and subsequent activation of Rho [20]. Rho GTPase contributions to macrophage phagocytic behavior have also been reported [19, 21]. Recently, the Rho/ROCK (Rho-activated kinase) signaling proteins have been implicated in the ability of fibroblasts to ‘sense’ rigidity in their adhesion environment [22]. These effects have profound implications for elucidating cell-based mechanisms in wound healing, tissue regeneration and neogenesis [7].
The foreign body reaction characterized by chronic unresolved wound healing [13], is mediated by macrophage cells in vivo. Rho GTPase involvement in key cellular responses to biomaterials such as macrophage activation and differentiation at the implant site is therefore a significant issue. Hence, expression and activation profiles of Rho GTPases Rho, Rac1 and Cdc42 in primary-derived murine pro-monocytes and differentiated bone marrow macrophages (BMMO), and in three murine (monocyte-) macrophage-derived cell lines in culture are compared here. The use of ‘(monocyte-) macrophage’ is meant to describe the three cell lines J774A.1, RAW 264.7 and IC-21 collectively, despite their presumed phenotypic differences and lineage maturity, and may refer to any combination of the monocyte-macrophage cell lines J774A.1 and RAW 264.7 with each other and/or the macrophage cell line IC-21. Specifically, Rho GTPase expression (i.e., presence or absence of this protein) and activation (i.e., presence or absence of the GTP-bound protein) profiles were compared for: (1) primary-derived macrophage to secondary-derived immortalized (monocyte-) macrophage cell line populations, (2) cellular maturity, ranging from the (non-adherent) pro-monocytic mixed population bone marrow precursor cells to the fully differentiated (adherent) bone marrow macrophage and (3) ability of cells to adhere to, grow (enlarge), proliferate and spread on control and model biomaterial polymer surfaces. We have previously reported the ability of BMMO and RAW 264.7, J774A.1 and IC-21 (monocyte-) macrophage cells to adhere to, proliferate and spread on these surfaces [15]. New findings here relate to key signaling events in the context of specific model biomaterials and macrophage culture systems to progress toward an improved understanding of events underlying macrophage attachment to and proliferation on biomaterials. We hypothesized that surface chemistry would influence Rho GTPase expression and/or activation profiles based on observations of varied gross cell morphologies on the selected substrates. Interestingly, we found that Rho GTPase expression is not significantly different in cultured cells based on either cell sourcing or culture surface chemistries tested. Rho GTPase activation in the monocyte-macrophage cell lines RAW 264.7 and J774A.1 was not modulated in a surface-dependent manner. In contrast, active Cdc42 was detected in the IC-21 macrophage cell line on more polar surfaces (tissue culture polystyrene (TCPS) and poly-l-lactide, (PLA)) after several days in culture, and absent from less polar polystyrene [23] and Teflon® AF surfaces, correlated to observations of distinct cell morphologies based on surface polarity.
MATERIALS AND METHODS
Primary cell harvest
Bone marrow cells were harvested from the femurs and tibias of C57/BL-6 mice (Jackson Laboratories) as previously described [24]. Proteins were either extracted from these isolated cells immediately upon harvest from bones and labeled ‘pro-monocytic’ due to the immature nature of the cells, or these cells were plated in 10 ml of complete bone marrow macrophage (BMMO) media (10% heat inactivated fetal bovine serum (FBS, HyClone), 10% L929 fibroblast conditioned medium, 1% penicillin-streptomycin (Life Technologies), 1% HEPES, 1% non-essential amino acids, and 1% sodium pyruvate (all Sigma) in Dulbecco’s modified Eagle’s medium (DMEM, Mediatech) to promote maturation to the macrophage phenotype for 10 days before collection and protein extraction [24].
Cell culture
Murine monocyte-macrophage cell lines RAW 264.7 and J774A.1, and the macrophage IC-21 cell line were obtained from the American Type Culture Collection (ATCC, Manassas, VA, USA). Cells were cultured in DMEM (J774A.1) or RPMI 1640 (Mediatech, for IC-21 and RAW 264.7) supplemented with 10% FBS and 1% penicillin-streptomycin or complete BMMO media (BMMO). Cultures were maintained in T175 TCPS flasks (Nunc™) under standard conditions: incubation at 37°C, 98% humidity and 5% CO2. Cells were dissociated from culture flasks by incubation with Ca2+- and Mg2+-free Hanks’ balanced salt solution (Life Technologies) (J774A.1 and RAW 264.7), or by scraping with a rubber policeman (IC-21). Cell concentration and viability was assessed using trypan blue dye exclusion (BioWhittaker) and a hemacytometer. All cell line subcultures were ≤ 41 beyond the passage number as received from ATCC.
Cell culture on model surfaces
TCPS (Falcon®, Becton-Dickinson) and PS (Corning) 15 × 100 mm dishes were utilized for both control and experimental conditions. Glass plates (20 × 100 mm) were treated with a potassium hydroxide solution overnight and rinsed copiously with 18 MΩ Nanopure-grade water prior to use. Fluoropolymer culture surfaces were prepared by coating PS dishes with 0.1 wt% Teflon® AF (DuPont Fluoroproducts) in FC-40 solvent (3M). Coated surfaces were incubated in vacuum overnight to remove residual solvent, and plates were misted with 70% ethanol, dried and treated with biosafety cabinet UV light for 20 min immediately before culture use, a process shown benign to cell-culture-surface chemistry [25]. PLA (50 or 100 kDa, Polysciences; 0.2% solution in methylene chloride) was pipetted into glass plates and air-dried (covered). Plates were sterilized as described above. Plates were tested for the presence of contaminating endotoxin using a Pyrogene™ Assay kit (Cambrex), and endotoxin levels were determined to be below the kit detection limit (0.02 EU/ml). Plates were subsequently pre-treated with appropriate media containing 10% FBS for a minimum of 6 h before cell seeding. This medium was removed, cells were seeded at concentrations ranging from 5.0 × 10⁴−1 × 10⁶ cells per plate and grown to a specified point of sub-confluence (to avoid profiling staged or quiescent cells). Initial seeding densities varied slightly for each cell type, due to surface-dependent differences in cell adhesion and growth rates, and in order to create roughly equivalent culture time endpoints whenever possible.
Phase-contrast microscopy
Images were obtained on either a Nikon Eclipse TS100 or a Nikon TMS inverted microscope using Nikon objectives. A Kodak DC290 camera was used to capture field images that were subsequently processed in Adobe Photoshop 6.0 (Adobe Systems).
Contact-angle analysis
Static water contact angles were measured with a contact angle goniometer (Krüss DSA 10). Reported contact angle measurements are the mean of 4 measurements on each of 3 samples for each experimental condition. The water drop profiles were fit using the tangent method drawn from the three-phase contact point along the drop/air phase boundary.
Protein harvest for Rho GTPase expression and activation assays from cells cultured on control and model biomaterials surfaces
Upon reaching a predetermined sub-confluent density (<90%) in culture, cells were rinsed once with Dulbecco’s phosphate-buffered saline (DPBS, HyClone) to remove residual media, and 0.75 ml of cell lysis buffer was applied. Proteinase inhibitors (1 μg/ml aprotinin, 1 μg/ml leupeptin and 1 mM (final) phenylmethylsulfonyl fluoride (PMSF)) were added to the lysis buffer (M-PER® (expression only; Pierce Biotechnology, Inc) or 25 mM Tris-HCl with 150 mM NaCl, 5 mM MgCl2, 1% NP-40, 5% glycerol and 1 mM dithiothreitol (DTT) (combined expression/activation assays)) immediately before use. Cell lysates were removed with the aid of a rubber policeman and lysates were pipetted into sterile microcentrifuge tubes on ice. Samples were vortexed briefly and kept cold (4°C) throughout the harvesting and activation assay procedures. Rho GTPase expression samples were clarified at 16 000 × g, 4°C for 15 min and stored at −20°C.
Active (GTP-bound) Rho proteins were pulled down using commercially available affinity columns (Pierce EZ-Detect™ Activation Kits) with specificity for Rac1, Cdc 42 and Rho. The Rho pulldown is not specific for RhoA exclusively, but is known to detect three common (A, B and C) isoforms, which are highly homologous. Appropriate positive and negative control treatments (GTPγS or GDP) were carried out (per manufacturer’s instructions) to ensure that the affinity capture procedures functioned properly. To avoid GTP hydrolysis, cell lysates were immediately loaded onto affinity columns preincubated with the appropriate binding protein for the target of interest: 20 μg GST-Pak1-PBD (Cdc42 capture), or GST-human Pak1-PBD (Rac1 capture), or 400 μg GST-Rhotekin-RBD (Rho capture). All binding and rinsing steps were carried out per manufacturer’s instructions. Protein was eluted with 2×SDS-Laemmli sample buffer with β-mercaptoethanol (Sigma-Aldrich) and heat. Samples were centrifuged at 7200 × g for 2 min and stored at −20°C until analysis.
Total protein quantification
Total cellular protein was quantified per manufacturer’s instructions using the Bio-Rad Protein microassay (Bio-Rad Laboratories, linear range 0.05–0.5 mg/ml) and a microplate reader (Phenix Research Products).
Rho GTPase expression analysis by immunoblotting
Commercial preparations of whole cell lysates (WCL; Santa Cruz Biotechnology) were used as positive controls for expression of each protein of interest: HeLa WCL for Cdc42, RhoA and Rho GDI; KNRK WCL for Rac1; and K562 WCL for Cdc42 and Rac1. Equivalent amounts (25 μg) of total cell lysate from each expression sample and controls were analyzed using standard Western blot techniques. Equivalent loading of samples based on amount or volume was confirmed by SDS-PAGE, and equivalent and optimized transfer conditions were confirmed by post-electrotransfer staining of nitrocellulose (NC) membranes (Bio-Rad Laboratories) and gels (data not shown).
Briefly, samples were electrophoresed on a 12% SDS-polyacrylamide gel and electrotransferred to a 0.2 μm NC membrane (Bio-Rad Laboratories). Membranes were blocked with 3% bovine serum albumin (BSA, Sigma-Aldrich) in Tris-buffered saline (TBS, Bio-Rad Laboratories) and washed with 0.05% TBST (Tween®-20 (Sigma-Aldrich) in TBS). Blotting conditions were optimized for each protein separately. Primary antibody solutions (rabbit polyclonal unless otherwise noted, Santa Cruz Biotechnology) at concentrations ranging from 1:100 to 1:1000 were applied to membranes (individually) for RhoA (clone 119, goat polyclonal), Rac1 (clone C-14), Cdc42 (clone P1) or Rho GDI (clone A-20). Optimum detection was achieved using a 1:100 dilution for RhoA and a 1:500 dilution for Rac1, Cdc42 and Rho GDI. Horseradish peroxidase (HRP)-conjugated secondary antibodies (goat anti-rabbit IgG-HRP or mouse anti-goat IgG-HRP, Santa Cruz Biotechnology) were applied at concentrations of 1:500 (24) or 1:5000 (Cdc42 and Rac1). Blots were developed using Supersignal® West Pico Chemiluminescent Substrate or SuperSignal® West Dura Extended Duration Substrate (Pierce Biotechnology) and membranes were quantified on either a BioChemi Imaging System using LabWorks software (UVP) or a ChemiDoc™ XRS System using Quantity One® software (Bio-Rad Laboratories).
Each blot contained one or more positive control lysate sample(s) (WCL, vida supra) known to contain the protein analyte of interest. All sample values obtained from chemiluminescent imaging techniques were normalized to the positive control WCL value of the same blot to minimize effects attributed to variation between blots due to slight differences in electrophoretic conditions. Generally, blots were not stripped and re-probed with multiple antibodies. However, when protein supply was limited (e.g., IC-21) blots were stripped with Restore™ Western Blot Stripping Buffer (Pierce Biotechnologies) prior to re-probing.
Protein activation analysis by immunoblotting
As noted above, the Rho pull-down assay employed here is not specific for RhoA exclusively, but detects the common, highly homologous A, B and C isoforms. Subsequent RhoA-specific probing of these samples was attempted with the same antibody used in expression analyses (Santa Cruz Biotechnology, clone 119) with only marginal success, likely due to the small amount of active protein isolated. Further, this RhoA antibody was compared to numerous commercially supplied RhoA antibodies (different species, different suppliers, etc.), and was found to be, by far, the most effective RhoA antibody available for this assay. Due to these difficulties, the less-specific ‘Rho’ antibody was used for activation assays. Thus, Rho activation results are reported as ‘Rho’, in contrast to protein expression data reported as ‘RhoA’.
Up to 50 μl of cell-derived activation lysate and 25 μg of WCL controls were analyzed via standard Western blot techniques as described (vida supra). Primary antibody solutions (Pierce Biotechnology) at concentrations of 1:100 (24) or 1:250 (Rac1 and Cdc42) were applied to the membranes individually for Rho (mouse monoclonal IgG1), Rac1 (mouse monoclonal IgG2b) and Cdc42 (mouse monoclonal IgG1). Immunopure® Goat Anti-Mouse IgG (H + L) peroxidase-conjugated secondary antibody (Pierce Biotechnology) was applied at a concentration of 1:1000 and blots were developed and quantified as described above.
Statistical analysis
To determine statistically significant differences in protein expression, split plot analysis of variance was performed on data, where the whole plot effects were cell line and protein, and the split plot effect was surface chemistry. The whole plot error was trial by cell line and by protein. The split plot error was the surface by the whole plot error interaction. Error was represented as ± 1 standard error of the mean (SEM).
RESULTS
Microscopic evaluation of each cell type in serum cultures, with attention to characteristic morphological features (filopodia, membrane ruffles) exhibited by cells on each control and model surface revealed distinct features based on cell type and surface. Culture surfaces represent a wide wettability range, as determined by static aqueous contact angle measurement: hydrophilic TCPS (54 ± 2°) [26], moderately hydrophobic PS (92 ± 1°) [26] and PLA (82 ± 1°) [26, 27] and very hydrophobic Teflon® AF (116 ± 2°) [27], consistent with values previously reported. Cell adhesive and proliferative behavior was expected to vary on these different substrates related to surface chemistry effects on protein selection from complex biological milieu (serum). Morphological features exhibited by cells on each surface provided basic information about general cell responsiveness to surfaces, including establishment of focal adhesions required for surface colonization, a requisite step in inflammatory response induction at implant sites. Further, cell morphology has been associated with expression and/or activation of specific Rho GTPases [28].
Phase-contrast microscopy observation of monocyte/macrophage cells revealed populations exhibiting different morphologies based on surface chemistry (Fig. 1). Hydrophilic TCPS promoted attachment, growth and proliferation for all cells tested, and cells exhibited adherent (punctate, astral) morphology indicative of numerous cell-adhesive sites (Fig. 1A and 1E). At early time points cells exhibited motile phenotypes on all surfaces, as indicated by the presence of filopodia and membrane ruffling (Fig. 1E–H). However, as cultures progressed to nearly confluent conditions cells adopted a tightly packed ‘cobblestone-like’ growth pattern allowing maximal use of surface area (data not shown). Morphology on PLA surfaces (Fig. 1C and 1G) was highly similar to TCPS. Typically, cells grown on PS (Fig. 1B and 1F) and Teflon® AF (Fig. 1D and 1H) exhibited lengthy filopodia and large areas of membrane ruffling; these effects were always more pronounced on Teflon® AF surfaces.
Figure 1.
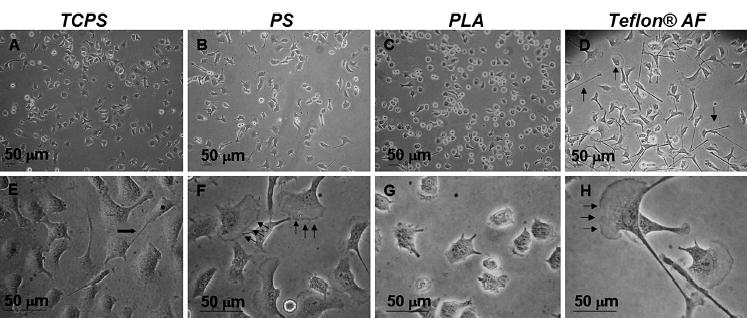
Phase-contrast photomicrographs of various morphologies exhibited by populations of IC-21 macrophages on polymer surfaces at early (<50% confluent) culture times. Cells exhibit primarily astral morphology with some filopodial extensions (E, bold arrow) at sub-confluent culture conditions on TCPS (A, E). However, as these cultures progress to 100% confluence cells adopt a typical ‘cobblestone-like’ pattern of cell growth with fewer extensions (data not shown). On PS (B, F) cells exhibit membrane ruffling (F, arrows) and filopodia, similar to (but to a lesser extent than) behavior observed on Teflon® AF. Morphology is more compact on PLA surfaces (C, G), in contrast to the lengthy filopodia and large areas of membrane ruffling (D and H, arrows) observed on Teflon® AF. Results are representative of numerous (>3) fields and (>3) trials.
Pronounced morphological variation was observed for the most macrophage-like cell line tested, IC-21, on Teflon® AF (Fig. 2) At early time points (24 h), cells with loosely adherent cell bodies and multiple attachment sites at the termini of lengthy filopodia were frequently observed. Filopodia often extended radially from the cell body (Fig. 2A–C). Alternatively, filopodia extended in a direction opposite that of an area of membrane ruffling (Fig. 2D and 2I, cell No. 1). Collectively, the arrangement of filopodia suggests that cells first send out filopodia to sample the surrounding surface in all directions, and subsequently respond to environmental cues by moving toward a ‘desirable’ region (indicated by the development of a cellular ‘leading edge’ (designated by the presence of filopodia) and a ‘lagging edge’ (designated by the presence of membrane ruffling)). Characteristic membrane ruffling is shown in Fig. 2E and 2F, and less typical morphological variants and multinucleation are shown in Fig. 2G, 2H and 2J, respectively.
Figure 2.
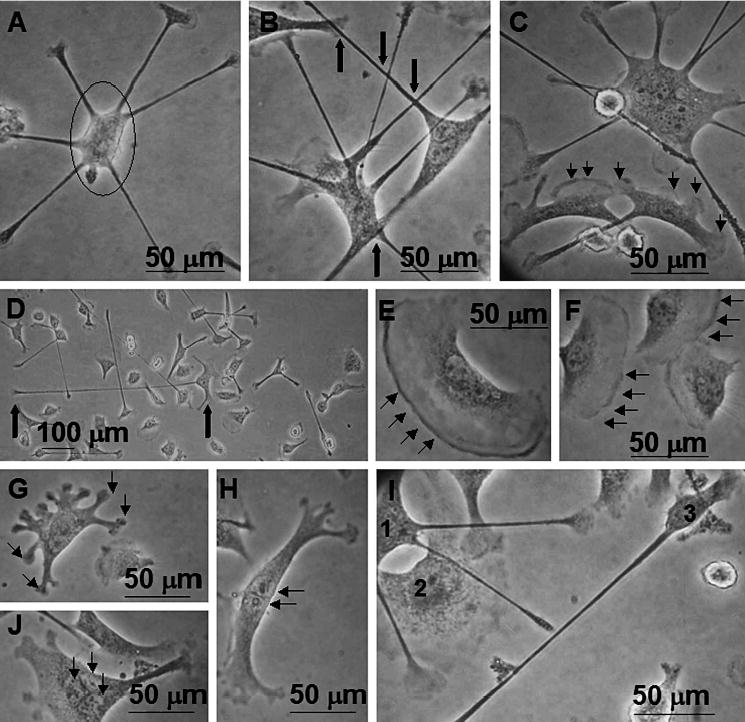
Phase contrast photomicrographs of IC-21 macrophage morphologies on Teflon® AF surfaces. (A) Cells commonly exhibit loosely adherent cell bodies (circle) with numerous filopodia, sometimes in a circular arrangement. (B) Distinct from cultures on all other surface chemistries, filopodial extensions are often observed to cross one another (bold arrows), or to terminate in proximity to attachment sites of other cells. (C) Cell populations on Teflon® AF surfaces show a mixture of actin-based cytoskeletal features (filopodia, lamellipodia, membrane ruffling), often with numerous features on a single cell, as illustrated by all 3 cells in this field. Note differences in cell size, shape and features. (D) Filopodia are frequently lengthy, extending hundreds of μm from the cell body (bold arrows indicate cell body (right) and filopodium terminus (left)). (E, F) Cells showing characteristic membrane ruffling, indicative of the ‘lagging edge’ of a motile cell. (G, H) Less typical morphologies observed on Teflon® AF include cells with numerous bulbous attachment sites (G) and tree-trunk-like morphologies (H). (I) This field illustrates the diversity of the cell population observed: cell ‘1’ has multiple lengthy filopodia that cross over cell ‘2’, and that are diffuse rather than punctate at their termini, possibly indicative of active surface probing. Cell ‘2’ has a diffuse cytoplasm, with large areas if membrane ruffling. Cell ‘3’ has a small well-defined cell body with one lengthy filopodium. (J) Occasionally, cells with multiple nuclei (3–5) have been observed on Teflon® AF without the addition of exogenous cytokines that promote fusion events. Results are representative of numerous (>3) experiments.
Regardless of cell lineage or derivation, the monocyte/macrophage cells grown on Teflon® AF exhibited a mixture of phenotypic features such as membrane ruffles and filopodia within the same culture and in proximity to one another (Fig. 2D and 2I). Significantly, cell behavior on Teflon® AF was different from predicted cell growth patterns. For example, IC-21 cells grown on Teflon® AF sent out unusually lengthy (hundreds of μm) filopodia (Fig. 2D, arrows), indicating a lack of appropriate adhesive contact sites on these highly hydrophobic surfaces in serum. Equally unusual, filopodia were repeatedly seen crossing over one another (Fig. 2B, 2C, 2D) or over other cell bodies (Fig. 2I, cell Nos 1 and 2). Figure 2I shows cells moving in directions opposite one another, but nearly on top of one another (cell Nos 1 and 2). In proximity to cell Nos 1 and 2, cell No. 3 exhibits a very different morphology, a compact cell body with a single filopodium. Importantly, these features are maintained as cell culture progresses to near 100% confluence on Teflon® AF, in contrast to all other surface chemistries where adherent cell shape is modified as progression toward confluence occurs, most notably observed in IC-21 cells and mature, differentiated BMMO. In general, these cell types responded to surfaces in a more pronounced and morphologically similar fashion than either of the monocyte-macrophage cell lines (J774A.1 and RAW 264.7).
To correlate observed morphological features (filopodia, membrane ruffling) and Rho GTPase signaling proteins in monocyte/macrophage cells grown on these surfaces, Rho protein (1) expression and (2) activation assays were performed. Lysate samples from cells of increasing maturity (e.g., primary pro-monocytes, secondary monocyte-macrophage cell lines J774A.1 and RAW 264.7, secondary macrophages IC-21 and primary BMMO) were analyzed for expression of the regulatory factor Rho GDI, and Rho GTPase proteins, RhoA, Rac1 and Cdc42.
The least mature cell group tested, non-adherent pro-monocytic samples containing a mixed population of bone marrow-derived cells, had detectable levels of Rho GDI protein, but none of the probed Rho GTPases (data not shown). This was attributed to their immature (poorly-phagocytic) and non-adherent status, inducing less Rho GTPase production. Indeed, when this population was plated and allowed to mature for ten days to BMMO, cells expressed detectable levels of all Rho GTPase proteins probed except Rac1 (data not shown). The adherent (monocyte-) macrophage cell lines, J774A.1, RAW 264.7 and IC-21, exhibited similar expression profiles; the majority of Rho GTPase proteins were expressed on most surfaces tested (Fig. 3A–C); RhoA was absent on TCPS from both the J774A.1 and IC-21 cell lines (Fig. 3A and 3C), and both RhoA and Rho GDI were non-detectable in IC-21 cells cultured on PLA (Fig. 3A). A comparison of each Rho protein expression profile within each cell type based on surface chemistry alone (control: TCPS, PS, versus model: PLA, Teflon® AF surfaces) revealed only two significant pairings, IC-21, Rho GDI on TCPS versus either PLA or Teflon® AF (Fig. 3A).
Figure 3.
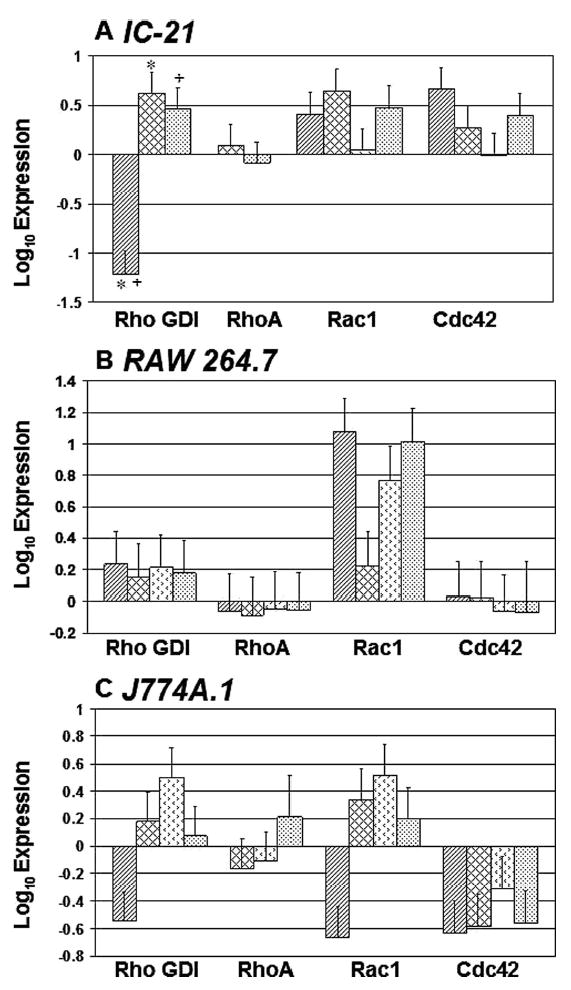
Rho GTPase expression comparison for (monocyte-) macrophage cell lines
cultured on control (TCPS, PS) and model (PLA,
Teflon® AF) surfaces. Protein expression was
normalized to a whole cell lysate for the protein of interest. Error bars
represent standard error of the mean, n =
3–8. Only two significant pairings (P <
0.05) were noted, and they are indicated by a * or a
+, respectively (panel A). Key: ▨
TCPS, ▩ PS,  PLA,
Teflon® AF.
PLA,
Teflon® AF.
Close examination of Rac1 expression (data not shown), which appeared to be most variable among the Rho GTPases tested, revealed that comparatively no statistically significant differences based on cell line or surface chemistry were observed. Comparison of Rho GTPase expression profiles on the most different polymer surfaces (based on polarity, chemistry and cell morphological response), TCPS and Teflon® AF, revealed only one statistically significant pairing for Rho GDI expression (Fig. 3A). Similar results were obtained for a comparison of Rho GTPase expression profiles on TCPS and PLA surfaces (data not shown).
Activation assays performed under identical conditions (for all cells and all surfaces) indicate active (GTP-bound) Cdc42 and Rho proteins in RAW 264.7, Rac1 and Rho in J774A.1, and Cdc42 and Rac1 in IC-21 cell lines, respectively (Table 1). No modulation of Rho or Cdc42 activation in RAW 264.7 cells as a function of culture surface was observed, as indicated by detectable amounts of active protein on each surface tested. A similar result was obtained for the J774A.1 cell line, except that the active proteins in this cell type are Rho and Rac1, rather than Rho and Cdc42. In the IC-21 cells no active Rho was detected on any culture surface, and active fractions of Rac1 and Cdc42 were only detected on TCPS (both proteins) and PLA (Cdc42 only).
Table 1.
Rho GTPase activation summary for (monocyte-) macrophage cell lines
| Cell line |
||||
|---|---|---|---|---|
| Protein | Culture surface | RAW 264.7 | J774A.1 | IC-21 |
| Rho | TCPS | + | + | − |
| PS | + | + | − | |
| PLA | + | + | − | |
| Teflon® AF | + | + | − | |
| Rac1 | TCPS | − | + | + |
| PS | − | + | − | |
| PLA | − | + | − | |
| Cdc42 | Teflon® AF | − | + | − |
| TCPS | + | − | + | |
| PS | + | − | − | |
| PLA | + | − | + | |
| Teflon® AF | + | − | − | |
indicates the presence of the GTP-bound form of the protein(s), −indicates the absence of the GTP-bound form of the protein(s). The Rho pulldown and probe is not specific for RhoA, but rather detects Rho isoforms A, B and C. See Materials and Methods for a detailed explanation.
DISCUSSION
In this study, culture surfaces with various properties were selected as models to determine effects of surface chemistry on macrophage adhesion and subsequent changes in expression levels and/or activation states of select Rho GTPases. Chemistries selected included: TCPS, the current ‘gold standard’ for adherent cell culture, PS, commonly employed for suspension culture, PLA an FDA-approved synthetic bioerodible polymer and Teflon® Amorphous Form (AF), (4,5-difluoro-2, 2-bis (trifluoromethyl)-1,3-dioxole co-polymerized with tetrafluoroethylene) the soluble analog of Teflon®, a highly hydrophobic fluoropolymer with a long history of use in biomaterials implants [29, 30]. Our previous work characterized these surface chemistries using X-ray photoelectron spectroscopy and correlated surface characteristics to endothelial cell culture support. For this attachment-ependent cell type, adhesion from serum and contact angle were proportional to surface oxygen content [26].
Until a decade ago, the primary role of Rho GTPases was believed to be regulation of cytoskeletal organization in response to extracellular growth factors. Recent evidence indicates that these proteins are key mediators of many critical cellular events such as cell cycle progression and apoptosis, and are often implicated in disease [1, 3]. Rho GTPases respond not only to growth factors [6, 20, 31], but also to many molecular signals often found at biomaterial implant sites: cytokines, antigens, hormone neurotransmitters and extracellular matrix (ECM) cues [5, 15, 22]. Particularly important in the context of biomaterials, integrin interactions with ECM proteins have been shown to regulate RhoA, Rac1 and Cdc42 [31–36], and specific integrin β-subunits are known to differentially activate specific Rho GTPases (β3, Rho and β1, Rac/Cdc) through outside-inside signaling [37, 38]. Different cell lineages express distinctive groups of integrins that facilitate ECM protein-mediated adhesion and other interactions [39, 40].
Given that surface chemistry dictates protein selection from complex biological milieus [41] (represented here by serum-containing cultures) and subsequent cell adhesion, growth, proliferation and spreading relies on the establishment of these protein mediated interactions [42], surface chemistry influences on Rho GTPase expression and activation in various (monocyte-) macrophage cells were studied. Interestingly, these cells have the unique ability to proliferate efficiently on fluorocarbon surfaces (Figs 1 and 2) that are non- or poorly supportive of most mammalian cell adhesion (e.g., endothelial cells, fibroblasts) [26, 43]. Furthermore, cell morphologies were markedly different on control versus Teflon® AF surfaces [15], suggesting that expression of specific Rho proteins related to the most commonly observed morphological features could be differentially regulated by the surface. Previous reports using Swiss 3T3 fibroblasts indicated that surface chemistry affected RhoA activation [43].
As cell response to extracellular signals requires regulation of actin polymerization, largely orchestrated by Rho GTPases [1–3], correlation of cytoskeletal regulation through adherent morphology to Rho GTPase activity should be possible. The actin cytoskeleton comprises filamentous actin organized into discrete structures: filopodia, lamellipodia and membrane ruffles, all features commonly observed in monocyte-macrophages grown on various culture surfaces [15]. Observations of these features is correlated to multiple factors: (1) cell maturity; mature macrophages (e.g., IC-21 cell line, Fig. 1) exhibit more filopodia and membrane ruffles on control and model surfaces than less mature RAW 264.7 and J774A.1 cell lines on the same surfaces (data not shown); (2) surface area; greater areas available for cell spreading correlate to the presence of filopodia and a motile phenotype; (3) surface chemistry; cells cultured on very hydrophobic substrates have been observed to exhibit more filopodia per cell (up to 6) and extremely lengthy (400–500 μm) filopodial protrusions (Fig. 1D and 1H), even when surface area becomes limiting.
Despite differences in gross adherent cell morphologies on polymer surfaces (Fig. 1), protein expression data was not statistically significantly different for expression of RhoA, Rac1, Cdc42 or Rho GDI on these surfaces (Fig. 3). Although Rac1 expression appears to vary when compared to the other Rho proteins, no statistically significant differences (P < 0.05) based on either surface chemistry or cell line were observed. Both Cdc and Rac are necessary for cell spreading: disruption of expression of either protein has been shown to inhibit spreading [5, 36]. Integrin activation of Cdc42 is linked to a mobile phenotype and increased cellular migration, while Rac is associated with membrane ruffles and lamellipodial formation important to cellular polarization [1–3], and Rho is known to increase cell contractility and focal adhesions necessary to establish adherence [6, 44]. Samples tested here for protein expression represent mixed populations of cells exhibiting all of these morphological features (e.g., Fig. 2D and 2I). Collectively, expression of each of these proteins was expected in the adherent monocyte-macrophage cells due to their observed proliferative and motile phenotypes on all materials tested at the time of protein collection.
Gross cell morphologies and size were different for cell cultures on TCPS and Teflon® AF (e.g., Fig. 1A and 1E versus 1D and 1H). However, a detailed comparison of expression values for Rho GTPases (Rho GDI, RhoA, Cdc42 and Rac1) on these surfaces revealed only one statistically significant difference: Rho GDI expression on TCPS compared to Teflon® AF (Fig. 3A). Possible explanations for lack of predicted modulation of Rho GTPases based on polymer surface chemistry can be attributed to both cellular and molecular events. First, the adherent macrophage phenotype, regardless of source (primary or secondary derived cells) interacts with the surface (regardless of chemistry) to attach, grow, proliferate and spread upon it. All such behaviors require cytoskeletal rearrangement, orchestrated by Rho GTPases. Further, cultures on both control and model surfaces contained diverse cell populations, even at late culture time points where surface space was limited and cell spreading reduced. This heterogeneous cell population may lead to a net ‘averaging’ of contributions from any single protein correlated to specific membrane features when pooled lysates are analyzed. Finally, the monocyte-macrophage is a dynamic cell type with the ability to mature and differentiate in many ways in response to various stimuli. Membrane trafficking and antigen presentation are crucial macrophage behaviors to which the Rho GTPases contribute. Thus, mature macrophage cells likely maintain Rho GTPase expression levels of sufficient quantity such that a population of these proteins is continuously present and poised for rapid activation in response to extracellular cues.
Rho GDI is known to be ubiquitously expressed in many cell types [1, 45] and is measurable, even in pro-monocytic cells where RhoA, Rac1 and Cdc42 were undetectable (data not shown). Detection of Rho GDI expression in the absence of RhoA, Cdc42 and Rac1 expression may be attributed to the fact that Rho GDI complexes with numerous Rho proteins to stabilize them in their inactive form in the cytoplasm. Thus, significantly greater amounts of Rho GDI are likely to be present, placing it within detectable limits. Further, the immature and non-adherent status of these cells may contribute to low Rho GTPase expression levels.
Active (GTP-bound) forms of Rho, Rac1 and Cdc42 were detected J774A.1, RAW 264.7 and IC-21 cells, as shown in Table 1, with active Rho detectable in both monocyte-macrophage cell lines. Rho activation by integrins is known to be biphasic [5, 32]. Immediately upon cell binding to a surface, Rho is inhibited to allow cell attachment and spreading, and is subsequently reactivated to enhance the formation of focal adhesions [32]. This understanding is consistent with the observation of Rho expression and activation (where detected) in cells cultured on model biomaterial surfaces, since cells are collected at time points where focal adhesion formation is likely ongoing. Further, monocyte differentiation to a macrophage phenotype is accompanied by growth and cytoskeletal changes, to which the active Rho form may contribute. Active Rho was absent in the mature macrophage IC-21 cell line, consistent with the highly motile phenotype observed even at advanced culture time points.
Although the RAW 264.7 and J774A.1 cells share common Rho GTPase activation profiles, they diverge at Cdc42/Rac1 activation. Yet, active Rac and Cdc42 share a downstream effector, PAK [31], that is implicated in both proliferative signaling and cytoskeletal regulation [46]. Therefore, the outcome of these apparently different activation profiles may be functionally equivalent in terms of cell attachment and spreading on biomaterials surfaces. Active Cdc42 fractions were detected in IC-21 on both TCPS and PLA surfaces, which may be related to surface chemistry given that these polymers exhibit more polar surface chemistries, TCPS initially [26], and PLA as surface hydrolysis occurs over the time-course of the experiment. Further, active Cdc42 was absent on the apolar PS and Teflon® AF surfaces. This result correlates to similarities observed in gross cellular morphologies on TCPS (Fig. 1A and 1E) and PLA (Fig. 1C and 1G) versus the morphologies observed on the more apolar hydrophobic surfaces PS (Fig. 1B and 1D) and Teflon® AF (Fig. 1F and 1H). Active Rac and Cdc have been implicated in regulation of ‘strong versus weak’ cell adhesion through binding to IQGAP, a Rho binding protein that plays a role in E cadherin-mediated cell–cell adhesion [47]. Active Rac1 detection in both J774A.1 and IC-21 cultures on TCPS could be related to the rapid and facile population of this surface with cells, with a concomitant increase in cell–cell adhesion as the population of cells approaches 100% confluence on this surface.
CONCLUSIONS
Despite gross morphological differences observed in (monocyte-) macrophage cell cultures on various polymer substrates, no statistically significant differences in expression levels of Rho GTPases RhoA, Cdc42 or Rac1 were detected as a function of either cell lineage (primary versus secondary-derived cell source), or surface chemistry. Pro-monocytic primary bone marrow-derived cells were found to contain ample Rho GDI protein, but expression of Rho GTPases RhoA, Rac1 and Cdc42 was not detectable, suggesting that these proteins were below the detection threshold commonly achieved by more mature, adherent cell types. Rho GTPase expression profiles (based on cell maturity from the non-adherent pro-monocytic precursor cells to the adherent, mature (monocyte-) macrophage phenotypes) were implicitly different and likely affected by both cell adhesion and maturity states.
Activation of specific Rho GTPase proteins was detected on all polymer surfaces for the RAW 264.7 and J774A.1 cells, suggesting that while these proteins are important to cell behavior on polymer surfaces, differences in surface chemistry are not sufficient to differentially modulate GTPase activation in these cell types. The IC-21 activation profile was markedly different from either of the less mature monocyte-macrophage cell lines. However, as it is the most mature, biologically relevant cell line examined, it may possibly be the most sensitive to differential activation by surface chemistry. Overall, specific non-equivalences of different macrophage sources in expression and activation patterns of Rho signaling proteins on different surfaces are shown. These differences should be carefully considered for in vitro experiments attempting to probe or recapitulate inflammatory events in cells on surfaces. This would be particularly important to in vitro cell-based assays (e.g., for inflammatory drug screening) where such casual macrophage surface contact might induce cell activation, phenotypic changes and assay artifacts in this cell type typically considered non-attachment-dependent.
Accordingly, implant surfaces may be considered generally ‘activating’ to macrophages; differences in downstream signaling may relate only to the specific integrin subunits and other receptors expressed by different cell types and utilized in interactions with key ECM proteins adsorbed on different surface chemistries. Further effects of growth factors and cytokines relevant to FBGC formation at biomaterial implant surfaces on Rho GTPase expression and activation have not been explored in this context. Since these factors play a crucial role in cytoskeletal rearrangement, an obligatory step in cell fusion to FBGCs, they should be worthwhile targets for future investigation.
Acknowledgments
The authors acknowledge Dr. J. Bamburg, Dr. S. Summers (CSU) and Dr. A. García (Georgia Institute of Technology) for helpful technical guidance, Dr. J. zum Brunnen for assistance with statistical analysis and Dr. M. Gonzalez-Juarerro (CSU) for assistance with primary BMMO harvests. This work was supported by NIH grant EB 000894.
References
- 1.Van Aelst L, D’Souza-Schorey C. Genes Dev. 1997;11:2295. doi: 10.1101/gad.11.18.2295. [DOI] [PubMed] [Google Scholar]
- 2.Mackay DJ, Hall A. J Biol Chem. 1998;273:20685. doi: 10.1074/jbc.273.33.20685. [DOI] [PubMed] [Google Scholar]
- 3.Karnoub AE, Symons M, Campbell SL, Der CJ. Breast Cancer Res Treat. 2004;84:61. doi: 10.1023/B:BREA.0000018427.84929.5c. [DOI] [PubMed] [Google Scholar]
- 4.Dumontier M, Hocht P, Mintert U, Faix J. J Cell Sci. 2000;113:2253. doi: 10.1242/jcs.113.12.2253. [DOI] [PubMed] [Google Scholar]
- 5.Berrier AL, Martinez R, Bokoch GM, LaFlamme SE. J Cell Sci. 2002;115:4285. doi: 10.1242/jcs.00109. [DOI] [PubMed] [Google Scholar]
- 6.Ridley AJ, Hall A. Cell. 1992;70:389. doi: 10.1016/0092-8674(92)90163-7. [DOI] [PubMed] [Google Scholar]
- 7.Putnam AJ, Cunningham JJ, Pillemer BB, Mooney DJ. Am J Physiol Cell Physiol. 2003;284:C627. doi: 10.1152/ajpcell.00137.2002. [DOI] [PubMed] [Google Scholar]
- 8.Ruoslahti E, Obrink B. Exp Cell Res. 1996;227:1. doi: 10.1006/excr.1996.0243. [DOI] [PubMed] [Google Scholar]
- 9.Ridley AJ, Allen WE, Peppelenbosch M, Jones GE. Biochem Soc Symp. 1999;65:111. [PubMed] [Google Scholar]
- 10.Ridley AJ. FEBS Lett. 2001;498:168. doi: 10.1016/s0014-5793(01)02481-4. [DOI] [PubMed] [Google Scholar]
- 11.Leverrier Y, Ridley AJ. Curr Biol. 2001;11:195. doi: 10.1016/s0960-9822(01)00047-1. [DOI] [PubMed] [Google Scholar]
- 12.Patel JC, Hall A, Caron E. Methods Enzymol. 2000;325:462. doi: 10.1016/s0076-6879(00)25466-9. [DOI] [PubMed] [Google Scholar]
- 13.Anderson JM. Cardiovasc Pathol. 1993;2:33S. [Google Scholar]
- 14.McNally AK, Anderson JM. Am J Pathol. 2002;160:621. doi: 10.1016/s0002-9440(10)64882-1. [DOI] [PMC free article] [PubMed] [Google Scholar]
- 15.Godek ML, Duchsherer NL, McElwee Q, Grainger DW. Biomed Sci Instrum. 2004;40:7. [PubMed] [Google Scholar]
- 16.Tang L, Eaton JW. Mol Med. 1999;5:351. [PMC free article] [PubMed] [Google Scholar]
- 17.Kyriakides TR, Foster MJ, Keeney GE, Tsai A, Giachelli CM, Clark-Lewis I, Rollins BJ, Bornstein P. Am J Pathol. 2004;165:2157. doi: 10.1016/S0002-9440(10)63265-8. [DOI] [PMC free article] [PubMed] [Google Scholar]
- 18.Wittmann T, Waterman-Storer CM. J Cell Sci. 2001;114:3795. doi: 10.1242/jcs.114.21.3795. [DOI] [PubMed] [Google Scholar]
- 19.Lee DJ, Cox D, Li J, Greenberg S. J Biol Chem. 2000;275:141. doi: 10.1074/jbc.275.1.141. [DOI] [PubMed] [Google Scholar]
- 20.Nobes CD, Hall A. Cell. 1995;81:53. doi: 10.1016/0092-8674(95)90370-4. [DOI] [PubMed] [Google Scholar]
- 21.Caron E, Hall A. Science. 1998;282:1717. doi: 10.1126/science.282.5394.1717. [DOI] [PubMed] [Google Scholar]
- 22.Giannone G, Dubin-Thaler BJ, Dobereiner HG, Kieffer N, Bresnick AR, Sheetz MP. Cell. 2004;116:431. doi: 10.1016/s0092-8674(04)00058-3. [DOI] [PubMed] [Google Scholar]
- 23.Steen ML, Flory WC, Capps NE, Fisher ER. Chem Mater. 2001;13:2749. [Google Scholar]
- 24.Rhoades ER, Orme IM. Mech Ageing Dev. 1998;106:145. doi: 10.1016/s0047-6374(98)00113-4. [DOI] [PubMed] [Google Scholar]
- 25.Malkov G, Martin IT, Schwisow WB, Chandler JP, Fisher ER. Chem Mater. 2006 (submitted). [Google Scholar]
- 26.Koenig AL, Gambillara V, Grainger DW. J Biomed Mater Res A. 2003;64:20. doi: 10.1002/jbm.a.10316. [DOI] [PubMed] [Google Scholar]
- 27.Guruvenket S, Komath M, Vijayalakshmi SP, Raichur AM, Rao GM. J Appl Polym Sci. 2003;90:1618. [Google Scholar]
- 28.Ridley AJ, Hall A. Cold Spring Harbor Symp Quant Biol. 1992;57:661. doi: 10.1101/sqb.1992.057.01.072. [DOI] [PubMed] [Google Scholar]
- 29.Kossovsky N, Millett D, Juma S, Little N, Briggs PC, Raz S, Berg E. J Biomed Mater Res. 1991;25:1287. doi: 10.1002/jbm.820251009. [DOI] [PubMed] [Google Scholar]
- 30.Desai NP, Hubbell JA. Biomaterials. 1992;13:505. doi: 10.1016/0142-9612(92)90101-s. [DOI] [PubMed] [Google Scholar]
- 31.del Pozo MA, Price LS, Alderson NB, Ren XD, Schwartz MA. EMBO J. 2000;19:2008. doi: 10.1093/emboj/19.9.2008. [DOI] [PMC free article] [PubMed] [Google Scholar]
- 32.Ren XD, Kiosses WB, Schwartz MA. EMBO J. 1999;18:578. doi: 10.1093/emboj/18.3.578. [DOI] [PMC free article] [PubMed] [Google Scholar]
- 33.Arthur WT, Petch LA, Burridge K. Curr Biol. 2000;10:719. doi: 10.1016/s0960-9822(00)00537-6. [DOI] [PubMed] [Google Scholar]
- 34.Danen EH, Sonneveld P, Sonnenberg A, Yamada KM. J Cell Biol. 2000;151:1413. doi: 10.1083/jcb.151.7.1413. [DOI] [PMC free article] [PubMed] [Google Scholar]
- 35.Etienne-Manneville S, Hall A. Cell. 2001;106:489. doi: 10.1016/s0092-8674(01)00471-8. [DOI] [PubMed] [Google Scholar]
- 36.Price LS, Leng J, Schwartz MA, Bokoch GM. Mol Biol Cell. 1998;9:1863. doi: 10.1091/mbc.9.7.1863. [DOI] [PMC free article] [PubMed] [Google Scholar]
- 37.Miao H, Li S, Hu YL, Yuan S, Zhao Y, Chen BP, Puzon-McLaughlin W, Tarui T, Shyy JY, Takada Y, Usami S, Chien S. J Cell Sci. 2002;115:2199. doi: 10.1242/jcs.115.10.2199. [DOI] [PubMed] [Google Scholar]
- 38.Salsmann A, Schaffner-Reckinger E, Kieffer N. Eur J Cell Biol. 2006;85:249. doi: 10.1016/j.ejcb.2005.08.003. [DOI] [PubMed] [Google Scholar]
- 39.Hynes RO. Cell. 2002;110:673. doi: 10.1016/s0092-8674(02)00971-6. [DOI] [PubMed] [Google Scholar]
- 40.Larson RS, Springer TA. Immunol Rev. 1990;114:181. doi: 10.1111/j.1600-065x.1990.tb00565.x. [DOI] [PubMed] [Google Scholar]
- 41.Andrade JD, Hlady V. Ann NY Acad Sci. 1987;516:158. doi: 10.1111/j.1749-6632.1987.tb33038.x. [DOI] [PubMed] [Google Scholar]
- 42.Horbett TA. Surface Colloids B. 1994;2:225. [Google Scholar]
- 43.McClary KB, Grainger DW. Biomaterials. 1999;20:2435. doi: 10.1016/s0142-9612(99)00171-4. [DOI] [PubMed] [Google Scholar]
- 44.Hotchin NA, Hall A. J Cell Biol. 1995;131:1857. doi: 10.1083/jcb.131.6.1857. [DOI] [PMC free article] [PubMed] [Google Scholar]
- 45.Zalcman G, Closson V, Camonis J, Honore N, Rousseau-Merck MF, Tavitian A, Olofsson B. J Biol Chem. 1996;271:30366. doi: 10.1074/jbc.271.48.30366. [DOI] [PubMed] [Google Scholar]
- 46.Puto LA, Pestonjamasp K, King CC, Bokoch GM. J Biol Chem. 2003;278:9388. doi: 10.1074/jbc.M208414200. [DOI] [PubMed] [Google Scholar]
- 47.Kaibuchi K, Kuroda S, Fukata M, Nakagawa M. Curr Opin Cell Biol. 1999;11:591. doi: 10.1016/s0955-0674(99)00014-9. [DOI] [PubMed] [Google Scholar]