

Short abstract
A codon usage table for 32 nematode species is presented and suggests that total genomic GC content drives codon usage.
Abstract
Background
Codon usage has direct utility in molecular characterization of species and is also a marker for molecular evolution. To understand codon usage within the diverse phylum Nematoda, we analyzed a total of 265,494 expressed sequence tags (ESTs) from 30 nematode species. The full genomes of Caenorhabditis elegans and C. briggsae were also examined. A total of 25,871,325 codons were analyzed and a comprehensive codon usage table for all species was generated. This is the first codon usage table available for 24 of these organisms.
Results
Codon usage similarity in Nematoda usually persists over the breadth of a genus but then rapidly diminishes even within each clade. Globodera, Meloidogyne, Pristionchus, and Strongyloides have the most highly derived patterns of codon usage. The major factor affecting differences in codon usage between species is the coding sequence GC content, which varies in nematodes from 32% to 51%. Coding GC content (measured as GC3) also explains much of the observed variation in the effective number of codons (R = 0.70), which is a measure of codon bias, and it even accounts for differences in amino acid frequency. Codon usage is also affected by neighboring nucleotides (N1 context). Coding GC content correlates strongly with estimated noncoding genomic GC content (R = 0.92). On examining abundant clusters in five species, candidate optimal codons were identified that may be preferred in highly expressed transcripts.
Conclusion
Evolutionary models indicate that total genomic GC content, probably the product of directional mutation pressure, drives codon usage rather than the converse, a conclusion that is supported by examination of nematode genomes.
Background
Utilization of the degenerate triplet code for amino acid (AA) translation is neither uniform nor random. In particular, there are distinct patterns among different species and genes. Such patterns can readily be characterized by codon usage, namely the observed percentage occurrence with which each codon is used to encode a given AA. This measure has direct utility in molecular characterization of a species in that it enables efficient degenerate and nondegenerate primer design for cross-species gene cloning, open reading frame determination, and optimal protein expression [1]. Such tools are particularly important with respect to species for which limited molecular information exists. Codon usage also serves as an indicator of molecular evolution [2]. Codon usage bias, namely the degree to which usage departs from uniform use of all available codons for an AA, can be influenced by a number of evolutionary processes. The guanine and cytosine (GC) versus adenine and thymine (AT) composition of the species' genome, probably the product of directional mutation pressure [3,4], is a key driver of both codon usage and AA composition [5,6]. Other factors that influence codon usage may include the relative abundance of isoaccepting tRNAs [7-9], especially for highly expressed mRNAs that require translational efficiency [10,11], presence of mRNA secondary structure [12,13], and facilitation of correct co-translational protein folding [14]. Codon usage appears not to be optimized to minimize the impact of errors in translation and replication [15].
Nematodes are a highly abundant and diverse group of organisms that exploit niches from free-living microbivory to plant and animal parasitism. Molecular phylogenies divide nematodes into five major named and numbered clades within which parasitism has arisen multiple times [16]: Dorylaimia (clade I), Enoplia (clade II), Spirurina (clade III), Tylenchina (clade IV), and Rhabditina (clade V). Following the sequencing of the complete genome of the model nematode Caenorhabditis elegans [17], we have begun to catalog the molecular diversity of nematode genomes through the generation of over 250,000 expressed sequence tags (ESTs) from more than 30 nematode species (including 28 parasites) in four clades. Gene expression analyses for several medically and economically important parasites such as filarial, hookworm, and root knot nematode species have been completed [18-23] (for reviews [24,25]). Moreover, we recently conducted a meta-analysis of partial genomes across the whole phylum with a focus on the conservation and diversification of encoded protein families [26]. Project information is maintained on several online resources [27-30].
Now, in the most extensive such study yet performed for any phylum, we extend the above analyses with a comprehensive survey of observed codon usage and bias based on nearly 26 million codons in 32 species of the Nematoda. Because of its completed genome, C. elegans has been the primary species utilized in nematode codon usage studies [31-34]. Our findings provide more complete information for Caenorhabditis based on all 41,782 currently predicted proteins in C. elegans and C. briggsae [35]. Studies for other nematode species have been more limited. Codon usage has been tabulated for a number of parasitic nematodes including filarial species Brugia malayi, Onchocerca volvulus, Wucheria bancrofti, Acanthocheilonema viteae, Dirofilaria immitis [36-39], Strongyloides stercoralis [40], Ascaris suum [41], Ancylostoma caninum, and Necator americanus [42]. Although Fadiel and coworkers [39] used up to 60 genes per species, sample sizes in the other studies were quite small, typically fewer than 10 representative genes and 5,000 codons per species. In the present study we used an average of 2,350 genes and 270,000 codons per species for the 30 non-Caenorhabditis species. Our results provide the first codon usage tables for 24 of these organisms. Web available automated codon usage databases compiled from GenBank [43] lack almost all of this information because they rely only on full-length protein coding gene sequence submissions rather than the EST data used here.
In analyzing codon distribution in Nematoda, we describe how average usage varies between species and across the phylum. For instance, it has been shown that there is a level of conservation in codon distribution between 'closely' related nematodes such as Brugia malayi and B. pahangi [37] and Brugia and Onchocerca [38]. These relationships do not appear to extend over greater evolutionary distances, for instance between Onchocerca and Caenorhabditis [36]. The evolutionary distance at which conservation of codon usage diminishes has not previously been established [32]. Here we show that codon usage similarity in Nematoda is a relatively short-range phenomenon, generally persisting over the breadth of a genus but then rapidly diminishing within each clade. We also show that the major factor affecting differences in mean codon usage between distantly related species is the coding sequence GC as compared with AT content. GC content also explains much of the observed variation in the effective number of codons, a measure of codon bias, and even differences in AA frequency.
Results
Determination of codon usage patterns and amino acid composition
Extensive nucleotide sequence data are now available for many nematode species, largely because of recent progress using genomic approaches [25,44]. To obtain a better understanding of codon usage and AA composition within the phylum Nematoda, we analyzed a total of 265,494 EST sequences originating from 30 nematode species. The ESTs define 93,645 clusters or putative genes, with 208-9,511 clusters per species (Table 1) [26]. Table 1 also provides two letter codes for the nematode species used throughout the remainder of the report. We used prot4EST, a translation prediction pipeline optimized for EST datasets [45], to generate protein predictions. To reduce noise derived from poor translations, our analysis considered only the longest open reading frame (ORF) translations with strong supporting evidence in the form of similarity to known or predicted proteins (BLASTX cutoff 1 × e-8) and retained only the polypeptide aligned portion of the nucleotide sequence. About 75% of the clusters met these criteria, yielding 8,080,057 codons originating from species other than Caenorhabditis, and 25,871,325 total codons from all 32 species including available predictions from C. elegans and C. briggsae. The 18 AA residues with redundant codons gave a total of (18) × C32,2 = 496 comparisons of codon usage between species. Comprehensive tables of AA composition (Tables 2 and 3) and codon usage (Table 4) for all 32 Nematoda species studied are provided. Below we use these tables to examine, first, variation in AA composition and its relationship to GC content and, second, codon usage and its relationship to GC content.
Table 1.
Summary of sequences used by nematode species
| Clade | Code | Species | ESTs | Total number of clusters | Clusters or genes used | Codons | GC content (%) | |
|---|---|---|---|---|---|---|---|---|
| n | % | |||||||
| V | NA | Necator americanusa | 4,766 | 2,294 | 1,784 | 78 | 192,756 | 46 |
| AC | Ancylostoma caninumb | 9,079 | 4,203 | 3,207 | 76 | 305,036 | 48 | |
| AY | Ancylostoma ceylanicumb | 10,544 | 3,485 | 2,814 | 81 | 387,372 | 49 | |
| NB | Nippostrongylus brasiliensisb | 1,234 | 742 | 630 | 85 | 75,934 | 50 | |
| HC | Haemonchus contortusb | 17,268 | 4,146 | 4,102 | 99 | 584,513 | 47 | |
| OO | Ostertagia ostertagib | 6,670 | 2,355 | 1,961 | 83 | 222,616 | 48 | |
| TD | Teladorsagia circumcinctab | 4,313 | 1,655 | 1,616 | 98 | 194,351 | 48 | |
| CE | Caenorhabditis elegansc | - | - | 22,254 | 100 | 9,784,215 | 43 | |
| CB | Caenorhabditis briggsaec | - | - | 19,528 | 100 | 8,007,053 | 44 | |
| PP | Pristionchus pacificusc | 8,672 | 3,690 | 2,597 | 70 | 297,605 | 51 | |
| IVa | SS | Strongyloides stercoralisa | 11,236 | 3,635 | 2,803 | 77 | 367,308 | 33 |
| SR | Strongyloides rattib | 9,932 | 3,264 | 2,682 | 82 | 320,874 | 32 | |
| PT | Parastrongyloides trichosurib | 7,712 | 3,086 | 2,457 | 80 | 284,785 | 40 | |
| IVb | PE | Pratylenchus penetransd | 1,908 | 408 | 338 | 83 | 45,802 | 46 |
| GP | Globodera pallidad | 1,317 | 977 | 479 | 49 | 65,699 | 51 | |
| GR | Globodera rostochiensisd | 5,905 | 2,851 | 2,192 | 77 | 290,614 | 51 | |
| HG | Heterodera glycinesd | 18,524 | 7,198 | 5,564 | 77 | 742,990 | 50 | |
| MI | Meloidogyne incognitad | 12,394 | 4,408 | 3,214 | 73 | 366,435 | 37 | |
| MJ | Meloidogyne javanicad | 5,282 | 2,609 | 2,086 | 80 | 203,135 | 36 | |
| MA | Meloidogyne arenariad | 3,251 | 1,892 | 1,483 | 78 | 176,816 | 36 | |
| MH | Meloidogyne haplad | 13,462 | 4,479 | 3,507 | 78 | 407,985 | 36 | |
| MC | Meloidogyne chitwoodid | 7,036 | 2,409 | 1,906 | 79 | 205,612 | 35 | |
| ZP | Zeldia punctatac | 388 | 208 | 102 | 49 | 16,723 | 43 | |
| III | AS | Ascaris suumb | 38,944 | 8,482 | 5,830 | 69 | 646,740 | 46 |
| AL | Ascaris lumbricoidesa | 1,822 | 853 | 508 | 60 | 42,919 | 47 | |
| TC | Toxocara canisb | 4,206 | 1,447 | 866 | 60 | 103,065 | 48 | |
| BM | Brugia malayia | 25,067 | 9,511 | 6,483 | 68 | 561,296 | 39 | |
| DI | Dirofiliaria immitisb | 3,585 | 1,747 | 1,380 | 79 | 126,880 | 38 | |
| OV | Onchocerca volvulusa | 14,922 | 5,097 | 2,914 | 57 | 299,336 | 40 | |
| I | TS | Trichinella spiralisa | 10,384 | 3,680 | 2,693 | 73 | 290,794 | 41 |
| TM | Trichuris murisb | 2,713 | 1,577 | 1,179 | 75 | 147,995 | 49 | |
| TV | Trichuris vulpisb | 2,958 | 1,257 | 1,000 | 80 | 106,071 | 48 | |
aHuman parasite, banimal parasite, cfree-living, and dplant parasite. EST, expressed sequence tag.
Table 2.
Amino acid composition (%) of translations by nematode species
| Clade | Species | Amino acid | |||||||||||||||||||
|---|---|---|---|---|---|---|---|---|---|---|---|---|---|---|---|---|---|---|---|---|---|
| A | C | D | E | F | G | H | I | K | L | M | N | P | Q | R | S | T | V | W | Y | ||
| Ala | Cys | Asp | Glu | Phe | Gly | His | Ile | Lys | Leu | Met | Asn | Pro | Gln | Arg | Ser | Thr | Val | Typ | Tyr | ||
| V | NA | 6.9 | 2.4 | 5.2 | 6.2 | 4.7 | 6.3 | 2.5 | 5.5 | 6.5 | 8.6 | 2.6 | 4.2 | 5.0 | 3.7 | 6.2 | 7.2 | 5.3 | 6.5 | 1.2 | 3.3 |
| AC | 7.0 | 2.4 | 5.0 | 6.0 | 4.7 | 5.9 | 2.7 | 5.6 | 6.3 | 8.9 | 2.8 | 4.2 | 4.6 | 3.7 | 6.2 | 7.4 | 5.4 | 6.6 | 1.3 | 3.3 | |
| AY | 7.6 | 2.2 | 5.5 | 6.6 | 4.2 | 6.5 | 2.5 | 5.2 | 6.4 | 8.5 | 2.5 | 4.0 | 5.1 | 3.8 | 6.1 | 7.1 | 5.3 | 6.7 | 1.2 | 3.0 | |
| NB | 7.8 | 2.2 | 5.4 | 6.3 | 4.0 | 6.9 | 2.4 | 5.0 | 7.2 | 8.1 | 2.6 | 4.0 | 4.9 | 3.5 | 6.4 | 7.0 | 5.2 | 6.9 | 1.1 | 3.1 | |
| HC | 7.4 | 2.3 | 5.5 | 6.5 | 4.3 | 6.6 | 2.5 | 5.4 | 7.0 | 8.4 | 2.5 | 4.1 | 4.9 | 3.7 | 6.0 | 6.4 | 5.2 | 6.8 | 1.2 | 3.4 | |
| OO | 7.2 | 2.3 | 5.3 | 6.3 | 4.4 | 6.7 | 2.6 | 5.3 | 6.7 | 8.4 | 2.6 | 4.0 | 5.2 | 3.8 | 6.1 | 6.8 | 5.3 | 6.7 | 1.1 | 3.1 | |
| TD | 7.5 | 2.7 | 5.2 | 6.1 | 4.3 | 6.7 | 2.6 | 5.0 | 6.6 | 8.4 | 2.7 | 4.2 | 5.1 | 3.8 | 5.8 | 7.1 | 5.3 | 6.5 | 1.2 | 3.3 | |
| CE | 6.3 | 2.0 | 5.3 | 6.5 | 4.8 | 5.4 | 2.3 | 6.1 | 6.4 | 8.6 | 2.6 | 4.9 | 4.9 | 4.2 | 5.2 | 8.1 | 5.9 | 6.2 | 1.1 | 3.1 | |
| CB | 6.3 | 2.0 | 5.3 | 6.8 | 4.7 | 5.4 | 2.3 | 6.0 | 6.4 | 8.5 | 2.6 | 4.8 | 5.0 | 4.2 | 5.4 | 8.0 | 5.8 | 6.1 | 1.1 | 3.1 | |
| PP | 7.4 | 1.9 | 5.4 | 6.9 | 4.0 | 6.6 | 2.5 | 5.3 | 6.6 | 8.4 | 2.6 | 3.9 | 5.1 | 3.4 | 6.4 | 7.6 | 5.4 | 6.4 | 1.2 | 3.0 | |
| IVa | SS | 5.5 | 1.9 | 5.7 | 7.0 | 4.3 | 6.0 | 2.1 | 7.1 | 8.0 | 8.3 | 2.3 | 6.0 | 4.5 | 3.7 | 4.6 | 7.2 | 5.5 | 5.8 | 1.0 | 3.5 |
| SR | 5.4 | 2.0 | 5.4 | 6.5 | 4.7 | 5.9 | 2.1 | 7.4 | 8.1 | 8.6 | 2.4 | 6.2 | 4.3 | 3.6 | 4.3 | 7.2 | 5.4 | 5.8 | 1.0 | 3.8 | |
| PT | 6.3 | 2.0 | 5.3 | 6.3 | 4.6 | 6.3 | 2.4 | 6.6 | 8.1 | 8.3 | 2.4 | 5.3 | 4.3 | 3.5 | 4.9 | 6.9 | 5.5 | 6.1 | 1.0 | 3.7 | |
| IVb | PE | 6.9 | 2.0 | 5.3 | 6.7 | 4.3 | 7.0 | 2.4 | 5.8 | 7.6 | 8.4 | 2.6 | 4.5 | 4.5 | 4.5 | 6.2 | 6.4 | 4.9 | 5.9 | 1.2 | 2.9 |
| GP | 6.8 | 2.4 | 4.5 | 5.4 | 5.6 | 7.2 | 2.4 | 4.9 | 7.1 | 9.1 | 2.3 | 3.9 | 5.8 | 3.8 | 6.7 | 7.1 | 4.8 | 6.0 | 1.2 | 2.9 | |
| GR | 7.4 | 2.1 | 4.9 | 6.0 | 4.8 | 6.5 | 2.6 | 5.2 | 5.9 | 9.3 | 2.5 | 4.3 | 5.0 | 4.4 | 6.5 | 7.2 | 5.2 | 6.3 | 1.2 | 2.7 | |
| HG | 7.3 | 2.2 | 4.9 | 6.2 | 5.1 | 6.3 | 2.6 | 5.2 | 6.0 | 9.2 | 2.4 | 4.5 | 5.0 | 4.5 | 6.3 | 7.3 | 5.1 | 6.2 | 1.2 | 2.5 | |
| MI | 5.7 | 2.0 | 4.8 | 6.7 | 5.1 | 5.6 | 2.2 | 6.5 | 7.3 | 9.4 | 2.3 | 5.6 | 4.5 | 4.6 | 5.3 | 7.5 | 5.2 | 5.4 | 1.1 | 3.0 | |
| MJ | 5.5 | 2.1 | 4.8 | 6.6 | 5.5 | 5.4 | 2.2 | 6.9 | 7.8 | 9.6 | 2.4 | 5.6 | 4.2 | 4.2 | 5.4 | 7.0 | 5.1 | 5.4 | 1.1 | 3.3 | |
| MA | 5.7 | 2.0 | 5.0 | 6.9 | 5.3 | 5.7 | 2.2 | 6.9 | 7.3 | 9.7 | 2.3 | 5.5 | 4.1 | 4.3 | 5.2 | 7.0 | 5.0 | 5.6 | 1.1 | 3.2 | |
| MH | 5.6 | 2.0 | 4.9 | 6.8 | 5.3 | 5.6 | 2.2 | 7.0 | 7.3 | 9.5 | 2.3 | 5.8 | 4.3 | 4.3 | 5.2 | 7.3 | 4.9 | 5.4 | 1.2 | 3.2 | |
| MC | 5.3 | 2.3 | 4.8 | 6.4 | 5.5 | 5.5 | 2.3 | 7.4 | 7.4 | 9.7 | 2.3 | 6.0 | 4.0 | 4.3 | 4.9 | 7.4 | 5.0 | 5.2 | 1.1 | 3.3 | |
| ZP | 7.6 | 1.5 | 5.2 | 6.2 | 4.2 | 7.1 | 2.5 | 6.1 | 7.9 | 8.4 | 1.8 | 4.7 | 4.6 | 3.8 | 6.0 | 5.4 | 5.5 | 6.6 | 1.1 | 3.7 | |
| III | AS | 7.0 | 2.5 | 4.9 | 6.1 | 4.6 | 5.8 | 2.5 | 6.0 | 6.3 | 8.7 | 2.6 | 4.5 | 4.8 | 3.6 | 6.3 | 7.5 | 5.3 | 6.6 | 1.2 | 3.3 |
| AL | 7.3 | 2.6 | 4.6 | 5.8 | 4.9 | 6.1 | 2.5 | 6.0 | 6.4 | 8.3 | 2.5 | 4.3 | 5.3 | 3.5 | 6.2 | 7.4 | 5.2 | 6.5 | 1.2 | 3.4 | |
| TC | 7.3 | 2.8 | 5.0 | 6.0 | 4.2 | 6.8 | 2.6 | 5.3 | 7.3 | 8.0 | 2.4 | 4.1 | 5.4 | 3.5 | 6.2 | 6.7 | 5.6 | 6.4 | 1.2 | 3.2 | |
| BM | 5.6 | 2.5 | 4.6 | 5.6 | 5.4 | 5.0 | 2.6 | 7.1 | 6.8 | 9.6 | 2.8 | 5.0 | 4.1 | 3.8 | 5.6 | 7.8 | 5.3 | 5.9 | 1.1 | 3.6 | |
| DI | 5.6 | 2.4 | 4.9 | 6.0 | 5.2 | 4.7 | 2.7 | 7.5 | 7.0 | 9.5 | 2.7 | 5.2 | 3.9 | 3.8 | 5.9 | 7.5 | 5.1 | 5.8 | 1.1 | 3.8 | |
| OV | 6.0 | 2.2 | 5.0 | 6.1 | 4.9 | 5.6 | 2.5 | 6.9 | 7.1 | 8.9 | 2.7 | 4.9 | 4.5 | 3.9 | 5.9 | 7.3 | 5.2 | 5.7 | 1.2 | 3.5 | |
| I | TS | 6.2 | 2.6 | 5.0 | 6.2 | 5.1 | 5.1 | 2.5 | 6.1 | 6.6 | 9.5 | 2.6 | 4.9 | 4.1 | 3.9 | 5.6 | 7.6 | 5.1 | 6.5 | 1.2 | 3.4 |
| TM | 7.1 | 3.0 | 5.0 | 6.0 | 4.5 | 6.5 | 2.5 | 5.0 | 6.3 | 8.9 | 2.6 | 4.0 | 5.0 | 3.8 | 6.2 | 7.4 | 5.2 | 6.7 | 1.2 | 3.2 | |
| TV | 7.0 | 3.0 | 4.9 | 6.1 | 4.5 | 5.8 | 2.5 | 5.1 | 6.4 | 9.0 | 2.6 | 4.2 | 4.8 | 3.8 | 6.1 | 7.5 | 5.5 | 6.8 | 1.3 | 3.2 | |
Definitions of species two letter codes are provided in Table 1.
Table 3.
Amino acid composition (%) of translations from Nematoda and four reference species
| Amino acid | Nematode | HS | DM | SC | EC | ||
|---|---|---|---|---|---|---|---|
| Mean | SD | ||||||
| A | Ala | 6.6 | 0.8 | 7.1 | 7.5 | 5.6 | 9.2 |
| C | Cys | 2.3 | 0.3 | 2.3 | 1.9 | 1.3 | 1.1 |
| D | Asp | 5.1 | 0.3 | 4.8 | 5.2 | 5.8 | 5.2 |
| E | Glu | 6.3 | 0.4 | 6.9 | 6.4 | 6.5 | 5.7 |
| F | Phe | 4.7 | 0.5 | 3.8 | 3.5 | 4.4 | 3.8 |
| G | Gly | 6.1 | 0.7 | 6.6 | 6.3 | 5.1 | 7.3 |
| H | His | 2.4 | 0.2 | 2.6 | 2.7 | 2.2 | 2.2 |
| I | Ile | 6.0 | 0.8 | 4.4 | 4.9 | 6.5 | 6.0 |
| K | Lys | 6.9 | 0.6 | 5.6 | 5.6 | 7.3 | 4.8 |
| L | Leu | 8.8 | 0.5 | 10.0 | 9.0 | 9.5 | 10.1 |
| M | Met | 2.5 | 0.2 | 2.2 | 2.4 | 2.1 | 2.6 |
| N | Asn | 4.7 | 0.7 | 3.6 | 4.7 | 6.1 | 4.3 |
| P | Pro | 4.7 | 0.5 | 6.1 | 5.5 | 4.4 | 4.2 |
| Q | Gln | 3.9 | 0.3 | 4.7 | 5.2 | 4.0 | 4.3 |
| R | Arg | 5.8 | 0.6 | 5.7 | 5.5 | 4.4 | 5.5 |
| S | Ser | 7.2 | 0.5 | 8.1 | 8.3 | 8.9 | 6.4 |
| T | Thr | 5.3 | 0.2 | 5.3 | 5.7 | 5.9 | 5.7 |
| V | Val | 6.2 | 0.5 | 6.1 | 5.9 | 5.6 | 7.0 |
| W | Typ | 1.2 | 0.1 | 1.3 | 1.0 | 1.0 | 1.4 |
| Y | Tyr | 3.2 | 0.3 | 2.8 | 2.9 | 3.4 | 3.0 |
DM, Drosophila melanogaster; EC, Escherichia coli; HS, Homo sapiens; SC, Saccharomyces cerevisiae.
Table 4.
Codon usage of translations by nematode species
| Species (codons [n]) | ||||||||||||||||||
|---|---|---|---|---|---|---|---|---|---|---|---|---|---|---|---|---|---|---|
| AA | Codon | NA (192,756) | AC (305,036) | AY (387,372) | NB (75,934) | HC (584,513) | OO (222,616) | TD (194,351) | CE (9,784,215) | CB (8,007,053) | PP (297,605) | SS (367,308) | SR (320,875) | PT (284,785) | PE (45,802) | GP (65,699) | GR (290,614) | |
| A | Ala | GCA | 28.8 | 25.0 | 23.9 | 19.7 | 26.0 | 24.9 | 25.4 | 31.5 | 26.1 | 20.7 | 33.2 | 31.4 | 24.2 | 31.4 | 20.4 | 22.1 |
| A | Ala | GCC | 18.5 | 23.0 | 24.2 | 30.0 | 22.8 | 23.4 | 24.0 | 19.9 | 22.7 | 32.4 | 9.1 | 9.7 | 23.4 | 29.5 | 31.9 | 32.6 |
| A | Ala | GCG | 16.0 | 17.7 | 17.3 | 17.6 | 13.6 | 16.3 | 16.6 | 13.1 | 15.2 | 16.7 | 2.0 | 1.6 | 7.1 | 13.2 | 26.7 | 27.3 |
| A | Ala | GCT | 36.7 | 34.2 | 34.6 | 32.7 | 37.6 | 35.4 | 34.0 | 35.5 | 35.9 | 30.2 | 55.7 | 57.4 | 45.3 | 25.9 | 20.9 | 18.1 |
| Codons per AA | 13,237 | 21,208 | 29,600 | 5,916 | 43,104 | 16,126 | 14,513 | 618,499 | 502,187 | 22,118 | 20,285 | 17,201 | 17,930 | 3,173 | 4,494 | 21,522 | ||
| C | Cys | TGT | 54.0 | 46.9 | 44.4 | 39.5 | 46.7 | 49.0 | 44.3 | 55.3 | 56.9 | 39.2 | 84.4 | 85.3 | 63.9 | 42.6 | 42.1 | 43.7 |
| C | Cys | TGC | 46.0 | 53.1 | 55.6 | 60.5 | 53.3 | 51.0 | 55.7 | 44.7 | 43.1 | 60.8 | 15.6 | 14.7 | 36.1 | 57.4 | 57.9 | 56.3 |
| Codons per AA | 4,538 | 7,295 | 8,510 | 1,702 | 13,213 | 5,109 | 5,154 | 196,660 | 159,737 | 5,789 | 6,996 | 6,285 | 5,682 | 925 | 1,584 | 6,219 | ||
| D | Asp | GAC | 40.5 | 46.8 | 47.4 | 48.5 | 40.8 | 45.1 | 45.4 | 32.4 | 35.6 | 43.0 | 13.5 | 12.7 | 29.1 | 39.1 | 61.8 | 63.8 |
| D | Asp | GAT | 59.5 | 53.2 | 52.6 | 51.5 | 59.2 | 54.9 | 54.6 | 67.6 | 64.4 | 57.0 | 86.5 | 87.3 | 70.9 | 60.9 | 38.2 | 36.2 |
| Codons per AA | 9,934 | 15,229 | 21,124 | 4,117 | 32,318 | 11,797 | 10,014 | 520,465 | 423,125 | 16,048 | 20,825 | 17476 | 15,182 | 2,448 | 2,930 | 14,122 | ||
| E | Glu | GAA | 58.8 | 52.0 | 49.5 | 46.3 | 57.9 | 56.8 | 55.3 | 62.5 | 59.1 | 37.7 | 80.4 | 84.6 | 65.3 | 60.4 | 50.2 | 49.7 |
| E | Glu | GAG | 41.2 | 48.0 | 50.5 | 53.7 | 42.1 | 43.2 | 44.7 | 37.5 | 40.9 | 62.3 | 19.6 | 15.4 | 34.7 | 39.6 | 49.8 | 50.3 |
| Codons per AA | 11,865 | 18,355 | 25,474 | 4,774 | 38,175 | 14,008 | 11,873 | 638,649 | 543,774 | 20,537 | 25,838 | 20,812 | 18,057 | 3,075 | 3,570 | 17,574 | ||
| F | Phe | TTC | 56.4 | 61.0 | 67.7 | 72.3 | 63.7 | 63.5 | 63.9 | 50.5 | 58.6 | 81.9 | 17.8 | 17.7 | 41.5 | 52.8 | 43.3 | 50.0 |
| F | Phe | TTT | 43.6 | 39.0 | 32.3 | 27.7 | 36.3 | 36.5 | 36.1 | 49.5 | 41.4 | 18.1 | 82.2 | 82.3 | 58.5 | 47.2 | 56.7 | 50.0 |
| Codons per AA | 8,977 | 14,376 | 16,102 | 3,031 | 24,881 | 9,726 | 8,311 | 464,354 | 373,697 | 12,020 | 15,752 | 15,138 | 13,032 | 1,966 | 3,650 | 14,036 | ||
| G | Gly | GGA | 42.7 | 39.5 | 39.7 | 41.4 | 40.4 | 40.0 | 40.9 | 58.7 | 60.7 | 55.6 | 50.1 | 51.2 | 52.3 | 35.1 | 26.9 | 24.8 |
| G | Gly | GGC | 17.8 | 23.3 | 23.5 | 24.1 | 20.9 | 22.5 | 22.5 | 12.5 | 12.1 | 20.6 | 4.3 | 3.1 | 10.5 | 29.7 | 34.9 | 41.8 |
| G | Gly | GGG | 10.1 | 10.0 | 9.5 | 5.9 | 9.7 | 8.8 | 8.4 | 8.3 | 8.4 | 6.9 | 5.9 | 3.9 | 6.8 | 11.7 | 20.6 | 17.5 |
| G | Gly | GGT | 29.4 | 27.2 | 27.3 | 28.6 | 29.0 | 28.8 | 28.2 | 20.5 | 18.8 | 16.9 | 39.8 | 41.8 | 30.4 | 23.5 | 17.6 | 15.9 |
| Codons per AA | 12,228 | 18,073 | 25,292 | 5,264 | 38,407 | 14,914 | 13,068 | 524,163 | 433,832 | 19,759 | 22,207 | 18,910 | 18,057 | 3,189 | 4,741 | 18,802 | ||
| H | His | CAC | 43.1 | 48.8 | 51.9 | 55.5 | 43.5 | 46.8 | 45.9 | 39.5 | 39.7 | 53.5 | 15.7 | 16.2 | 35.7 | 37.2 | 50.5 | 52.6 |
| H | His | CAT | 56.9 | 51.2 | 48.1 | 44.5 | 56.5 | 53.2 | 54.1 | 60.5 | 60.3 | 46.5 | 84.3 | 83.8 | 64.3 | 62.8 | 49.5 | 47.4 |
| Codons per AA | 4,853 | 8,224 | 9,726 | 1,835 | 14,460 | 5,779 | 4,965 | 226,949 | 183,283 | 7,363 | 7,664 | 6,679 | 6,789 | 1,086 | 1,589 | 7,500 | ||
| I | Ile | ATA | 21.9 | 20.1 | 16.9 | 14.4 | 19.6 | 19.5 | 18.5 | 15.6 | 13.4 | 10.5 | 30.2 | 30.3 | 24.3 | 16.0 | 15.0 | 11.5 |
| I | Ile | ATC | 35.1 | 41.2 | 46.0 | 49.6 | 39.9 | 41.4 | 42.2 | 31.2 | 39.2 | 57.4 | 9.1 | 9.2 | 27.0 | 33.1 | 36.9 | 37.1 |
| I | Ile | ATT | 43.0 | 38.7 | 37.2 | 36.0 | 40.5 | 39.2 | 39.3 | 53.3 | 47.4 | 32.2 | 60.7 | 60.6 | 48.7 | 50.9 | 48.1 | 51.4 |
| Codons per AA | 10,621 | 17,171 | 20,026 | 3,808 | 31,585 | 11,807 | 9,787 | 596,151 | 477,819 | 15,856 | 26,077 | 23,850 | 18,935 | 2,659 | 3,216 | 15,144 | ||
| K | Lys | AAA | 50.2 | 44.1 | 39.5 | 36.1 | 47.5 | 48.5 | 45.0 | 59.3 | 57.9 | 24.2 | 80.4 | 82.4 | 56.7 | 55.5 | 58.9 | 53.3 |
| K | Lys | AAG | 49.8 | 55.9 | 60.5 | 63.9 | 52.5 | 51.5 | 55.0 | 40.7 | 42.1 | 75.8 | 19.6 | 17.6 | 43.3 | 44.5 | 41.1 | 46.7 |
| Codons per AA | 12,606 | 19,080 | 24,922 | 5,451 | 41,187 | 14,926 | 12,874 | 622,428 | 511,710 | 19,693 | 29,246 | 25,932 | 23,023 | 3,465 | 4,650 | 17,224 | ||
| L | Leu | CTA | 11.8 | 10.7 | 9.7 | 9.0 | 10.2 | 10.9 | 9.8 | 9.2 | 9.9 | 7.3 | 6.2 | 5.5 | 5.5 | 7.4 | 4.4 | 3.6 |
| L | Leu | CTC | 17.2 | 19.5 | 21.1 | 22.8 | 18.6 | 20.0 | 20.7 | 17.3 | 18.8 | 36.9 | 3.4 | 3.5 | 15.2 | 15.0 | 18.4 | 16.0 |
| L | Leu | CTG | 16.1 | 21.6 | 23.5 | 24.6 | 18.8 | 19.5 | 20.5 | 14.1 | 16.0 | 20.1 | 1.7 | 1.5 | 9.3 | 17.4 | 21.8 | 25.2 |
| L | Leu | CTT | 23.1 | 19.6 | 20.2 | 18.9 | 22.7 | 21.2 | 21.8 | 24.6 | 21.1 | 18.4 | 30.9 | 30.5 | 24.8 | 20.6 | 19.3 | 17.4 |
| L | Leu | TTA | 12.5 | 9.6 | 7.2 | 6.2 | 9.9 | 8.8 | 7.7 | 11.4 | 9.0 | 4.8 | 45.8 | 46.6 | 29.4 | 11.3 | 8.6 | 6.1 |
| L | Leu | TTG | 19.3 | 19.0 | 18.3 | 18.4 | 19.9 | 19.7 | 19.5 | 23.3 | 25.2 | 12.5 | 12.0 | 12.3 | 15.8 | 28.3 | 27.5 | 31.7 |
| Codons per AA | 16,664 | 27,074 | 32,761 | 6,176 | 49,075 | 18,693 | 16,399 | 841,631 | 680,113 | 25,061 | 30,422 | 27,556 | 23,764 | 3,828 | 6,003 | 27,096 | ||
| M | Met | ATG | 100.0 | 100.0 | 100.0 | 100.0 | 100.0 | 100.0 | 100.0 | 100.0 | 100.0 | 100.0 | 100.0 | 100.0 | 100.0 | 100.0 | 100.0 | 100.0 |
| Codons per AA | 5,102 | 8,525 | 9,696 | 1,943 | 14,531 | 5,794 | 5,165 | 255,677 | 209,897 | 7,598 | 8,490 | 7,569 | 6,725 | 1,189 | 1,489 | 7,131 | ||
| N | Asn | AAC | 48.0 | 52.3 | 53.9 | 58.0 | 46.9 | 48.9 | 50.7 | 37.8 | 42.2 | 49.7 | 13.3 | 13.7 | 31.5 | 35.9 | 53.0 | 53.7 |
| N | Asn | AAT | 52.0 | 47.7 | 46.1 | 42.0 | 53.1 | 51.1 | 49.3 | 62.2 | 57.8 | 50.3 | 86.7 | 86.3 | 68.5 | 64.1 | 47.0 | 46.3 |
| Codons per AA | 8,173 | 12,784 | 15,647 | 3,003 | 24,165 | 9,013 | 8,111 | 477,965 | 383,675 | 11,638 | 21,928 | 19,815 | 15,025 | 2,073 | 2,589 | 12,490 | ||
| P | Pro | CCA | 35.0 | 35.0 | 33.6 | 31.2 | 34.6 | 35.7 | 35.1 | 52.8 | 53.1 | 15.3 | 66.2 | 66.5 | 48.2 | 44.0 | 20.0 | 22.5 |
| P | Pro | CCC | 14.0 | 15.9 | 16.5 | 16.7 | 15.8 | 15.0 | 14.5 | 9.1 | 10.3 | 38.3 | 3.7 | 3.2 | 17.3 | 16.2 | 28.1 | 23.4 |
| P | Pro | CCG | 20.0 | 21.8 | 23.1 | 28.4 | 19.5 | 20.9 | 22.0 | 19.8 | 19.1 | 17.7 | 2.4 | 2.1 | 8.5 | 19.9 | 33.0 | 39.1 |
| P | Pro | CCT | 31.0 | 27.3 | 26.8 | 23.7 | 30.0 | 28.5 | 28.4 | 18.2 | 17.5 | 28.6 | 27.7 | 28.2 | 26.0 | 19.9 | 18.9 | 15.1 |
| Codons per AA | 9,552 | 14,020 | 19,732 | 3,711 | 28,449 | 11,512 | 9,972 | 481,470 | 403,504 | 15,120 | 16,634 | 13,870 | 12,379 | 2,068 | 3,838 | 14,519 | ||
| Q | Gln | CAA | 56.3 | 48.9 | 45.4 | 42.6 | 52.6 | 52.7 | 52.3 | 65.6 | 63.3 | 37.3 | 89.1 | 88.4 | 69.6 | 62.9 | 52.8 | 52.7 |
| Q | Gln | CAG | 43.7 | 51.1 | 54.6 | 57.4 | 47.4 | 47.3 | 47.7 | 34.4 | 36.7 | 62.7 | 10.9 | 11.6 | 30.4 | 37.1 | 47.2 | 47.3 |
| Codons per AA | 7,217 | 11,341 | 14,843 | 2,691 | 21,339 | 8,424 | 7,339 | 405,452 | 332,326 | 10,116 | 13,651 | 11,696 | 10,098 | 2,058 | 2,515 | 12,900 | ||
| R | Arg | AGA | 20.8 | 18.7 | 17.1 | 19.3 | 18.6 | 18.4 | 19.8 | 29.4 | 31.8 | 30.6 | 50.6 | 52.2 | 39.1 | 13.9 | 12.8 | 10.7 |
| R | Arg | CGA | 23.0 | 21.9 | 21.5 | 20.7 | 21.3 | 23.2 | 21.4 | 22.9 | 22.0 | 16.4 | 6.8 | 6.3 | 8.3 | 20.4 | 14.3 | 17.9 |
| R | Arg | AGG | 11.7 | 13.3 | 13.8 | 10.5 | 12.5 | 12.0 | 12.4 | 7.4 | 8.1 | 9.8 | 9.8 | 6.9 | 9.3 | 10.2 | 10.3 | 8.9 |
| R | Arg | CGC | 13.9 | 16.3 | 17.3 | 18.2 | 14.0 | 15.0 | 14.7 | 9.9 | 10.0 | 16.2 | 3.3 | 3.5 | 12.3 | 19.9 | 26.3 | 25.1 |
| R | Arg | CGG | 8.0 | 9.1 | 8.9 | 7.9 | 8.5 | 9.0 | 8.4 | 8.9 | 8.3 | 5.9 | 1.7 | 1.3 | 3.5 | 10.9 | 17.2 | 17.3 |
| R | Arg | CGT | 22.6 | 20.7 | 21.3 | 23.5 | 25.0 | 22.4 | 23.2 | 21.6 | 19.8 | 21.1 | 27.8 | 29.8 | 27.5 | 24.7 | 19.1 | 20.2 |
| Codons per AA | 11,856 | 19,042 | 23,683 | 4,857 | 35,121 | 13,588 | 11,363 | 511,021 | 432,791 | 19,008 | 17,062 | 13,744 | 14,051 | 2,840 | 4,378 | 18,826 | ||
| S | Ser | AGC | 14.0 | 16.4 | 16.6 | 18.0 | 14.6 | 14.7 | 16.2 | 10.3 | 9.8 | 9.8 | 3.1 | 2.6 | 7.7 | 15.5 | 17.8 | 17.5 |
| S | Ser | TCA | 21.3 | 19.6 | 18.1 | 16.4 | 21.1 | 21.4 | 19.7 | 25.5 | 20.4 | 14.8 | 36.6 | 37.6 | 27.8 | 24.1 | 13.5 | 13.8 |
| S | Ser | TCC | 13.6 | 15.6 | 16.2 | 16.3 | 14.0 | 14.6 | 14.7 | 13.2 | 16.0 | 20.7 | 5.2 | 4.1 | 13.2 | 16.9 | 20.7 | 21.0 |
| S | Ser | AGT | 14.8 | 13.4 | 12.6 | 11.8 | 14.3 | 13.4 | 14.0 | 15.0 | 14.4 | 10.4 | 23.8 | 21.7 | 17.5 | 12.9 | 11.6 | 11.9 |
| S | Ser | TCG | 16.6 | 16.8 | 18.6 | 22.2 | 16.9 | 18.2 | 17.6 | 15.1 | 16.7 | 21.4 | 2.2 | 2.0 | 8.0 | 14.3 | 20.3 | 22.7 |
| S | Ser | TCT | 19.7 | 18.1 | 18.0 | 15.5 | 19.1 | 17.7 | 17.8 | 20.8 | 22.7 | 22.9 | 29.2 | 31.9 | 25.8 | 16.1 | 16.1 | 13.1 |
| Codons per AA | 13,892 | 22,627 | 27,519 | 5,278 | 37,542 | 15,230 | 13,768 | 787,872 | 641,565 | 22,591 | 26,438 | 22,992 | 19,598 | 2,921 | 4,637 | 21,063 | ||
| T | Thr | ACA | 30.6 | 28.0 | 24.8 | 21.6 | 27.1 | 28.4 | 28.3 | 34.2 | 29.6 | 16.3 | 51.5 | 50.9 | 38.6 | 35.0 | 21.9 | 22.6 |
| T | Thr | ACC | 20.4 | 22.9 | 25.5 | 30.8 | 22.8 | 23.2 | 22.4 | 17.9 | 21.8 | 25.7 | 7.6 | 7.5 | 20.8 | 22.9 | 27.4 | 26.8 |
| T | Thr | ACG | 18.9 | 21.8 | 22.6 | 22.6 | 19.9 | 21.5 | 22.1 | 15.2 | 17.2 | 24.9 | 3.9 | 3.2 | 9.2 | 16.3 | 27.9 | 28.8 |
| T | Thr | ACT | 30.1 | 27.3 | 27.2 | 25.0 | 30.2 | 26.9 | 27.2 | 32.7 | 31.4 | 33.2 | 36.9 | 38.3 | 31.4 | 25.7 | 22.7 | 21.7 |
| Codons per AA | 10,197 | 16,333 | 20,529 | 3,959 | 30,547 | 11,909 | 10,364 | 571,606 | 461,093 | 15,952 | 20,070 | 17,360 | 15,532 | 2,255 | 3,164 | 14,970 | ||
| V | Val | GTA | 18.7 | 16.9 | 14.6 | 12.9 | 18.1 | 16.2 | 15.8 | 15.9 | 13.7 | 11.9 | 26.5 | 26.5 | 19.0 | 12.8 | 8.3 | 7.3 |
| V | Val | GTC | 21.2 | 24.7 | 25.1 | 28.6 | 24.9 | 24.3 | 25.4 | 21.8 | 26.3 | 34.1 | 10.0 | 8.5 | 20.3 | 24.5 | 26.3 | 28.2 |
| V | Val | GTG | 26.8 | 29.3 | 30.8 | 31.8 | 26.3 | 29.5 | 29.1 | 23.4 | 25.5 | 30.6 | 5.1 | 3.8 | 15.8 | 28.0 | 37.3 | 39.2 |
| V | Val | GTT | 33.2 | 29.1 | 29.5 | 26.7 | 30.8 | 30.0 | 29.7 | 38.9 | 34.6 | 23.5 | 58.4 | 61.2 | 44.9 | 34.7 | 28.1 | 25.3 |
| Codons per AA | 12,606 | 20,139 | 25,863 | 5,243 | 39,506 | 14,814 | 12,547 | 605,528 | 491,117 | 18,939 | 21,158 | 18,523 | 17,487 | 2,707 | 3,946 | 18,216 | ||
| W | Typ | TGG | 100.0 | 100.0 | 100.0 | 100.0 | 100.0 | 100.0 | 100.0 | 100.0 | 100.0 | 100.0 | 100.0 | 100.0 | 100.0 | 100.0 | 100.0 | 100.0 |
| Codons per AA | 2,289 | 3,952 | 4,517 | 833 | 7,229 | 2,494 | 2,424 | 107,642 | 90,785 | 3,498 | 3,508 | 3,090 | 2,830 | 531 | 791 | 3,496 | ||
| Y | Tyr | TAC | 51.6 | 56.5 | 59.8 | 62.8 | 52.7 | 54.6 | 55.7 | 44.0 | 47.1 | 64.9 | 18.5 | 18.0 | 36.6 | 39.4 | 57.1 | 61.6 |
| Y | Tyr | TAT | 48.4 | 43.5 | 40.2 | 37.2 | 47.3 | 45.4 | 44.3 | 56.0 | 52.9 | 35.1 | 81.5 | 82.0 | 63.4 | 60.6 | 42.9 | 38.4 |
| Codons per AA | 6,322 | 10,100 | 11,774 | 2,335 | 19,614 | 6,915 | 6,328 | 307,728 | 250,436 | 8,842 | 12,998 | 12,250 | 10,470 | 1,346 | 1,894 | 7,748 | ||
| Species (codons [n]) | ||||||||||||||||||
| AA | Codon | HG (742,990) | Mi (366,435) | Mj (203,135) | Ma (176,816) | Mh (407,985) | Mc (205,612) | ZP (16,723) | AS (646,740) | AL (42,919) | TC (103,065) | BM (561,296) | DI (126,880) | OV (299,336) | TS (290,794) | TM (147,995) | TV (106,071) | |
| A | Ala | GCA | 22.3 | 32.2 | 32.3 | 32.8 | 34.9 | 36.9 | 19.5 | 32.7 | 31.7 | 29.3 | 39.1 | 40.0 | 37.5 | 31.7 | 24.1 | 26.7 |
| A | Ala | GCC | 33.0 | 13.3 | 12.8 | 11.6 | 11.4 | 11.2 | 24.9 | 18.1 | 20.9 | 20.6 | 12.3 | 11.7 | 13.8 | 16.4 | 27.7 | 25.9 |
| A | Ala | GCG | 25.9 | 8.1 | 8.0 | 7.0 | 7.3 | 6.8 | 7.4 | 22.8 | 23.9 | 23.7 | 12.3 | 12.8 | 14.3 | 18.4 | 22.7 | 22.1 |
| A | Ala | GCT | 18.7 | 46.3 | 46.9 | 48.6 | 46.4 | 45.2 | 48.2 | 26.4 | 23.5 | 26.4 | 36.3 | 35.5 | 34.4 | 33.5 | 25.5 | 25.3 |
| Codons per AA | 54,049 | 21,050 | 11,150 | 10,069 | 22,749 | 10,844 | 1,264 | 45,388 | 3,142 | 7,531 | 31,439 | 7,087 | 17,813 | 18,017 | 10,515 | 7,439.0 | ||
| C | Cys | TGT | 44.5 | 71.4 | 72.8 | 73.7 | 74.3 | 72.9 | 56.3 | 48.8 | 48.8 | 42.8 | 61.2 | 62.9 | 60.0 | 51.8 | 31.8 | 33.8 |
| C | Cys | TGC | 55.5 | 28.6 | 27.2 | 26.3 | 25.7 | 27.1 | 43.8 | 51.2 | 51.3 | 57.2 | 38.8 | 37.1 | 40.0 | 48.2 | 68.2 | 66.2 |
| Codons per AA | 16,227 | 7,328 | 4,217 | 3,502 | 8,174 | 4,656 | 256 | 16,446 | 1,120 | 2,901 | 14,026 | 2,998 | 6,689 | 7,559 | 4,428 | 3,174.0 | ||
| D | Asp | GAC | 65.5 | 26.5 | 27.1 | 24.8 | 24.2 | 22.2 | 32.1 | 35.2 | 41.0 | 40.5 | 24.0 | 20.5 | 20.6 | 33.2 | 56.3 | 56.1 |
| D | Asp | GAT | 34.5 | 73.5 | 72.9 | 75.2 | 75.8 | 77.8 | 67.9 | 64.8 | 59.0 | 59.5 | 76.0 | 79.5 | 79.4 | 66.8 | 43.7 | 43.9 |
| Codons per AA | 36,495 | 17,627 | 9,747 | 8,876 | 19,863 | 9,894 | 873 | 31,446 | 1,970 | 5,114 | 26,014 | 6,223 | 15,056 | 14,599 | 7,378 | 5,214.0 | ||
| E | Glu | GAA | 55.7 | 75.3 | 74.6 | 76.2 | 76.6 | 78.4 | 77.9 | 56.5 | 55.4 | 52.8 | 73.9 | 77.0 | 77.1 | 79.0 | 61.4 | 61.8 |
| E | Glu | GAG | 44.3 | 24.7 | 25.4 | 23.8 | 23.4 | 21.6 | 22.1 | 43.5 | 44.6 | 47.2 | 26.1 | 23.0 | 22.9 | 21.0 | 38.6 | 38.2 |
| Codons per AA | 45,714 | 24,640 | 13,289 | 12,192 | 27,589 | 13,117 | 1,041 | 39,335 | 2,469 | 6,214 | 31,136 | 7,577 | 18,333 | 18,001 | 8,907 | 6,459.0 | ||
| F | Phe | TTC | 48.9 | 24.3 | 21.8 | 20.9 | 21.3 | 18.1 | 55.3 | 54.5 | 56.6 | 60.0 | 35.0 | 37.3 | 36.9 | 34.3 | 53.0 | 52.6 |
| F | Phe | TTT | 51.1 | 75.7 | 78.2 | 79.1 | 78.7 | 81.9 | 44.7 | 45.5 | 43.4 | 40.0 | 65.0 | 62.7 | 63.1 | 65.7 | 47.0 | 47.4 |
| Codons per AA | 37,855 | 18,687 | 11,103 | 9,412 | 21,612 | 11,345 | 704 | 29,754 | 2,102 | 4,296 | 30,333 | 6,568 | 14,714 | 14,907 | 6,593 | 4,737.0 | ||
| G | Gly | GGA | 25.5 | 44.5 | 44.7 | 45.8 | 45.8 | 46.2 | 33.3 | 31.2 | 31.0 | 32.5 | 32.7 | 35.4 | 35.0 | 31.1 | 29.9 | 31.7 |
| G | Gly | GGC | 41.8 | 14.8 | 14.9 | 13.7 | 14.0 | 13.0 | 19.2 | 25.0 | 28.1 | 26.4 | 16.8 | 16.9 | 17.2 | 24.6 | 33.8 | 33.2 |
| G | Gly | GGG | 15.7 | 13.7 | 13.6 | 13.0 | 10.0 | 8.6 | 4.9 | 10.6 | 11.1 | 10.6 | 10.2 | 7.9 | 9.2 | 9.1 | 9.5 | 11.0 |
| G | Gly | GGT | 17.0 | 27.1 | 26.7 | 27.5 | 30.2 | 32.1 | 42.6 | 33.2 | 29.8 | 30.5 | 40.2 | 39.8 | 38.6 | 35.3 | 26.9 | 24.0 |
| Codons per AA | 46,667 | 20,413 | 10,992 | 10,064 | 22,693 | 11,194 | 1,186 | 37,251 | 2,633 | 7,031 | 27,963 | 5,944 | 16,849 | 14,863 | 9,577 | 6,196.0 | ||
| H | His | CAC | 51.6 | 28.1 | 27.8 | 24.8 | 25.4 | 22.3 | 33.7 | 38.8 | 41.3 | 43.8 | 29.2 | 22.2 | 25.2 | 39.0 | 51.0 | 49.7 |
| H | His | CAT | 48.4 | 71.9 | 72.2 | 75.2 | 74.6 | 77.7 | 66.3 | 61.2 | 58.7 | 56.2 | 70.8 | 77.8 | 74.8 | 61.0 | 49.0 | 50.3 |
| Codons per AA | 19,477 | 7,978 | 4,459 | 3,819 | 9,003 | 4,628 | 421 | 16,467 | 1,060 | 2,710 | 14,787 | 3,389 | 7,427 | 7,245 | 3,626 | 2,601.0 | ||
| I | Ile | ATA | 9.7 | 23.0 | 23.1 | 22.9 | 23.5 | 25.3 | 13.8 | 23.2 | 21.9 | 19.6 | 29.5 | 29.2 | 27.5 | 25.0 | 26.6 | 27.0 |
| I | Ile | ATC | 35.7 | 12.5 | 11.7 | 11.2 | 11.0 | 9.8 | 36.5 | 36.2 | 39.7 | 40.7 | 22.3 | 23.0 | 24.7 | 21.5 | 29.7 | 27.9 |
| I | Ile | ATT | 54.7 | 64.5 | 65.1 | 65.9 | 65.5 | 64.8 | 49.7 | 40.6 | 38.3 | 39.7 | 48.3 | 47.8 | 47.7 | 53.5 | 43.6 | 45.2 |
| Codons per AA | 38,860 | 23,849 | 13,986 | 12,183 | 28,528 | 15,200 | 1,018 | 38,551 | 2,582 | 5,486 | 39,971 | 9,443 | 20,692 | 17,746 | 7,330 | 5,428.0 | ||
| K | Lys | AAA | 60.2 | 72.5 | 72.6 | 73.2 | 74.7 | 76.6 | 61.2 | 53.8 | 53.4 | 53.4 | 69.0 | 69.4 | 69.5 | 69.4 | 44.6 | 47.3 |
| K | Lys | AAG | 39.8 | 27.5 | 27.4 | 26.8 | 25.3 | 23.4 | 38.8 | 46.2 | 46.6 | 46.6 | 31.0 | 30.6 | 30.5 | 30.6 | 55.4 | 52.7 |
| Codons per AA | 44,829 | 26,575 | 15,780 | 12,963 | 29,876 | 15,288 | 1,324 | 40,639 | 2,742 | 7,563 | 37,793 | 8,913 | 21,167 | 19,233 | 9,334 | 6,794.0 | ||
| L | Leu | CTA | 3.1 | 6.7 | 6.4 | 6.3 | 6.3 | 6.9 | 8.1 | 10.4 | 9.9 | 10.5 | 10.3 | 9.9 | 9.5 | 5.8 | 7.9 | 8.7 |
| L | Leu | CTC | 17.1 | 7.1 | 6.6 | 6.0 | 6.4 | 5.7 | 15.9 | 18.9 | 19.3 | 19.1 | 7.8 | 7.2 | 7.6 | 6.9 | 10.9 | 11.1 |
| L | Leu | CTG | 21.5 | 5.0 | 4.7 | 4.7 | 4.8 | 4.5 | 4.5 | 14.8 | 16.1 | 18.0 | 13.0 | 10.9 | 13.8 | 16.0 | 24.7 | 23.4 |
| L | Leu | CTT | 17.9 | 24.7 | 25.0 | 25.2 | 25.3 | 26.0 | 25.1 | 21.2 | 20.7 | 20.5 | 19.7 | 19.8 | 19.6 | 17.3 | 18.0 | 18.6 |
| L | Leu | TTA | 6.6 | 30.9 | 31.4 | 32.3 | 33.4 | 35.3 | 17.5 | 13.5 | 12.8 | 10.1 | 26.1 | 27.8 | 24.6 | 17.3 | 9.2 | 9.7 |
| L | Leu | TTG | 33.8 | 25.6 | 25.9 | 25.5 | 23.8 | 21.7 | 29.0 | 21.3 | 21.2 | 21.7 | 23.1 | 24.5 | 24.9 | 36.8 | 29.4 | 28.5 |
| Codons per AA | 68,607 | 34,549 | 19,485 | 17,118 | 38,589 | 20,003 | 1,397 | 56,369 | 3,564 | 8,233 | 53,591 | 12,048 | 26,576 | 27,491 | 13,110 | 9,558 | ||
| M | Met | ATG | 100.0 | 100.0 | 100.0 | 100.0 | 100.0 | 100.0 | 100.0 | 100.0 | 100.0 | 100.0 | 100.0 | 100.0 | 100.0 | 100.0 | 100.0 | 100.0 |
| Codons per AA | 18,014 | 8,593 | 4,930 | 4,095 | 9,532 | 4,730 | 306 | 16,510 | 1,091 | 2,477 | 15,883 | 3,373 | 7,990 | 7,625 | 3,836 | 2,785 | ||
| N | Asn | AAC | 48.6 | 22.3 | 20.9 | 19.9 | 18.8 | 17.6 | 46.6 | 43.2 | 44.1 | 49.1 | 27.2 | 23.8 | 25.1 | 34.9 | 53.1 | 53.1 |
| N | Asn | AAT | 51.4 | 77.7 | 79.1 | 80.1 | 81.2 | 82.4 | 53.4 | 56.8 | 55.9 | 50.9 | 72.8 | 76.2 | 74.9 | 65.1 | 46.9 | 46.9 |
| Codons per AA | 33,133 | 20,562 | 11,306 | 9,756 | 23,509 | 12,351 | 779 | 28,917 | 1,836 | 4,201 | 28,196 | 6,554 | 14,572 | 14,343 | 5,930 | 4,424 | ||
| P | Pro | CCA | 24.2 | 40.6 | 39.9 | 41.3 | 44.8 | 45.0 | 46.5 | 36.9 | 32.5 | 34.9 | 45.0 | 45.5 | 44.2 | 38.3 | 30.0 | 30.3 |
| P | Pro | CCC | 24.5 | 10.6 | 9.6 | 8.8 | 7.9 | 7.2 | 14.2 | 14.9 | 18.4 | 17.1 | 10.7 | 8.5 | 9.7 | 10.9 | 17.7 | 17.1 |
| P | Pro | CCG | 34.9 | 10.5 | 11.2 | 10.7 | 8.5 | 8.5 | 11.7 | 24.7 | 24.5 | 24.6 | 19.1 | 19.2 | 22.9 | 24.4 | 28.4 | 28.7 |
| P | Pro | CCT | 16.4 | 38.3 | 39.3 | 39.1 | 38.9 | 39.3 | 27.6 | 23.5 | 24.7 | 23.4 | 25.2 | 26.8 | 23.2 | 26.3 | 23.8 | 23.9 |
| Codons per AA | 36,929 | 16,614 | 8,537 | 7,305 | 17,440 | 8,307 | 768 | 30,784 | 2,276 | 5,519 | 23,108 | 4,915 | 13,464 | 11,909 | 7,466 | 5,066 | ||
| Q | Gln | CAA | 57.1 | 79.4 | 79.6 | 80.2 | 80.9 | 80.3 | 82.0 | 57.4 | 57.1 | 50.2 | 61.4 | 63.6 | 62.8 | 59.9 | 50.4 | 50.3 |
| Q | Gln | CAG | 42.9 | 20.6 | 20.4 | 19.8 | 19.1 | 19.7 | 18.0 | 42.6 | 42.9 | 49.8 | 38.6 | 36.4 | 37.2 | 40.1 | 49.6 | 49.7 |
| Codons per AA | 33,107 | 16,926 | 8,552 | 7,532 | 17,739 | 8,805 | 640 | 23,271 | 1,514 | 3,612 | 21,428 | 4,769 | 11,797 | 11,420 | 5,644 | 4,047 | ||
| R | Arg | AGA | 11.6 | 28.8 | 28.1 | 29.2 | 30.0 | 30.0 | 16.4 | 17.7 | 16.3 | 17.2 | 22.3 | 21.9 | 21.2 | 21.8 | 16.3 | 17.6 |
| R | Arg | CGA | 18.0 | 16.8 | 16.8 | 17.3 | 16.7 | 17.2 | 17.3 | 21.3 | 18.5 | 19.7 | 24.0 | 26.3 | 25.4 | 22.7 | 18.1 | 17.7 |
| R | Arg | AGG | 9.0 | 9.7 | 9.4 | 8.8 | 8.9 | 8.6 | 2.9 | 12.3 | 11.8 | 12.4 | 10.9 | 8.8 | 9.5 | 7.1 | 12.4 | 13.2 |
| R | Arg | CGC | 25.0 | 9.4 | 9.2 | 8.5 | 8.8 | 7.9 | 15.3 | 15.8 | 20.2 | 17.3 | 9.6 | 9.4 | 10.4 | 13.7 | 22.9 | 21.8 |
| R | Arg | CGG | 15.8 | 5.6 | 5.4 | 4.9 | 4.5 | 4.5 | 1.2 | 8.3 | 7.9 | 7.2 | 9.2 | 8.4 | 8.8 | 8.5 | 11.6 | 11.5 |
| R | Arg | CGT | 20.6 | 29.7 | 31.0 | 31.4 | 31.1 | 31.8 | 47.0 | 24.6 | 25.3 | 26.2 | 24.0 | 25.2 | 24.8 | 26.1 | 18.7 | 18.2 |
| Codons per AA | 47,178 | 19,486 | 11,042 | 9,171 | 21,409 | 9,973 | 1,001 | 40,766 | 2,650 | 6,429 | 31,420 | 7,457 | 17,634 | 16,384 | 9,203 | 6,468 | ||
| S | Ser | AGC | 15.5 | 9.1 | 9.4 | 8.4 | 7.9 | 7.6 | 11.8 | 16.4 | 16.6 | 17.1 | 11.0 | 9.7 | 11.1 | 15.1 | 23.2 | 22.5 |
| S | Ser | TCA | 14.4 | 24.5 | 24.3 | 24.1 | 27.0 | 28.6 | 18.1 | 22.3 | 20.8 | 19.6 | 28.4 | 29.5 | 27.7 | 21.0 | 14.4 | 15.5 |
| S | Ser | TCC | 20.8 | 9.0 | 8.6 | 7.9 | 6.8 | 6.6 | 15.7 | 9.9 | 12.0 | 11.0 | 10.4 | 9.3 | 10.7 | 10.3 | 17.7 | 17.3 |
| S | Ser | AGT | 12.5 | 17.6 | 17.2 | 18.5 | 18.1 | 18.4 | 13.6 | 15.8 | 13.8 | 14.4 | 19.2 | 18.7 | 19.1 | 19.1 | 13.3 | 13.8 |
| S | Ser | TCG | 22.4 | 7.8 | 8.3 | 7.9 | 6.2 | 6.2 | 13.3 | 21.4 | 22.3 | 24.8 | 12.2 | 12.8 | 14.0 | 14.4 | 19.1 | 18.3 |
| S | Ser | TCT | 14.3 | 31.9 | 32.1 | 33.3 | 34.0 | 32.5 | 27.5 | 14.3 | 14.4 | 13.1 | 18.9 | 20.0 | 17.5 | 20.1 | 12.2 | 12.6 |
| Codons per AA | 54,466 | 27,606 | 14,239 | 12,353 | 29,702 | 15,207 | 899 | 48,736 | 3,157 | 6,860 | 43,504 | 9,483 | 21,762 | 22,175 | 10,980 | 7,907 | ||
| T | Thr | ACA | 23.2 | 40.6 | 39.2 | 41.1 | 42.3 | 42.7 | 19.5 | 30.2 | 30.3 | 27.5 | 39.0 | 40.1 | 38.1 | 31.8 | 21.3 | 25.1 |
| T | Thr | ACC | 25.6 | 11.1 | 9.9 | 9.0 | 9.1 | 7.9 | 28.6 | 19.2 | 22.4 | 20.0 | 15.6 | 12.9 | 15.6 | 16.3 | 24.9 | 23.1 |
| T | Thr | ACG | 26.6 | 8.4 | 8.8 | 8.6 | 8.5 | 7.7 | 12.5 | 26.8 | 24.9 | 29.2 | 15.4 | 16.3 | 17.4 | 19.8 | 30.9 | 30.3 |
| T | Thr | ACT | 24.6 | 39.8 | 42.1 | 41.4 | 40.1 | 41.7 | 39.4 | 23.8 | 22.4 | 23.2 | 30.0 | 30.7 | 28.9 | 32.1 | 22.9 | 21.5 |
| Codons per AA | 37,607 | 19,046 | 10,254 | 8,837 | 20,194 | 10,213 | 919 | 34,207 | 2,219 | 5,814 | 29,901 | 6,460 | 15,488 | 14,901 | 7,680 | 5,829 | ||
| V | Val | GTA | 6.0 | 17.6 | 16.9 | 17.5 | 17.0 | 20.7 | 14.1 | 16.4 | 16.6 | 16.4 | 25.4 | 26.2 | 26.3 | 19.4 | 16.6 | 17.7 |
| V | Val | GTC | 29.6 | 13.2 | 12.3 | 11.9 | 11.4 | 10.7 | 29.2 | 20.6 | 21.7 | 21.3 | 14.3 | 14.0 | 14.4 | 16.7 | 22.8 | 21.9 |
| V | Val | GTG | 38.3 | 13.5 | 13.2 | 11.7 | 12.9 | 11.7 | 12.9 | 29.7 | 31.1 | 30.7 | 22.9 | 21.2 | 21.6 | 26.3 | 27.6 | 28.3 |
| V | Val | GTT | 26.1 | 55.8 | 57.6 | 58.9 | 58.6 | 56.9 | 43.8 | 33.2 | 30.6 | 31.5 | 37.5 | 38.7 | 37.7 | 37.6 | 33.0 | 32.1 |
| Codons per AA | 45,942 | 19,706 | 10,925 | 9,899 | 21,917 | 10,703 | 1,109 | 42,490 | 2,780 | 6,580 | 33,067 | 7,389 | 17,037 | 18,805 | 9,977 | 7,169 | ||
| W | Typ | TGG | 100.0 | 100.0 | 100.0 | 100.0 | 100.0 | 100.0 | 100.0 | 100.0 | 100.0 | 100.0 | 100.0 | 100.0 | 100.0 | 100.0 | 100.0 | 100.0 |
| Codons per AA | 9,033 | 4,055 | 2,294 | 2,002 | 4,746 | 2,298 | 188 | 7,902 | 532 | 1,213 | 6,380 | 1,377 | 3,584 | 3,486 | 1,777 | 1,350 | ||
| Y | Tyr | TAC | 58.9 | 23.2 | 22.2 | 20.9 | 21.4 | 19.6 | 34.6 | 37.3 | 41.2 | 46.0 | 30.3 | 26.0 | 28.4 | 38.7 | 61.8 | 62.7 |
| Y | Tyr | TAT | 41.1 | 76.8 | 77.8 | 79.1 | 78.6 | 80.4 | 65.4 | 62.7 | 58.8 | 54.0 | 69.7 | 74.0 | 71.6 | 61.3 | 38.2 | 37.3 |
| Codons per AA | 18,687 | 11,019 | 6,656 | 5,582 | 12,940 | 6,716 | 627 | 21,299 | 1,453 | 3,267 | 20,353 | 4,785 | 10,337 | 9,939 | 4,691 | 3,401 | ||
Values are given as % per AA, or as numbers for Codons per AA. Definitions of species two letter codes are provided in Table 1. AA, amino acid.
To examine these variables independent of species relatedness, correlations were calculated using phylogenetically independent contrasts (see Materials and methods, below). The variances of the contrasts were computed for each character as a measure of the variance accumulating per unit branch length. The branch lengths were estimated from the maximum likelihood phylogeny assuming a molecular clock (Figure 1); by this criterion, the tips of the tree are all equidistant in branch length from its root. Computed contrasts were plotted in all figures representing pair-wise comparisons, and the correlation coefficients were calculated from the paired contrasts. This method is robust to changes in molecular clock assumptions. (Trees calculated without the assumption of a molecular clock are similar in topology but differ in rooting, and branch lengths vary according to amount of base substitution in the 18S rRNA; the clock-based tree provides branch lengths that should estimate most closely the relative durations of branches in evolutionary time. Because independent contrasts are influenced mainly by relative branch lengths, our results should be robust to alternative placements of the root.)
Figure 1.
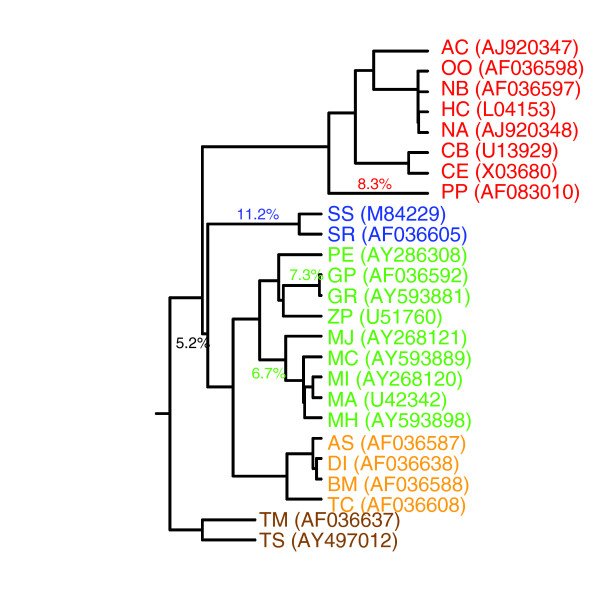
Maximum likelihood (ML) analysis of 18S ribosomal RNA from 25 nematode species. The ML calculation assumes a molecular clock; thus, the tips of the tree are all equidistant, in branch length, from its root. This model of base substitution allows the expected frequencies of the four bases to be unequal, and different rates of evolution at different sites are allowed. The numbers indicate reconstruction of percentage changes in overall codon usage on this phylogenetic topology (see Codon usage patterns and relationships to sampling method, nematode phylogeny, and GC content [under Results]). A distance matrix of D values corrected for non-additivity [1 - antilog(-D)] × 100 was partitioned on the topology using the cyclic neighbor-joining algorithm, as illustrated by Avise [82]. Approximate percentage change in overall codon usage is indicated for five branches inferred to have undergone 5% or more divergence from an ancestral nematode pattern. This analysis identified genera Globodera, Meloidogyne, Pristionchus, and Strongyloides as having the most highly derived patterns of codon usage, and the remaining species as having relatively little net divergence from an ancestral nematode pattern. Definitions of species two letter codes are provided in Table 1; GenBank accession numbers are listed on right. Clades V are shown in red, IVa in blue, IVb in green, III in yellow, and I in brown.
Amino acid composition of nematode proteins and relationship to GC content
AA composition of predicted proteins in nematodes varies among species within a narrow window and is similar to that observed in other organisms (Tables 2 and 3). (Standard deviations in AA usage among nematodes range from 5% to 15% of mean usage, and mean nematode AA usage differs from the mean of four representative organisms by an average of 8%.) Across nematodes, Leu is the most common AA (8.8% of all codons) and Trp the least common (1.1%). Eight AAs contribute an average of more than 6% each to AA content (Ile, Gly, Val, Glu, Ala, Lys, Ser, and Leu); these AAs are also among the most common in the proteomes of other representative species, including humans (Table 3). As in other taxa [46], nematodes show a correlation between AA usage and the degree of codon degeneracy (R = 0.72).
In nematodes, coding sequence GC content, derived from our EST clusters, varies from 32% to 51% (Table 1) among species, with a mean of 43.6 ± 5.9%. The distribution is biphasic, with a peak at 36% GC and a second peak at 48%. Strongyloides (SS and SR), Meloidogyne (MI, MJ, and so on), and filarial parasites (BM, DI, and OV) are the most AT rich (low GC); and NB, PP, and cyst nematodes (GP, GR, and HG) are the most GC rich (approximately 50%). The variation observed in AA composition among species shows a clear relationship to the species' coding sequence GC content. The frequency of AAs encoded by WWN codons (AA, AT, TA, or TT in the first and second nucleotide positions; Asn, Ile, Lys, Try, Phe, and Met) decreases with increasing coding sequence GC content (Figure 2a), whereas the proportion of AAs encoded by SSN codons (GG, GC, CG, and CC; Ala, Arg, Pro, and Gly) increases with higher coding sequence GC content (Figure 2b), and these relationships remain even after removing the effect of evolutionary relationships using phylogenetically independent contrasts. Among AAs, the most uniform and precipitous decrease with increasing GC content was seen with Ile and Tyr whereas the most uniform and rapid increase with higher GC content was seen with Ala and Arg. The trend is less pronounced for other AAs (flatter slope, lower R value). Thr, encoded by four GC/AT 'balanced' codons (ACN), exhibits no change in its frequency with changing GC content (data not shown).
Figure 2.
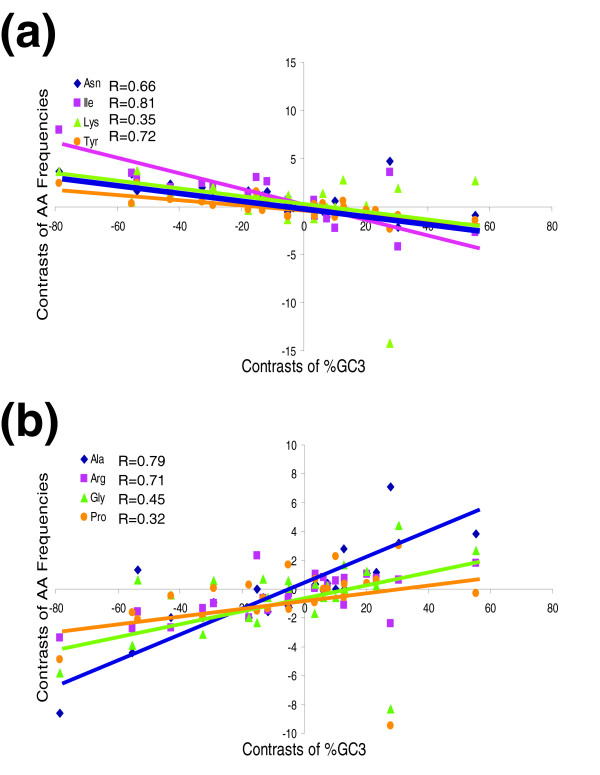
Correlation between phylogenetically independent contrasts of coding sequence GC3 content and AA usage for 25 nematode species. (a) AAs lysine (Lys), isoleucine (Ile), asparagine (Asn), and tyrosine (Tyr) are used less frequently as the species' coding sequence GC3 content increases. (b) AAs alanine (Ala), glycine (Gly), arginine (Arg), and proline (Pro) are used more frequently as the coding sequence GC3 content increases. AA, amino acid.
Base composition by codon position in nematode transcripts and relationship to GC content
Codon usage in nematode species was examined by several methods, including comparison of base usage by position (1-3) over all AAs and comparison of codon usage within each AA. Over all AAs, purine (AG) and pyrimidine (TC) usage in positions 1, 2, and 3 is remarkably uniform between species, favoring purines in position 1 (AG 59.6 ± 1.5%), near equal usage in position 2 (AG 50.0 ± 0.8%), and pyrimidines in position 3 (AG 47.9 ± 1.5%; Additional data file 1). Similar values were observed in Schistosoma mansoni (AG 61%, 53%, and 48% in positions 1, 2, and 3, respectively) [1]. GC versus AT usage also varies by position but with much greater variance, with near equal usage in position 1 (50.3% GC) and lower GC usage in positions 2 and 3 (39.1 and 41.4%, respectively), mainly due to greater use of G in position 1 and T in positions 2 and 3 [4].
The variation observed in GC usage by codon position among species exhibits a clear relationship to the species' overall coding sequence GC content. Not surprisingly, both GC1 and GC2 composition increase with higher coding sequence GC3 content (Figure 3). Specifically, species with high AT content like root-knot Meloidogyne species (MI, MJ, and so on) and filarial worms (BM, DI, and OV) [38,39] are biased toward codons terminating in A or T, whereas species with higher GC content such as NB, PP, cyst nematodes, and whipworms (TM and TV) prefer codons ending with G or C. Differences in calculated GC composition by codon position (1-3) between species are determined both by the species' AA usage (as described above) and the codons used for each AA. For example, Cys was encoded by TGT as much as 85% of the time for the AT-rich Strongyloides genomes, whereas TGC was used up to 60% of the time in GC-rich genomes such as NB, PP, and HG. To compare codon usage more systematically for individual AAs between species, we employed a statistical approach (described in Materials and Methods and in the following section).
Figure 3.
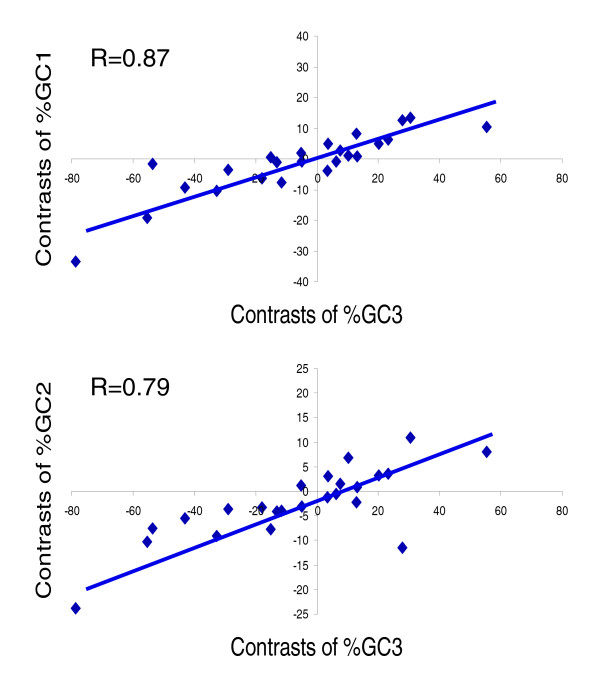
Correlation between phylogenetically independent contrasts of the third position GC content (GC3) and that of the first (GC1) and second (GC2) codon positions for 25 nematode species.
Codon usage patterns and relationships to sampling method, nematode phylogeny, and GC content
Similarity in codon usage was quantified and reported as D100 values for each species and AA compared [47,48] (matrix of D100 values for each species and AA compared is available in Additional data file 2).
Because analyses of all but two of the nematode species were based on EST-derived partial genomes [26], comparisons were performed to estimate the differences in codon usage pattern that could be expected using EST collections versus gene predictions derived from a fully assembled and annotated genome. Using C. elegans, parallel analyses were performed using either all 22,254 predicted gene products or two EST datasets (CE-A and CE-B) each comprising 10,000 ESTs. Clustering and peptide predictions were performed using the same algorithms as for the other 30 species. The average D100 value for the comparison of codon usage pattern between the CE-A and CE-B datasets was 0.18, which was not statistically different at the P < 0.05 threshold and less than the D100 value of the C. elegans to C. briggsae comparison (0.40). Comparing the CE-A and CE-B datasets to the genome-derived full gene set for C. elegans yielded average D100 values of 0.67 and 0.26, respectively. At a practical level, the calculated use of the average codon in C. elegans based on CE-A and CE-B differs from that based on prediction from the whole genome by just 3.4 ± 2.3% and 2.0 ± 1.5%, respectively. Therefore, although differences in calculated codon usage using partial versus whole genome data are modest enough to make EST-derived codon usage data highly informative, care must be taken not to over-interpret minor differences in D100 values because such differences are probably within the range of sampling error (see Discussion, below). However, such uncertainty around small differences in D100 values does not alter the major trends that we describe.
The 16 intragenus comparisons of species sharing the same genus name (Ancylostoma, Caenorhabditis, Strongyloides, Globodera, Meloidogyne, Ascaris, and Trichuris) all have low D100 values, with a mean of 0.14 ± 0.11 (median 0.09, range 0.02-0.40), indicating very similar patterns of codon usage among species within the same genera. By contrast, the 480 comparisons beyond named genera vary greatly, with a mean D100 value of 8.10 ± 7.46 (median 5.26, range 0.08-40.56). Low D100 values do sometimes extend to comparisons among genera. For instance, relatively low D100 values (0.08-1.94) are observed within the following: order Haemonchidae (HC, OO, and TD); subfamily Heteroderinae (GP, GR, and HG); superfamily Ascaridoidea (AS, AL, and TC); and superfamily Filarioidea (BM, DI, and OV). However, low D100 values are not maintained across family Ancylostomatidae (NA, AC, and AY), family Strongyloididae (SS, SR, and PT), superfamily Tylenchoidea (PE-MC), and order Trichocephalida (TS, TM, and TV). Similarity in codon usage, as indicated by low D100 values, does not extend to the level of the major clades (I, III, IVb, IVa, and V).
Furthermore, species with very similar GC content, although distantly related, can exhibit extremely similar codon usage (for instance Ancylostoma caninum versus Toxocara canis, GC = 48%, D100 = 0.79). Species with the lowest average D100 values in one-versus-all comparisons are those closest to the median species GC content, such as PE (GC = 46%). Taxa with the highest AT content, such as Strongyloides and Meloidogyne species, have among the most extreme differences in codon usage when compared with species beyond their genus (median D100 values are 15.3 and 9.4, respectively).
Phylogenetic analysis of changes in codon usage using (1 - antilog [-D]) × 100, interpretable as percentage divergence in overall codon usage (Figure 1), identifies five branches that have accumulated more than 5% change in codon usage. These branches are as follows: the most recent common ancestor of clades III, IVa, and IVb (5.2%); the most recent common ancestor of clade IVa (11.2%); the most recent common ancestor of genus Meloidogyne (6.7%); the most recent common ancestor of genus Globodera (7.3%); and the lineage represented by PP (8.3%). Genera Globodera, Meloidogyne, Pristionchus, and Strongyloides therefore represent the most highly derived patterns of codon usage in nematodes, with the remaining species exhibiting less relatively divergence from an ancestral nematode pattern.
Codon bias in nematode transcripts and relationship to GC content
We used the effective number of codons (ENC) to measure the degree of codon bias for a gene [49]. ENC is a general measure of non-uniformity of codon usage and ranges from 20 if only one codon is used for each AA to 61 if all synonymous codons are used equally. The mean ENC across all sampled nematode species is 46.7 ± 5.1, and many nematodes have ENC values similar to those obtained for various bacteria, yeast, and Drosophila species (ENCs of 45-48) [50]. Outliers with low ENC values include SS and SR, for which transcripts on average utilize only about 35 of 61 available codons. The variation observed in ENC values among species exhibits a clear relationship to the species' overall coding sequence GC3 content (R = 0.70 following phylogenetic correction; Figure 4). The correlation confirms that species with lower GC3 content in coding sequence have greater codon usage bias than those with higher GC3. ENC values for nematodes peak at 47-49% GC (data not shown). In addition to comparing species' mean ENC values, we also examined the distribution of ENC values across all transcripts within each species. Although all species have examples of transcripts across nearly the full range of possible ENC values, in species with low GC3 content, such as SR, the distribution is shifted toward a lower ENC peak (Additional data file 3).
Figure 4.
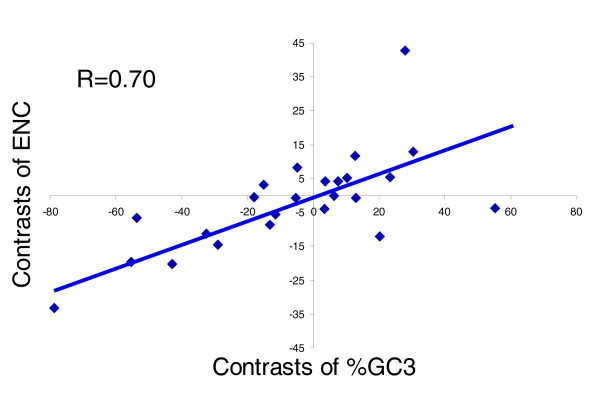
Correlation between phylogenetically independent contrasts of each species' %GC3 and its mean ENC for 25 nematode species. ENC, effective number of codons.
To ensure that differences in our available data for each species (for instance, cluster number and cluster length) were not creating artifacts in ENC values, quality checks were performed. Unlike measures such as codon bias index, scaled ×2, and intrinsic codon bias index, ENC values should be independent of translated polypeptide length and sample size [49,51], and our analysis confirmed this. No correlation with ENC was observed with either average translated polypeptide length or number of clusters for a species. In fact, SS and SR with the lowest ENC values had above average cluster length and number. As additional confirmation, we randomly selected 2,400 C. elegans genes (the average number of clusters for species other than CE and CB) and calculated ENC based on either full-length genes or genes trimmed to 121 AAs (the average length cluster translation for species other than CE and CB). Differences in the average ENC numbers for these datasets were not statistically significantly different from zero (P > 0.05).
In addition to codon bias, neighboring nucleotides influence the codon observed at a position relative to synonymous codons. The most important nucleotide determining such context dependent codon bias [52-54] is the first one following the codon (N1 context) [55,56]. An analysis using the complete genesets of Homo sapiens, Drosophila melanogaster, C. elegans, and Arabidopsis thaliana revealed that 90% of codons have a statistically significant N1 context-dependent codon bias [57]. Using the same method we calculated that, for the 30 nematode species represented by EST-derived codon data, an average of 63% of codons with N1 context have a statistically significant bias (because the R values differed from 1 by more than 3 standard deviations). Fedorov and colleagues [57] showed that their results were not considerably affected by gene sampling. However, for our dataset the calculated CE-A and CE-B N1 context with statistically significant bias was 75% and 83% of the codons, respectively, as compared with 96% when the complete C. elegans gene set was used. Therefore, the extent of significant N1 context-dependent codon bias determined from EST-based codon usage data may change as more complete nematode genomes become available. The complete list of relative abundance of all nematode species with N1 context, R values, and standard deviations are available in Additional data file 4.
Coding sequence GC content versus total genome GC content
Because of the clear relationships of AA composition, codon usage pattern, and codon bias to the GC content of coding sequences and the interest in the underlying cause of these correlations (see Discussion, below), we examined the relationship between coding sequence GC3 content and genomic GC content in nematodes. Total genomic GC content was calculated for the six nematode species for which significant genome sequence data were available as unassembled sequences (TS and HC), partial assemblies (BM and AC), or finished assemblies (CE and CB). Noncoding genomic GC content was calculated for CB and CE based on published estimates of the percentage of each genome that is composed of noncoding sequence, namely 74.5% and 77.1%, respectively [35]. Extrapolations were made for other species using the CE percentage noncoding estimate. Although GC content varies across the genome for some organisms (for example, isochors in vertebrates [58]), GC content is fairly uniform across the C. elegans genome [17]; furthermore, as yet there is no evidence of non-uniformity in other nematode genomes. A positive correlation was observed between coding GC3 content and both total GC content and extrapolated noncoding GC content (R = 0.92; Figure 5). Noncoding genomic sequences varied across a wider span of GC values than did coding sequences. In all six nematodes, coding sequences were somewhat more GC rich than were noncoding sequences (2-10%).
Figure 5.
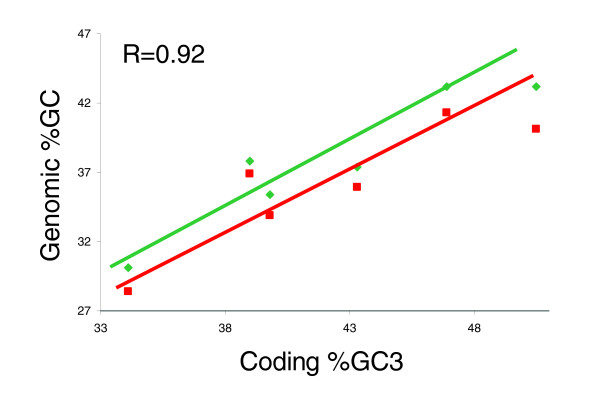
Correlation between coding sequence (transcriptome) %GC3 and genome %GC for six nematode species with extensive available genomic sequence. The green line indicates the coding sequence %GC versus the full genomic %GC. In this case, coding sequence %GC3 is a contributor to the full genomic %GC such that X and Y are not independent variables. The red line indicates the coding sequence %GC3 versus noncoding genomic %GC. In this case, the coding sequence contribution has been removed from genomic totals such that X and Y are independent variables. For BM, TS, HC, and AC, the calculation of noncoding genomic %GC relies on the assumption that the species will have a similar breakdown of coding and noncoding sequence as CE. Assembly and gene calling for the BM, HC, TS, and AC sequences are needed to test this assumption. Definitions of species two letter codes are provided in Table 1.
Comparison of coding sequence GC versus 3'-untranslated region (UTR) GC also supports this conclusion. Calculated 3'-UTR GC for the 30 species in our EST dataset ranges from 28.6% to 46.1%. Correlation between phylogenetically independent contrasts of coding GC content (Table 1) and 3'-UTR has an R value of 0.81 (data not shown).
Codon usage patterns in abundantly expressed genes and candidate optimal codons
Representation in cDNA library generally correlates with abundance in the original biologic sample [59] although artifacts occur [60,61]. To investigate the difference in the codon usage patterns in highly abundant transcripts as compared with less abundantly expressed genes, as determined by ESTs, we selected five species, each of which is a member of a different clade. The selected species (AY, MI, OV, SR, and TS) were represented by approximately 3,000 clusters each (range 2,693-3,214), and codon usage tables were generated for subsets of genes from each species: the 20 most abundant clusters versus all remaining clusters, and the 50 most abundant clusters versus all remaining clusters. Results of both comparisons were similar, and for simplicity we discuss only the results based on the comparison of the 50 most abundant versus all remaining clusters. Clusters 51 to about can be described as containing mainly genes with low to moderate expression because transcripts of extremely low abundance are less likely to be represented in EST collections (for instance, neuronal 7-transmembrane receptors). Codon usage tables, AA frequencies, and relative differences between AA usage of the most abundant and less abundant genes are available in Additional data file 5.
D values were calculated across all AAs and the codon usage in each species was generally similar for genes represented by abundant EST clusters and genes represented by low to moderate expression EST clusters. SR exhibited the greatest difference between the two usage patterns (D100 = 6.15). Additionally, for all the species at least seven AAs were used significantly more frequently in the abundant genes than in the remainder of the genes. For example, although the abundant OV clusters had a Pro composition of 10.5% of all AAs, the rest of the clusters were only 4.4% Pro.
Examining the codon usage frequencies within an AA, an increase in usage has been noted with higher gene expression for specific so-called 'optimal' codons [62,63]. Using the codon usage tables for the top 50 and remaining clusters, we have defined a list of potentially optimal codons with usage that is higher in abundant transcripts by a statistically significant measure. Out of the 59 synonymous codons there were 24, 28, 25, 27, and 23 candidate optimal codons (Table 5) in AY, MI, OV, SR, and TS, respectively. For example, Tyr is encoded by two codons (TAC and TAT); in AY TAC is used 75% of the time in the abundant clusters and 59% of the time in the less abundant clusters. Similar analysis documented about 21 candidate optimal codons in C. elegans for which usage differed significantly when comparing high and low expressed genes [31,33,64]. Confirmation of these candidate codons as truly 'optimal' will require additional investigations, including other means of verifying relative expression levels (for example, microarrays and reverse transcription [RT]-polymerase chain reaction [PCR]).
Table 5.
Candidate optimal codons in five species, determined as frequency increase by increased expression levela
| Species | Species | ||||||||||||||
|---|---|---|---|---|---|---|---|---|---|---|---|---|---|---|---|
| AA | Codon | AY | MI | OV | SR | TS | AA | Codon | AY | MI | OV | SR | TS | ||
| A | Ala | GCA | GCA | N | Asn | AAC | AAC | AAC | AAC | ||||||
| A | Ala | GCC | GCC | GCC | GCC | GCC | N | Asn | AAT | AAT | |||||
| A | Ala | GCT | GCT | GCT | GCT | GCT | |||||||||
| P | Pro | CCA | CCA | CCA | CCA | CCA | |||||||||
| C | Cys | TGC | TGC | TGC | TGC | TGC | P | Pro | CCC | CCC | |||||
| P | Pro | CCG | CCG | ||||||||||||
| D | Asp | GAC | GAC | GAC | GAC | GAC | P | Pro | CCT | CCT | |||||
| D | Asp | GAT | GAT | ||||||||||||
| Q | Gln | CAA | CAA | CAA | |||||||||||
| E | Glu | GAA | GAA | GAA | GAA | Q | Gln | CAG | CAG | CAG | CAG | ||||
| E | Glu | GAG | GAG | GAG | |||||||||||
| R | Arg | AGA | AGA | ||||||||||||
| F | Phe | TTC | TTC | TTC | TTC | TTC | R | Arg | CGA | CGA | |||||
| F | Phe | TTT | TTT | R | Arg | AGG | AGG | ||||||||
| R | Arg | CGC | CGC | CGC | CGC | ||||||||||
| G | Gly | GGA | GGA | GGA | GGA | GGA | R | Arg | CGG | CGG | |||||
| G | Gly | GGC | GGC | R | Arg | CGT | CGT | CGT | CGT | ||||||
| G | Gly | GGT | GGT | ||||||||||||
| S | Ser | AGC | AGC | AGC | AGC | AGC | AGC | ||||||||
| H | His | CAC | CAC | CAC | CAC | CAC | CAC | S | Ser | TCA | TCA | TCA | |||
| S | Ser | TCC | TCC | TCC | TCC | TCC | |||||||||
| I | Ile | ATA | ATA | S | Ser | AGT | AGT | ||||||||
| I | Ile | ATC | ATC | ATC | ATC | ATC | S | Ser | TCG | TCG | TCG | TCG | |||
| I | Ile | ATT | ATT | S | Ser | TCT | TCT | ||||||||
| K | Lys | AAA | AAA | T | Thr | ACC | ACC | ACC | ACC | ACC | |||||
| K | Lys | AAG | AAG | AAG | AAG | AAG | T | Thr | ACG | ACG | ACG | ||||
| T | Thr | ACT | ACT | ACT | |||||||||||
| L | Leu | CTA | CTA | ||||||||||||
| L | Leu | CTC | CTC | CTC | CTC | V | Val | GTA | GTA | ||||||
| L | Leu | CTG | CTG | V | Val | GTC | GTC | GTC | GTC | GTC | |||||
| L | Leu | CTT | CTT | CTT | CTT | CTT | V | Val | GTG | GTG | |||||
| L | Leu | TTA | TTA | V | Val | GTT | GTT | GTT | |||||||
| L | Leu | TTG | TTG | TTG | TTG | ||||||||||
| Y | Tyr | TAC | TAC | TAC | TAC | TAC | TAC | ||||||||
aExpression level inferred by EST number. Definitions of species two letter codes are provided in Table 1. AA, amino acid; EST, expressed sequence tag.
Discussion
A comprehensive and well supported codon usage table for 32 nematode species across most of the phylum's major clades and based on nearly 26 million codons is now available. Use of large EST datasets provide an excellent resource for determining a species mean codon usage with results that differ only modestly from those obtained from full genomes. In nematodes, codon usage varies widely, as does coding and noncoding GC content of nematode genomes. GC content correlates with AA usage, similarity of codon usage, and codon bias. Codon usage similarity in Nematoda usually persists within a genus but then rapidly diminishes, even within each major clade (clades I-V). Based on EST sampling, differences in codon usage between highly abundant genes and moderately expressed genes are recognizable, and candidate optimal codons can be identified.
GC content, causality, and directional mutation pressure
Correlations between GC content and mean codon usage and mean AA usage similar to those we describe across the phylum Nematoda have been observed in many other species [4,65-70]. Directional mutation pressure is a theory proposed to quantify differences in GC content observed in species [3]. Important variables include the relative values of the mutation rates u (GC/CG → AT/TA change) and v (AT/TA → GC/CG change). The preponderance of the evidence supports causality of genome GC content, as determined by directional mutation pressure or nucleotide level selective pressure, driving both codon usage and AA composition rather than the reverse. First, in an examination of sequence data from a large number of a bacteria, archaea, and eukaryotes, a model assuming directional mutation and selection at the nucleotide level with different rates of change for each of the three codon positions can explain 71-87% of the variance in codon usage and 71-79% of the variance in AA composition [5]. Knight and coworkers [5] found that between species an AA's change in frequency in response to GC content is determined by the mean GC content of its codons, whereas a codon's change in frequency is determined by the difference between its GC content and the mean GC content of its synonyms. We observe this result to be generally true across nematodes as well.
Second, an analysis comparing codon usage from eubacterial and archaeal species with complete genomes [6] found that codon usage can be predicted with some accuracy if one knows only the sequence of the species' intergenic sequences from which genome GC content, and context dependent nucleotide bias parameters can be calculated. Using data from six nematode species for which substantial genome sequence data are available, we observed that coding sequence GC3 content correlates with noncoding sequence GC content. This perhaps indicates that, for nematodes too, it should be possible to predict mean codon usage using only knowledge of the intergenic sequences of the species. Our findings are consistent with the model that genome GC content drives both mean codon usage and AA composition.
Little is known about why directional mutation pressure or selective pressure leads to differences in genomic GC content among species [5,6]. Within nematodes we see no pattern based on ecologic niche or other factors that corresponds to GC content. For instance, cyst nematodes (GP, GR, and HG) and root knot nematodes (MI, MJ, MA, MH, and MC) have similar life cycles as plant sedentary endoparasites, but their coding sequence GC contents are completely different (approximately 50% versus 36%). Whatever the driving forces, it is important for nematologists to note that they are sufficiently strong not only to change base composition in wobble sites (third position) but also to alter first and second codon positions and even AA sequences - features that are sometimes assumed to be under selective pressure for conservation.
Species' mean codon usage versus optimal codons in abundantly expressed genes
Our use of thousands of genes per species without weighting for abundance of expression has produced a codon usage dataset that probably reflects codon usage for genes with low to moderate abundance of mRNAs. In the case of C. elegans and C. briggsae, our codon usage table reflects the mean of all predicted genes, although this is similar to that observed based on sampling of 10,000 ESTs. At this 'genome-wide' level, genome GC content is a dominant factor. However, codon usage within a species does vary from gene to gene.
Prior studies of C. elegans codon usage have examined codon usage and the role of 'optimal codons' in putatively abundantly expressed genes [31,33,64]. Stenico and coworkers [31] observed differences between usage of specific codons based on 168 known genes, including many highly expressed transcripts (for instance, actin, myosin, collagen, and vitellogenin), and 90 unidentified reading frames (URFs) emerging from sequencing efforts presumed to represent a more 'random sampling' of the genome. Overall, our codon usage results based on the full C. elegans genome are similar to both the results from Stenico and coworkers' 168 known genes (D100 = 0.97) and the 90 URFs (D100 = 1.1). Duret and coworkers [33] weighted 15,425 C. elegans genes for expression levels based on their EST abundance and identified 21 favored codons used most frequently in highly expressed genes. In all cases, these optimal codons could be decoded by isoaccepting tRNAs that had the highest gene copy number in the genome, indicating that optimal codons are probably selected for translational efficiency. Likewise, Kanaya and coworkers [64] showed that, in C. elegans, ribosomal proteins and histones, selected as representatives of highly expressed genes, also use optimal codons different from those used by average genes and that these optimal codons correspond to tRNA gene copy number. AA frequencies in abundant C. elegans genes also correspond to isoaccepting tRNA gene copy number (R2 = 0.67) [33].
Therefore, in C. elegans different pictures emerge of evolutionary forces acting on codons and AAs in low to moderately expressed genes (directional mutation pressure, genome GC content) compared with abundantly expressed genes (optimal codons, tRNA copy number). In other nematodes, it is possible that a similar dichotomy exists, although we currently lack knowledge of tRNA gene copy number, and information on gene expression levels is largely limited to estimations based on EST abundance. Here, we have provided candidate optimal codons in AY, MI, OV, SR, and TS. A more detailed examination of codon usage as it relates to gene expression level in other nematodes will be possible by taking advantage of microarray and RF-PCR confirmation of transcript abundance.
Implications for phylogenetic studies and molecular biology
The extent to which average nematode genes sequences are susceptible to GC or AT shifts should sound a cautionary note for phylogenetic studies of nematode species, genes, and proteins based solely on coding sequences because convergent evolution may create confusing results. Knight and coworkers [5] noted that, 'Pairs of species with convergent GC contents might also evolve convergent protein sequences, especially at functionally unconstrained positions. For example, the frequencies of both lysine and arginine are highly (but oppositely) correlated with GC content, and lysine and arginine can easily substitute for one another in proteins.' In nematodes as well, one can envision exchanges of Lys and Arg (Figure 2).
For cloning genes of interest from various nematode species, we found that codon usage is a rapidly evolving feature such that codon usage patterns beyond within a genus comparisons are often divergent. Therefore, extrapolating assumed codon usage patterns to unsampled species in nematodes beyond the genus level is unlikely to be successful. At a practical level of species choice, cloning of orthologs and homologs of interest from species that are AT rich and have low ENC values, such as SS and MI with low ENC values, will require fewer degenerate primers than may be needed for more GC rich species such as TC and MI. Transcript abundance is also an important factor because genes suspected of high level expression are likely to exhibit a shift in their codon usage from the species average toward optimal codons selected for translational efficiency.
Conclusion
Extensive sequence datasets from one complete, one draft, and 30 partial genomes across the phylum Nematoda have been used to analyze the conservation and diversification of encoded protein families [26] and the factors effecting codon usage and bias (the present report). The undertaken comprehensive survey of observed codon usage and bias is based on 26 million codons in 32 species, making it the most extensive study for any phylum. Our data indicate that similarity between species in average codon usage is a short range phenomenon, generally rapidly diminishing beyond the genus level. Mapping codon usage changes to the phyla indicates the genera Globodera, Meloidogyne, Pristionchus, and Strongyloides have the most highly derived patterns of codon usage in nematodes, with the remaining species exhibiting less relatively divergence from an ancestral nematode pattern. There was a strong correlation between the exonic GC content and similarity in codon usage. GC content also explains much of the observed variation in the effective number of codons, a measure of codon bias, and even differences in AA frequency. Results from partial genomes assembled from ESTs and complete genomes provide generally good agreement on codon usage, although refinement will be necessary as more sequences become available. EST collections from five species have also been used as a starting point to identify potentially abundant genes and predict optimal codons. These predictions will also be refined using more accurate measures of gene expression, including microarrays and quantitative RT-PCR.
Materials and methods
Sequence acquisition and organization
To perform the first meta-analysis of the genomic biology of the phylum Nematoda [26], ESTs from 30 nematode species generated by our laboratories and others were downloaded from the dbEST division of GenBank in May 2003. For consistency, in this accompanying analysis of codon usage we used this dataset for all analyses. Sequences were collated and processed into partial genomes using the PartiGene pipeline [71,72]. Polypeptide translations were predicted using prot4EST [45,72]. Wormpep_dna121 (March 2004; Welcome Trust Sanger Institute, unpublished data) was used for C. elegans analysis, and the hybrid gene set [35] was used for C. briggsae analysis. Mitochondria can have codon usage differing from that of the nuclear genome, and therefore protein coding genes from mitochondrial genomes were eliminated from consideration. Codon usage tables for human, Saccharomyces cerevisiae, and Escherichia coli were derived from the Codon Usage Table Database [73] derived from GenBank Release 140.0 (22 March 2004 [74]).
Phylogenetic correction
Analyses of the relationships among GC content, AA, and codon usage values require statistical correction for the phylogenetic relatedness of the species being studied using phylogenetically independent contrasts [75]. To generate these contrasts, we performed the following procedures. First, to construct a phylogenetic tree independent of the transcriptomic data analyzed in this paper, we aligned 18S ribosomal RNA sequences using Clustalw [76] for all nematodes for which more than 15 kilobases of sequence was available. The 18S sequence GenBank accession numbers are available in Figure 1; the sequences from a priapulid worm and a nematomorph were used as outgroups [16] but excluded from our analysis. Alignments were trimmed to reflect only the overlapping portion of the sequences from all species analyzed. Second, this alignment, containing 1,841 base pairs/species (including gaps) and an alternative alignment excluding any region involving an insertion or deletion (1,423 base pairs/species remained), was used to estimate phylogenies from the nucleotide sequences by parsimony and maximum likelihood (with and without assumption of a molecular clock) using Phylip [77]. Third, the trees with branch lengths derived from molecular clock-based analysis were used to calculate phylogenetically independent contrasts for our parameters of interest [75]. The Phylip program 'contrasts' was used to compute the phylogenetically independent contrasts using a Brownian-motion model [78,79] of genomic evolution.
Bioinformatics
The Emboss program 'cusp' was used to calculate codon usage in the predicted translations [80]. The ENC [49] was calculated using the Emboss program 'Codon Heterozygosity (Inverse of) in Protein-coding Sequences'. A genetic distance statistic was used to quantify divergence of synonymous codon usage between species [47] follows. Let tj be the number of codons that code for the jth amino acid. We omit analysis of the nondegenerate codons Met and Trp, as well as the 'stop' codon, so that j = 1, 2 ... r, where r = 18. Furthermore, let aij and bij be the frequencies of the ith synonymous codon in the jth AA of two organisms A and B, respectively. Then, Nei's difference statistic D is defined as the following:
Investigators have used D as an empirical measure of difference, averaged over all r residues, of the codon usage between organisms [48]. There are a total of C32,2 = 496 meaningful comparisons for the entire collection of 32 species. These results are presented as an N × N square matrix and the values are presented as D × 100. For simplicity in the remainder of the text we will refer to D × 100 as D100.
Phylogenetic changes in codon usage were analyzed using the species tree derived from 18S rRNA sequences estimated by maximum likelihood with a molecular clock imposed. Partitioning a matrix of distance values on a phylogenetic tree can estimate amounts of change occurring on each branch, provided that the distance metrics obey the triangle inequality (see the discussion on page 25 of the report by Page and Holmes [81]). Because of its logarithmic operation, Nei's difference statistic D violates the triangle inequality at high values. For the phylogenetic analysis of codon usage, we substituted for D a distance measure equal to 1 - antilog(-D), which obeys the triangle inequality. Distances were partitioned on the tree topology using the cyclic neighbor-joining algorithm illustrated by Avise [82], except that the topology was specified by the prior analysis of 18S rRNA sequences.
The ENC was used to measure the degree of codon bias for a gene [49]. Because the ENC statistic is not reliable when analyzing very short sequences (20 AAs or less), 54 short translations out of a total of 70,358 were discarded from these analyses. The relative abundance of nematode codons (per species) having a statistically significant N1 context-dependent codon bias was calculated by computing the R values and the standard deviations, as described by Fedorov and coworkers [57].
Predicted expression level of a transcript (abundant, moderate, rare, and so on) was determined by counting the number of ESTs comprising the cluster. Five species from different clades that have been sampled with at least 10,000 ESTs from several life-stage libraries were selected for these analyses. Most of the cDNA libraries were constructed using the same protocols [61,83], and although the libraries generally correlate with abundance in the original biologic sample, artifacts can occur. The increase in use of a given codon for an AA in highly expressed genes (optimal codons) was considered significant when the difference of the codon distributions within that AA was statistically significant between datasets (P ≤ 0.01).
To assess the differences in calculated codon usage distributions when using partial (EST-based) as compared with whole genome data, we generated two datasets using C. elegans ESTs and compared them with the curated gene set of C. elegans (Wormpep version 121). Each EST dataset was composed of 10,000 ESTs (approximately the average number of ESTs used for the other 30 species); clustering and peptide predictions were performed using the same algorithms as for the other species.
Additional data files
The following additional data are included with the online version of this article: An Excel file containing a table that shows the nucleotide usage (%) by codon position and nematode species (Additional data file 1); an Excel file containing an N × N square matrix that shows codon usage across degenerate AAs for 25 nematode species reported as D values (Additional data file 2); a PowerPoint file containing a figure that shows the distribution of genes with various degrees of codon usage bias as measured by ENC for three species with approximately the same number of clusters but with different coding GC content (S. ratti [GC = 32%], P. trichosuri [40%], and P. pacificus [51%]; Additional data file 3); an Excel file containing a table that shows the N1 context dependent bias per species (Additional data file 4); and an Excel file containing a table that shows codon usage of abundant and less abundant translations for five nematode species (Additional data file 5).
Supplementary Material
Contributor Information
Makedonka Mitreva, Email: mmitreva@watson.wustl.edu.
Michael C Wendl, Email: mwendl@watson.wustl.edu.
John Martin, Email: jmartin@watson.wustl.edu.
Todd Wylie, Email: twylie@watson.wustl.edu.
Yong Yin, Email: yyin@watson.wustl.edu.
Allan Larson, Email: larsontl@biology.wustl.edu.
John Parkinson, Email: jparkin@sickkids.ca.
Robert H Waterston, Email: waterston@gs.washington.edu.
James P McCarter, Email: jmccarte@watson.wustl.edu.
Acknowledgements
We are thankful for assistance from Barry Shortt with statistics, Matt Dimmic with informatics, and Mark Blaxter and LaDeana Hillier with useful comments on the manuscript. Work at Washington University was supported by NIH-NIAID research grant AI 46593 to RHW and Richard K Wilson. JP was supported in part by the Wellcome Trust. The project originated while JPM was a Merck Fellow of the Helen Hay Whitney Foundation. JPM is an employee and equity holder of Divergence, Inc.
References
- Milhon JL, Tracy JW. Updated codon usage in Schistosoma. Exp Parasitol. 1995;80:353–356. doi: 10.1006/expr.1995.1046. [DOI] [PubMed] [Google Scholar]
- Duret L. Evolution of synonymous codon usage in metazoans. Curr Opin Genet Dev. 2002;12:640–649. doi: 10.1016/S0959-437X(02)00353-2. [DOI] [PubMed] [Google Scholar]
- Sueoka N. On the genetic basis of variation and heterogeneity of DNA base composition. Proc Natl Acad Sci USA. 1962;48:582–592. doi: 10.1073/pnas.48.4.582. [DOI] [PMC free article] [PubMed] [Google Scholar]
- Sueoka N. Directional mutation pressure and neutral molecular evolution. Proc Natl Acad Sci USA. 1988;85:2653–2657. doi: 10.1073/pnas.85.8.2653. [DOI] [PMC free article] [PubMed] [Google Scholar]
- Knight RD, Freeland SJ, Landweber LF. A simple model based on mutation and selection explains trends in codon and amino-acid usage and GC composition within and across genomes. Genome Biol. 2001;2:research0010. doi: 10.1186/gb-2001-2-4-research0010. [DOI] [PMC free article] [PubMed] [Google Scholar]
- Chen SL, Lee W, Hottes AK, Shapiro L, McAdams HH. Codon usage between genomes is constrained by genome-wide mutational processes. Proc Natl Acad Sci USA. 2004;101:3480–3485. doi: 10.1073/pnas.0307827100. [DOI] [PMC free article] [PubMed] [Google Scholar]
- Ikemura T. Codon usage and tRNA content in unicellular and multicellular organisms. Mol Biol Evol. 1985;2:13–34. doi: 10.1093/oxfordjournals.molbev.a040335. [DOI] [PubMed] [Google Scholar]
- Moriyama EN, Powell JR. Codon usage bias and tRNA abundance in Drosophila. J Mol Evol. 1997;45:514–523. doi: 10.1007/PL00006256. [DOI] [PubMed] [Google Scholar]
- Bulmer M. Coevolution of codon usage and transfer RNA abundance. Nature. 1987;325:728–730. doi: 10.1038/325728a0. [DOI] [PubMed] [Google Scholar]
- Sharp PM, Li WH. The codon Adaptation Index: a measure of directional synonymous codon usage bias, and its potential applications. Nucleic Acids Res. 1987;15:1281–1295. doi: 10.1093/nar/15.3.1281. [DOI] [PMC free article] [PubMed] [Google Scholar]
- Gouy M, Gautier C. Codon usage in bacteria: correlation with gene expressivity. Nucleic Acids Res. 1982;10:7055–7074. doi: 10.1093/nar/10.22.7055. [DOI] [PMC free article] [PubMed] [Google Scholar]
- Carlini DB, Chen Y, Stephan W. The relationship between third-codon position nucleotide content, codon bias, mRNA secondary structure and gene expression in the drosophilid alcohol dehydrogenase genes Adh and Adhr. Genetics. 2001;159:623–633. doi: 10.1093/genetics/159.2.623. [DOI] [PMC free article] [PubMed] [Google Scholar]
- Chamary JV, Hurst LD. Evidence for selection on synonymous mutations affecting stability of mRNA secondary structure in mammals. Genome Biol. 2005;6:R75. doi: 10.1186/gb-2005-6-9-r75. [DOI] [PMC free article] [PubMed] [Google Scholar]
- Oresic M, Dehn M, Korenblum D, Shalloway D. Tracing specific synonymous codon-secondary structure correlations through evolution. J Mol Evol. 2003;56:473–484. doi: 10.1007/s00239-002-2418-x. [DOI] [PubMed] [Google Scholar]
- Marquez R, Smit S, Knight R. Do universal codon-usage patterns minimize the effects of mutation and translation error? Genome Biol. 2005;6:R91. doi: 10.1186/gb-2005-6-11-r91. [DOI] [PMC free article] [PubMed] [Google Scholar]
- Blaxter ML, De Ley P, Garey JR, Liu LX, Scheldeman P, Vierstraete A, Vanfleteren JR, Mackey LY, Dorris M, Frisse LM. et al. A molecular evolutionary framework for the phylum Nematoda. Nature. 1998;392:71–75. doi: 10.1038/32160. [DOI] [PubMed] [Google Scholar]
- The C. elegans Sequencing Consortium. Genome sequence of the nematode C. elegans : a platform for investigating biology. Science. 1998;282:2012–2018. doi: 10.1126/science.282.5396.2012. [DOI] [PubMed] [Google Scholar]
- Blaxter ML, Raghavan N, Ghosh I, Guiliano D, Lu W, Williams SA, Slatko B, Scott AL. Genes expressed in Brugia malayi infective third stage larvae. Mol Biochem Parasitol. 1996;77:77–93. doi: 10.1016/0166-6851(96)02571-6. [DOI] [PubMed] [Google Scholar]
- Dautova M, Rosso MN, Abad P, Gommers FJ, Bakker J, Smant G. Single pass cDNA sequencing - a powerful tool to analyse gene expression in preparasitic juveniles of the southern root-knot nematode Meloidogyne incognita. Nematology. 2001;3:129–139. doi: 10.1163/156854101750236259. [DOI] [Google Scholar]
- McCarter J, Dautova Mitreva M, Martin J, Dante M, Wylie T, Rao U, Pape D, Bowers Y, Theising B, Murphy CV. et al. Analysis and functional classification of transcripts from the Nematode Meloidogyne incognita. Genome Biol. 2003;4:R26. doi: 10.1186/gb-2003-4-4-r26. [DOI] [PMC free article] [PubMed] [Google Scholar]
- Daub J, Loukas A, Pritchard DI, Blaxter M. A survey of genes expressed in adults of the human hookworm, Necator americanus. Parasitology. 2000;120:171–184. doi: 10.1017/S0031182099005375. [DOI] [PubMed] [Google Scholar]
- Mitreva M, McCarter JP, Martin J, Dante M, Wylie T, Chiapelli B, Pape D, Clifton SW, Nutman TB, Waterston RH. Comparative genomics of gene expression in the parasitic and free-living nematodes Strongyloides stercoralis and Caenorhabditis elegans. Genome Res. 2004;14:209–220. doi: 10.1101/gr.1524804. [DOI] [PMC free article] [PubMed] [Google Scholar]
- Thompson FJ, Mitreva M, Barker GL, Martin J, Waterston RH, McCarter JP, Viney ME. An expressed sequence tag analysis of the life-cycle of the parasitic nematode Strongyloides ratti. Mol Biochem Parasitol. 2005;142:32–46. doi: 10.1016/j.molbiopara.2005.03.006. [DOI] [PubMed] [Google Scholar]
- Parkinson J, Mitreva M, Hall N, Blaxter M, McCarter JP. 400000 nematode ESTs on the Net. Trends Parasitol. 2003;19:283–286. doi: 10.1016/S1471-4922(03)00132-6. [DOI] [PubMed] [Google Scholar]
- Mitreva M, Blaxter ML, Bird DM, McCarter JP. Comparative genomics of nematodes. Trends Genet. 2005;21:573–581. doi: 10.1016/j.tig.2005.08.003. [DOI] [PubMed] [Google Scholar]
- Parkinson J, Mitreva M, Whitton C, Thomson M, Daub J, Martin J, Hall N, Barrell B, Waterston RH, McCarter JP. et al. A transcriptomic analysis of the phylum Nematoda. Nat Genet. 2004;36:1259–1267. doi: 10.1038/ng1472. [DOI] [PubMed] [Google Scholar]
- Nematode Net. http://www.nematode.net/ http://www.nematode.net/
- Wylie T, Martin J, Dante M, Mitreva M, Clifton SW, Chinwalla A, Waterston RH, Wilson RK, McCarter JP. Nematode.net: a tool for navigating sequences from parasitic and free-living nematodes. Nucleic Acids Res. 2004;32:D423–D426. doi: 10.1093/nar/gkh010. [DOI] [PMC free article] [PubMed] [Google Scholar]
- Nembase. http://www.nematodes.org/ http://www.nematodes.org/
- Parkinson J, Whitton C, Schmid R, Thomson M, Blaxter M. NEMBASE: a resource for parasitic nematode ESTs. Nucleic Acids Res. 2004;32:D427–D430. doi: 10.1093/nar/gkh018. [DOI] [PMC free article] [PubMed] [Google Scholar]
- Stenico M, Lloyd AT, Sharp PM. Codon usage in Caenorhabditis elegans : delineation of translational selection and mutational biases. Nucleic Acids Res. 1994;22:2437–2446. doi: 10.1093/nar/22.13.2437. [DOI] [PMC free article] [PubMed] [Google Scholar]
- Duret L, Mouchiroud D. Expression pattern and, surprisingly, gene length shape codon usage in Caenorhabditis, Drosophila, and Arabidopsis. Proc Natl Acad Sci USA. 1999;96:4482–4487. doi: 10.1073/pnas.96.8.4482. [DOI] [PMC free article] [PubMed] [Google Scholar]
- Duret L. tRNA gene number and codon usage in the C. elegans genome are co-adapted for optimal translation of highly expressed genes. Trends Genet. 2000;16:287–289. doi: 10.1016/S0168-9525(00)02041-2. [DOI] [PubMed] [Google Scholar]
- Marais G, Duret L. Synonymous codon usage, accuracy of translation, and gene length in Caenorhabditis elegans. J Mol Evol. 2001;52:275–280. doi: 10.1007/s002390010155. [DOI] [PubMed] [Google Scholar]
- Stein LD, Bao Z, Blasiar D, Blumenthal T, Brent MR, Chen N, Chinwalla A, Clarke L, Clee C, Coghlan A. et al. The genome sequence of Caenorhabditis briggsae : a platform for comparative genomics. PLoS Biol. 2003;1:E45. doi: 10.1371/journal.pbio.0000045. [DOI] [PMC free article] [PubMed] [Google Scholar]
- Unnasch TR, Katholi CR, Coate LM. Onchocerca volvulus : frequency of codon usage. Exp Parasitol. 1992;75:457–459. doi: 10.1016/0014-4894(92)90259-D. [DOI] [PubMed] [Google Scholar]
- Hammond MP. Codon usage and gene organization in Brugia. Parasitol Res. 1994;80:173–175. doi: 10.1007/BF00933788. [DOI] [PubMed] [Google Scholar]
- Ellis J, Morrison DA, Kalinna B. Comparison of the patterns of codon usage and bias between Brugia, Echinococcus, Onchocerca and Schistosoma species. Parasitol Res. 1995;81:388–393. doi: 10.1007/BF00931499. [DOI] [PubMed] [Google Scholar]
- Fadiel A, Lithwick S, Wanas MQ, Cuticchia AJ. Influence of intercodon and base frequencies on codon usage in filarial parasites. Genomics. 2001;74:197–210. doi: 10.1006/geno.2001.6531. [DOI] [PubMed] [Google Scholar]
- Moore TA, Ramachandran S, Gam AA, Neva FA, Lu W, Saunders L, Williams SA, Nutman TB. Identification of novel sequences and codon usage in Strongyloides stercoralis. Mol Biochem Parasitol. 1996;79:243–248. doi: 10.1016/0166-6851(96)02659-X. [DOI] [PubMed] [Google Scholar]
- Fadiel AA, Lithwick S, Gamra MM. Codon usage analysis of Ascaris species influence of base and intercodon frequencies on the synonymous codon usage. J Egypt Soc Parasitol. 2002;32:625–638. [PubMed] [Google Scholar]
- Fadiel AA, Lithwick S, el-Garhy MF. Influence of parasitic life style on the patterns of codon usage and base frequencies of Ancylostoma and Necator species. J Egypt Soc Parasitol. 2002;32:657–673. [PubMed] [Google Scholar]
- Nakamura Y, Gojobori T, Ikemura T. Codon usage tabulated from the international DNA sequence databases; its status 1999. Nucleic Acids Res. 1999;27:292. doi: 10.1093/nar/27.1.292. [DOI] [PMC free article] [PubMed] [Google Scholar]
- McCarter JP, Bird DM, Mitreva M. Nematode gene sequences: update for December 2005. J Nematol. 2006;37:417–421. [PMC free article] [PubMed] [Google Scholar]
- Wasmuth JD, Blaxter ML. prot4EST: translating expressed sequence tags from neglected genomes. BMC Bioinformatics. 2004;5:187. doi: 10.1186/1471-2105-5-187. [DOI] [PMC free article] [PubMed] [Google Scholar]
- King JL, Jukes TH. Non-Darwinian evolution. Science. 1969;164:788–798. doi: 10.1126/science.164.3881.788. [DOI] [PubMed] [Google Scholar]
- Nei M. Genetic distance between populations. Am Naturalist. 1972;106:283–292. doi: 10.1086/282771. [DOI] [Google Scholar]
- Long M, Gillespie JH. Codon usage divergence of homologous vertebrate genes and codon usage clock. J Mol Evol. 1991;32:6–15. doi: 10.1007/BF02099923. [DOI] [PubMed] [Google Scholar]
- Wright F. The 'effective number of codons' used in a gene. Gene. 1990;87:23–29. doi: 10.1016/0378-1119(90)90491-9. [DOI] [PubMed] [Google Scholar]
- Powell JR, Moriyama EN. Evolution of codon usage bias in Drosophila. Proc Natl Acad Sci USA. 1997;94:7784–7790. doi: 10.1073/pnas.94.15.7784. [DOI] [PMC free article] [PubMed] [Google Scholar]
- Comeron JM, Aguade M. An evaluation of measures of synonymous codon usage bias. J Mol Evol. 1998;47:268–274. doi: 10.1007/PL00006384. [DOI] [PubMed] [Google Scholar]
- Yarus M, Folley LS. Sense codons are found in specific contexts. J Mol Biol. 1984;182:529–540. doi: 10.1016/0022-2836(85)90239-6. [DOI] [PubMed] [Google Scholar]
- Shpaer EG. Constraints on codon context in Escherichia coli genes. Their possible role in modulating the efficiency of translation. J Mol Biol. 1986;188:555–564. doi: 10.1016/S0022-2836(86)80005-5. [DOI] [PubMed] [Google Scholar]
- Gouy M. Codon contexts in Enterobacterialand coliphage genes. Mol Biol Evol. 1987;4:426–444. doi: 10.1093/oxfordjournals.molbev.a040450. [DOI] [PubMed] [Google Scholar]
- Berg OG, Silva PJN. Codon bias in Escherichia coli: the influence of codon context on mutationand selection. Nucleic Acids Res. 1997;25:1397–1404. doi: 10.1093/nar/25.7.1397. [DOI] [PMC free article] [PubMed] [Google Scholar]
- Karlin S, Mrazek J. What drives codon choices in human genes? J Mol Biol. 1996;262:459–472. doi: 10.1006/jmbi.1996.0528. [DOI] [PubMed] [Google Scholar]
- Fedorov A, Saxonov S, Gilbert W. Regularities of context-dependent codon bias in eukaryotic genes. Nucleic Acids Res. 2002;30:1192–1197. doi: 10.1093/nar/30.5.1192. [DOI] [PMC free article] [PubMed] [Google Scholar]
- Eyre-Walker A, Hurst LD. The evolution of isochores. Nat Rev Genet. 2001;2:549–555. doi: 10.1038/35080577. [DOI] [PubMed] [Google Scholar]
- Audic S, Claverie JM. The significance of digital gene expression profiles. Genome Res. 1997;7:986–995. doi: 10.1101/gr.7.10.986. [DOI] [PubMed] [Google Scholar]
- Munoz ET, Bogarad LD, Deem MW. Microarray and EST database estimates of mRNA expression levels differ: the protein length versus expression curve for C. elegans. BMC Genomics. 2004;5:30. doi: 10.1186/1471-2164-5-30. [DOI] [PMC free article] [PubMed] [Google Scholar]
- Mitreva M, Jasmer DP, Appleton J, Martin J, Dante M, Wylie T, Clifton SW, Waterston RH, McCarter JP. Gene discovery in the adenophorean nematode Trichinella spiralis: an analysis of transcription from three life cycle stages. Mol Biochem Parasitol. 2004;137:277–291. doi: 10.1016/j.molbiopara.2004.05.015. [DOI] [PubMed] [Google Scholar]
- Ikemura T. Correlation between the abundance of Escherichia coli transfer RNAs and the occurrence of the respective codons in its protein genes: a proposal for a synonymous codon choice that is optimal for the E. coli translational system. J Mol Biol. 1981;151:389–409. doi: 10.1016/0022-2836(81)90003-6. [DOI] [PubMed] [Google Scholar]
- Musto H, Romero H, Zavala A, Jabbari K, Bernardi G. Synonymous codon choices in the extremely GC-poor genome of Plasmodium falciparum: compositional constraints and translational selection. J Mol Evol. 1999;49:27–35. doi: 10.1007/PL00006531. [DOI] [PubMed] [Google Scholar]
- Kanaya S, Yamada Y, Kinouchi M, Kudo Y, Ikemura T. Codon usage and tRNA genes in eukaryotes: correlation of codon usage diversity with translation efficiency and with CG-dinucleotide usage as assessed by multivariate analysis. J Mol Evol. 2001;53:290–298. doi: 10.1007/s002390010219. [DOI] [PubMed] [Google Scholar]
- Ohama T, Yamao F, Muto A, Osawa S. Organization and codon usage of the streptomycin operon in Micrococcus luteus, a bacterium with a high genomic G + C content. J Bacteriol. 1987;169:4770–4777. doi: 10.1128/jb.169.10.4770-4777.1987. [DOI] [PMC free article] [PubMed] [Google Scholar]
- Ohama T, Muto A, Osawa S. Role of GC-biased mutation pressure on synonymous codon choice in Micrococcus luteus, a bacterium with a high genomic GC-content. Nucleic Acids Res. 1990;18:1565–1569. doi: 10.1093/nar/18.6.1565. [DOI] [PMC free article] [PubMed] [Google Scholar]
- Sueoka N. Directional mutation pressure, selective constraints, and genetic equilibria. J Mol Evol. 1992;35:95–114. doi: 10.1007/BF00182387. [DOI] [PubMed] [Google Scholar]
- Wilquet V, Van de Casteele M. The role of the codon first letter in the relationship between genomic GC content and protein amino acid composition. Res Microbiol. 1999;150:21–32. doi: 10.1016/S0923-2508(99)80043-6. [DOI] [PubMed] [Google Scholar]
- D'Onofrio G, Mouchiroud D, Aïssani B, Gautier C, Bernardi G. Correlations between the compositional properties of human genes, codon usage, and amino acid composition of proteins. J Mol Evol. 1991;32:504–510. doi: 10.1007/BF02102652. [DOI] [PubMed] [Google Scholar]
- Lobry JR. Influence of genomic G+C content on average amino-acid composition of proteins from 59 bacterial species. Gene. 1997;205:309–316. doi: 10.1016/S0378-1119(97)00403-4. [DOI] [PubMed] [Google Scholar]
- Parkinson J, Guiliano DB, Blaxter M. Making sense of EST sequences by CLOBBing them. BMC Bioinformatics. 2002;3:31. doi: 10.1186/1471-2105-3-31. [DOI] [PMC free article] [PubMed] [Google Scholar]
- Parkinson J, Anthony A, Wasmuth J, Schmid R, Hedley A, Blaxter M. PartiGene: constructing partial genomes. Bioinformatics. 2004;20:1398–1404. doi: 10.1093/bioinformatics/bth101. [DOI] [PubMed] [Google Scholar]
- Codon Usage Table Database. http://www.kazusa.or.jp/codon/ http://www.kazusa.or.jp/codon/
- Nakamura Y, Gojobori T, Ikemura T. Codon usage tabulated from international DNA sequence databases: status for the year 2000. Nucleic Acids Res. 2000;28:292. doi: 10.1093/nar/28.1.292. [DOI] [PMC free article] [PubMed] [Google Scholar]
- Felsenstein J. Phylogenies and the comparative method. Am Naturalist. 1985;125:1–12. doi: 10.1086/284325. [DOI] [PubMed] [Google Scholar]
- Chenna R, Sugawara H, Koike T, Lopez R, Gibson TJ, Higgins DG, Thompson JD. Multiple sequence alignment with the Clustal series of programs. Nucleic Acids Res. 2003;31:3497–3500. doi: 10.1093/nar/gkg500. [DOI] [PMC free article] [PubMed] [Google Scholar]
- Felsenstein J. PHYLIP - Phylogeny Inference Package (Version 3.2). Cladistics. 1989;5:164–166. [Google Scholar]
- Cavalli-Sforza LL, Edwards AWF. Phylogenetic analysis: models and estimation procedures. Evolution. 1967;32:550–570. doi: 10.2307/2406616. [DOI] [PubMed] [Google Scholar]
- Edwards AWF, Cavalli-Sforza LL. In: Phenetic and Phylogenetic Classification. Heywood VH, McNeill, editor. Vol. 6. London: Systematics Association; 1964. Reconstruction of evolutionary trees. pp. 67–76. [Google Scholar]
- Rice P, Longden I, Bleasby A. EMBOSS: the European Molecular Biology Open Software Suite. Trends Genet. 2000;16:276–277. doi: 10.1016/S0168-9525(00)02024-2. [DOI] [PubMed] [Google Scholar]
- Page RDM, Holmes EC. Molecular Evolution: a Phylogenetic Approach. Oxford, UK: Blackwell Science; 1998. [Google Scholar]
- Avise JC. Molecular Markers Natural History and Evolution. New York: Chapman and Hall; 1994. [Google Scholar]
- Mitreva M, Elling AA, Dante M, Kloek AP, Kalyanaraman A, Aluru S, Clifton SW, Bird DM, Baum TJ, McCarter JP. A survey of SL1-spliced transcripts from the root-lesion nematode Pratylenchus penetrans. Mol Gen Genomics. 2004;272:138–148. doi: 10.1007/s00438-004-1054-0. [DOI] [PubMed] [Google Scholar]
Associated Data
This section collects any data citations, data availability statements, or supplementary materials included in this article.