Abstract
Ca2+ release during excitation–contraction (EC) coupling varies across the left ventricular free wall. Here, we investigated the mechanisms underlying EC coupling differences between mouse left ventricular epicardial (Epi) and endocardial (Endo) myocytes. We found that diastolic and systolic [Ca2+]i was higher in paced Endo than in Epi myocytes. Our data indicated that differences in action potential (AP) waveform between Epi and Endo cells only partially accounted for differences in [Ca2+]i. Rather, we found that the amplitude of the [Ca2+]i transient, but not its trigger – the Ca2+ current – was larger in Endo than in Epi cells. We also found that spontaneous Ca2+ spark activity was about 2.8-fold higher in Endo than in Epi cells. Interestingly, ryanodine receptor type 2 (RyR2) protein expression was nearly 2-fold higher in Endo than in Epi myocytes. Finally, we observed less Na+–Ca2+ exchanger function in Endo than in Epi cells, which was associated with decreased Ca2+ efflux during the AP; this contributed to higher diastolic [Ca2+]i and SR Ca2+ in Endo than in Epi cells during pacing. We propose that transmural differences in AP waveform, SR Ca2+ release, and Na+–Ca2+ exchanger function underlie differences in [Ca2+]i and EC coupling across the left ventricular free wall.
During cardiac excitation–contraction (EC) coupling, brief openings of voltage-gated, dihydropyridine-sensitive L-type Ca2+ channels allow small amounts of Ca2+ to enter specialized regions of the ventricular myocyte where the junctional sarcoplasmic reticulum (SR) comes into close apposition with the sarcolemma (Niggli & Lederer, 1990; López-López et al. 1995; Santana et al. 1996). Because of the limited volume of this space, small Ca2+ entry events through L-type Ca2+ channels raise [Ca2+]i high enough in these compartments to activate adjacent ryanodine-sensitive Ca2+ channels (RyRs) in the junctional SR by the mechanism of Ca2+-induced Ca2+ release (CICR) (Fabiato, 1983). Synchronous activation of multiple RyRs during EC coupling produces a global [Ca2+]i transient that activates contractile proteins and initiates contraction. Closure of L-type Ca2+ channels during repolarization of the action potential terminates SR Ca2+ release, thus allowing the SR Ca2+-ATPase and the sarcolemmal Na+–Ca2+ exchanger to re-sequester or extrude Ca2+ from the cytosol, respectively. This decreases [Ca2+]i and causes relaxation.
Most studies examining EC coupling in cardiac myocytes have not discriminated between cells from different regions of the ventricle. Although it is likely that CICR underlies SR Ca2+ release during EC coupling in all ventricular myocytes, recent studies suggest that left ventricular endocardial (Endo) myocytes have larger [Ca2+]i transients than epicardial (Epi) myocytes (Figueredo et al. 1993; McIntosh et al. 2000; Fowler et al. 2005). The general view (‘AP model’) is that regional differences in [Ca2+]i result from differences in the AP waveform of Epi and Endo cells (Volk et al. 1999; McIntosh et al. 2000; Kaprielian et al. 2002). In this model, the longer APs of Endo cells allow for larger Ca2+ influx and hence increased [Ca2+]i and SR Ca2+ release (McIntosh et al. 2000). Thus, differences in [Ca2+]i between Endo and Epi cells are determined exclusively by differences in the AP waveform. However, regional differences in Ca2+ transport proteins, including L-type Ca2+ channels (Wang & Cohen, 2003), SERCA2a (Laurita et al. 2003), and Na+–Ca2+ exchanger (Xiong et al. 2005), which may also contribute to regional variations in [Ca2+]i have been reported in multiple species. The functional implications of regional differences in AP and Ca2+ transport proteins on ventricular EC coupling are unclear.
Recent advances in transgenic technology have made the mouse an important model for the study of Ca2+ signalling and EC coupling in heart. However, the mechanisms determining heterogeneous [Ca2+]i and EC coupling in mouse left ventricular free wall have not been examined. In this study, we investigated the mechanisms underlying differences in EC coupling between mouse Endo and Epi myocytes. We combined epifluorescence photometry and confocal imaging with patch-clamp techniques to measure [Ca2+]i, membrane currents and voltage in mouse Endo and Epi cells. We found that, in addition to a longer AP, Endo myocytes also have higher SR Ca2+ load and decreased Na+–Ca2+ exchanger function. Acting in concert, these differences result in higher [Ca2+]i and SR Ca2+ load, which ultimately leads to higher Ca2+ release during EC coupling in Endo than in Epi myocytes.
Methods
Ventricular myocyte dissociation
Animals were handled in strict accordance to the guidelines of the University of Washington Institutional Animal Care and Use Committee. Hearts were obtained from adult (Balb/c) mice (25–30 g) killed with pentobarbital (100 mg kg−1 given i.p.). Epi and Endo myocytes were obtained from the inner-most (Endo) and outer-most (Epi) regions of the left ventricular free wall – thus discarding the mid-myocardial layer – as previously described (Brunet et al. 2004) using standard enzymatic methods (Ufret-Vincenty et al. 2001). After dissociation, Epi and Endo myocytes were maintained in Dubelcco's MEM at room temperature (25°C) until used. All experiments were performed at 37°C.
Electrophysiology
Ionic currents and membrane potentials were recorded using an Axopatch 200B patch-clamp amplifier (Axon Instruments). Signals were digitized and stored on a computer running the pCLAMP 8 software suite (Axon Instruments). Analysis of electrophysiological records was performed using the Clampfit module of pCLAMP 8. To record APs the Axopatch 200B amplifier in its current-clamp mode was used. APs were recorded while cells were superfused with a solution (solution A) of the following composition (mm): 140 NaCl, 5 KCl, 10 Hepes, 10 glucose, 2 CaCl2, and 1 MgCl2 (pH = 7.4). The patch-pipette solution used to record APs included (mm): 110 potassium aspartate, 30 KCl, 10 Hepes, 5 ATP-Mg and 10 NaCl (pH = 7.3). With this solution, patch electrodes had resistances ranging from 0.8 to 1.2 MΩ. The 15 mV tip potential produced by this solution was corrected offline. APs were evoked by a brief (4 ms) injection of depolarizing current (1–4 nA).
The series resistance compensation circuitry of the Axopatch 200B was used in all voltage-clamp experiments to compensate for about 60% of the series resistance. In some experiments we used the AP clamp technique to measure [Ca2+]i during the physiological Epi and Endo AP. In these experiments, stored Endo and Epi APs were used as the voltage command to depolarize myocytes. The representative APs used in AP clamp experiments were recorded from Epi and Endo cells at a frequency of 1 Hz as described above. For experiments measuring Ca2+ currents (ICa) cells were superfused with solution A. After whole-cell voltage clamp was achieved, the superfusion solution was changed to one containing (mm): 140 NaCl, 5 CsCl, 2 CaCl2, 1 MgCl2, 10 glucose, 10 Hepes and 0.010 TTX. The pipette solution used in these experiments contained (mm): 130 CsCl, 10 TEA-Cl, 5 Mg-ATP and 10 Hepes. Identical solutions (without TTX) were used for simultaneous recording of ICa and [Ca2+]i and for experiments measuring sodium–calcium exchanger currents (INCX).
Field stimulation
Field stimulation was performed via two platinum wires (0.5 cm separation) placed at the bottom of the perfusion chamber. An IonOptix Myopacer (IonOptix Corp, Milton, MA, USA) stimulator was used to deliver square voltage pulses (4 ms duration) with amplitude of 1.5 × threshold at a frequency of 1 Hz.
Measurements of [Ca2+]i
We measured changes in [Ca2+]i using the fluorescent Ca2+ indicator Fluo-4. For experiments that involved the simultaneous measurement of electrophysiological signals and [Ca2+]i, cells were loaded with the penta-potassium salt of Fluo-4 (50 μm) through the patch pipette. For measurement of [Ca2+]i that did not involved patch-clamping (i.e. Ca2+ sparks, SR Ca2+ load in paced and un-stimulated cells), myocytes were loaded with the membrane-permeable acetoxymethyl-ester form of Fluo-4 (Fluo-4 AM) as previously described (Santana et al. 2002). Photometry experiments were performed on the stage of an Olympus IX-70 inverted microscope. In this microscope, fluorescence signals were collected through a 40 × (NA = 1.35; Olympus) lens and detected by an IonOptix photometry system coupled to the IX-70.
Confocal imaging of whole-cell [Ca2+]i and Ca2+ sparks was performed using a Bio-Rad Radiance 2000 confocal system (Cambridge, MA, USA) coupled to a Nikon TE300 inverted microscope equipped with a Nikon 60 × oil immersion lens (NA = 1.4). This system was operated with a computer running Lasersharp 2000 (v. 4.0) software. Images were analysed with custom software written in IDL language (Research Systems, Boulder, CO, USA). Ca2+ sparks were identified using a computer algorithm similar to the one described by Cheng et al. (1999). Ca2+ spark mass was calculated as described elsewhere (Hollingworth et al. 2001). Fluorescence signals were calibrated as using the Fmax equation (referred to as eqn (1)) (Maravall et al. 2000):
| (1) |
where F is fluorescence, Fmax is the fluorescence intensity of Fluo-4 in the presence of a saturating free Ca2+ concentration, Kd is the dissociation constant of Fluo-4 (600 nm), and Rf (110) is this indicator's Fmax/Fmin. Fmin is the fluorescence intensity of Fluo-4 in a solution where the Ca2+ concentration is 0. Kd and Rf values for Fluo-4 were determined in vitro using standard methods (Woodruff et al. 2002). These values are similar to those reported by others (Woodruff et al. 2002). Fmax was determined at the end of each experiment by exposing cells to solution A (see above) to which the Ca2+ ionophore ionomycin (10 μm), 2,3-butanedione monoxime (BDM, 20 mm; to prevent contraction), and 20 mm external Ca2+ had been added.
The amplitude of the [Ca2+]i transient evoked by the application of a Ca2+- and Na+-free (substituted with N-methyl-d-glucamine) solution containing 20 mm caffeine (10 s; via a picospritzer) was used as an indicator of SR Ca2+ content (Santana et al. 1997). To ensure steady-state SR Ca2+ load, cells were subjected to a minimum of 10 preconditioning pulses (1 Hz) before caffeine was applied. For experiments where SR Ca2+ load and INCX were recorded simultaneously, a caffeine (20 mm)-containing external solution (solution A above) with CsCl replacing KCl was used.
Western blot analysis
Protein from Endo and Epi tissue was extracted as described elsewhere (Rossow et al. 2004). The protein concentration of the supernatant was determined using the bicinchronic acid method (Smith et al. 1985) with bovine serum albumin (BSA) as a standard. Fifty micrograms of total protein was loaded on a 4–15% Tris-HCl polyacrylamide gel and run with an appropriate molecular weight standard at 100 V for 1 h. Fractionated protein was transferred to a polyvinylidene difluoride (PVDF) membrane using a Mini-trans Blot Cell (Bio-Rad Laboratories, USA) at 100 V for 1 h at 4°C. Blots were blocked in TBS–Tween (20 mm Tris pH 8.0, 150 mm NaCl and 0.05% Tween-20) with 5% non-fat milk for 1 h at 25°C. After blocking, blots were incubated with a primary antibody specific to RyR2 (Calbiochem) in TBS–Tween with 1% non-fat milk at 25°C for 1 h. Following incubation with the primary antibody, blots were washed 3 times with TBS–Tween for 10 min and incubated with a horseradish peroxidase (HRP) conjugated secondary antibody diluted in TBS–Tween for 1 h. This was followed by incubation with Super-signal West Pico Chemiluminescent Substrate (Pierce Biotechnology, Inc., USA). RyR2 channel protein was quantified by densitometry using an Alphaimager 2200 analysis system and software (Alpha Innotech Corp., USA).
RT-PCR
RNA was extracted from the Endo and Epi of the left ventricle of wild-type BalbC mice as previously described (Rossow et al. 2004). Reverse transcription-polymerase chain reaction (RT-PCR) was conducted using the SuperScript One-step PCR master mix as per the manufacture's protocol (Invitrogen, Carlsbad, CA, USA). RT-PCR primers were as follows: NCX-1 (GenBank accession no. M15077) sense nt-170; antisense nt-470; β-actin (GenBank accession no. V01217); sense nt-2384 and antisense nt-3071.
Statistics
Data are presented as mean ± standard error of the mean (s.e.m.). Two-sample comparisons were made using a Student's t test; multi-group comparisons were made with an ANOVA, which, if necessary, was followed by Tukey's multi-comparison test. A P value less than 0.05 was considered significant. Asterisks (*) used in the figures indicate a significant difference between groups.
Results
Regional differences in AP and [Ca2+]i
APs and [Ca2+]i were simultaneously recorded in Epi and Endo myocytes. Membrane potential was monitored using the patch-clamp technique in the current-clamp configuration. To monitor [Ca2+]i cells were dialysed with the fluorescent Ca2+ indicator Fluo-4 via the patch pipette. Fluo-4 fluorescence was recorded using photometry.
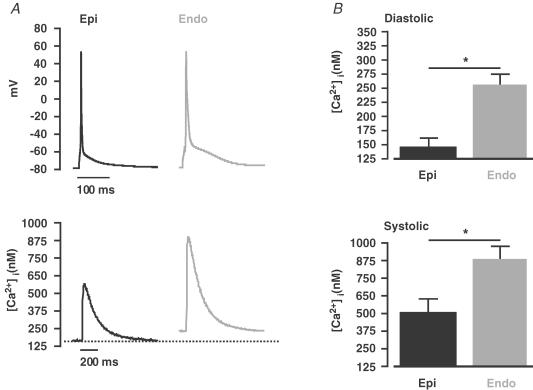
Figure 1A shows steady-state (1 Hz) APs and whole-cell [Ca2+]i transients recorded from representative Epi and Endo cells. We found that the AP duration at 90% repolarization (APD90) was approximately 2-fold longer in Endo (93.1 ± 5.4 ms, n = 7) than in Epi myocytes (43.8 ± 6.1 ms, n = 8, P < 0.05; Fig. 1A). Two important differences between the [Ca2+]i transients of Epi and Endo cells were observed (Fig. 1A and B). First, the amplitude of the global [Ca2+]i transient of Endo myocytes was about 1.7-fold larger (886 ± 88 nm, n = 7) than that of Epi myocytes (506 ± 91 nm, n = 8, P < 0.05). Second, diastolic [Ca2+]i was higher in Endo (256 ± 20 nm, n = 8) than in Epi myocytes (148 ± 18 nm, n = 7, P < 0.05). Interestingly, differences in diastolic [Ca2+]i were observed only during stimulation; diastolic [Ca2+]i was similar in quiescent Endo (156 ± 21 nm, n = 15) and Epi cells (150 ± 19 nm, n = 18, P < 0.05). The time of decay of the [Ca2+]i transient to 50% of its amplitude, which covers the portion of [Ca2+]i transient in which the SR Ca2+-ATPase dominates Ca2+ clearance from the cytosol (Balke et al. 1994; Terracciano et al. 2001), was similar in Endo (194.3 ± 8.2 ms, n = 7) and Epi (183.1 ± 4.8 ms, n = 8, P > 0.05) cells. This is consistent with the view that SR Ca2+-ATPase function is similar in Epi and Endo cells. Although [Ca2+]i has been examined in Epi and Endo myocytes from other species (Cordeiro et al. 2004; Fowler et al. 2005), this is the first report of heterogeneous [Ca2+]i in the mouse left ventricle. Thus, these data suggest that regional differences in [Ca2+]i are a conserved feature of the mammalian ventricular myocardium.
Figure 1. Regional differences in [Ca2+]i and AP duration across the left ventricular free wall.
A, representative steady-state (1 Hz) APs (top) and [Ca2+]i transients (bottom) from Epi (black) and Endo (grey) cells. The dotted line marks the diastolic [Ca2+]i in Epi cells. B, the bar plot shows the mean ± s.e.m. of the diastolic [Ca2+]i and peak systolic [Ca2+]i transient in Epi and Endo cells. *P < 0.05.
AP waveform contributes to differences in EC coupling between Epi and Endo cells
Next, we tested the hypothesis that variations in the AP waveform between Epi and Endo cells underlie differences in [Ca2+]i between these cells. To do this, we used the patch-clamp technique in the voltage-clamp configuration to sequentially depolarize (1 Hz) Epi and Endo cells with a stored Epi and Endo AP waveform. Membrane currents and [Ca2+]i were recorded simultaneously during these experiments.
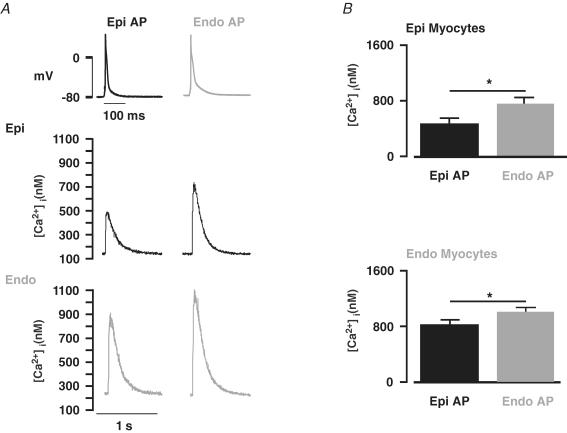
Figure 2A shows a set of [Ca2+]i transients from a representative Epi cell depolarized with Epi and Endo APs. As expected, Epi cells stimulated with the Epi AP produced [Ca2+]i transients of similar amplitude (478 ± 78 nm, n = 9) to those obtained during the current-clamp experiments described above (506 ± 91 nm, n = 8, P < 0.05). If differences in [Ca2+]i between Epi and Endo cells were due exclusively to differences in AP waveform, then [Ca2+]i transients of Epi cells stimulated with Endo APs should resemble Endo, not Epi, myocytes. Indeed, we found that Epi cells stimulated with Endo APs had larger [Ca2+]i transients than when stimulated with Epi APs (Fig. 2A). However, the amplitude of these [Ca2+]i transients (707 ± 59 nm, n = 9) were not as large as the amplitude of the [Ca2+]i transients in current-clamped Endo cells (886 ± 78 nm, n = 7, P < 0.05). Interestingly, during pacing, diastolic [Ca2+]i was similar in Epi cells regardless of the depolarizing AP (Endo AP = 150 ± 35 nmversus Epi AP = 155 ± 21 nm, n = 9, P > 0.05).
Figure 2. Regional differences in AP waveform contributes to differences in [Ca2+]i between Endo and Epi myocytes.
A, [Ca2+]i transients from representative Epi (middle row) and Endo cells (lower row). These [Ca2+]i transients were evoked in Epi and Endo cells with the Epi (left) and Endo (right) AP shown in the top row. B, bar plots of the mean ± s.e.m. of the amplitude of the [Ca2+]i transient in Epi and Endo cells evoked with the Epi and Endo AP. *P < 0.05.
We also depolarized Endo cells with each AP waveform. As with Epi cells, Endo APs evoked [Ca2+]i transients in Endo cells of similar amplitude (975 ± 85 nm, n = 8) to those observed in current-clamped Endo cells (886 ± 78 nm, n = 7, P > 0.05). Although Endo myocytes depolarized with Epi APs had smaller [Ca2+]i transients than with Endo APs, the transients were larger than those evoked during field stimulation of Epi cells (P < 0.05). Similar to Epi cells, Endo myocytes had similar diastolic [Ca2+]i during pacing regardless of the AP used (Endo AP = 250 ± 28 nmversus Epi AP = 255 ± 21 nm, n = 8, P > 0.05). Taken together, these data indicate that differences in AP waveform contribute to, but do not sufficiently account for the differences in [Ca2+]i transients observed between Epi and Endo cells.
SR Ca2+ release is larger during EC coupling in Endo than in Epi cells
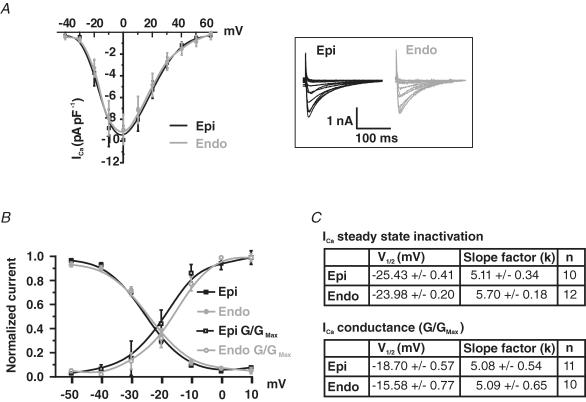
We investigated the possibility that differences in ICa and SR Ca2+ release between Epi and Endo cells contribute to the differences in [Ca2+]i observed in these cells. First, we examined the amplitude and voltage dependence of ICa in voltage-clamped Epi and Endo cells (Fig. 3). ICa was activated by 200 ms depolarizations from a holding potential of −80 mV to voltages ranging from −70 to +60 mV. Using this protocol we found that the amplitude of ICa density was similar in Epi and Endo cells (Fig. 3A). Consistent with this, the voltage dependence of ICa conductance and steady-state inactivation were similar in these cells (Fig. 3B). Accordingly, the slope of the Boltzmann function used to fit the data and the voltage at which 50% (V1/2) of ICa conductance or inactivation was observed was similar in Endo and Epi cells (Fig. 3C). These data indicate that the ICa of Endo and Epi myocytes are not different and therefore cannot account for differences in [Ca2+]i observed in these cells.
Figure 3. Similar ICa in Epi and Endo cells.
A, current–voltage relationship of ICa in Epi and Endo cells. Representative ICa traces are shown to the right (inset). B, ICa steady-state inactivation is shown as a plot of normalized peak current (I/Imax) as a function of conditioning potential. For the voltage dependence of activation, peak ICa currents at test potentials between −50 and +10 mV were converted into conductances (G = ICa/[test pulse potential – reversal potential of ICa]), normalized (G/Gmax), and plotted as a function of test potential. Smooth lines represent best-fit curves to the data determined by a least-squares method using a Boltzmann equation, y = [(A1− A2)/1 + e(V–V1/2/k)], where A1, A2, V1/2, and k are the initial value, final value, the voltage at which 50% of the current or conductance was observed, and the slope factor. For the steady-state inactivation of ICa in Epi cells A1 = 1, A2 = 0, V1/2 = −25 mV and k = 5. For the steady-state inactivation of ICa in Endo cells A1 = 1, A2 = 0, V1/2 = −24 mV and k = 6. For the conductance–voltage relationship of ICa in Epi cells A1 = 0, A2 = 1, V1/2 = −19 mV and k = 5. For the conductance–voltage relationship of ICa in Endo cells A1 = 0, A2 = 1, V1/2 = −16 mV and k = 5. C, summary of the parameters used to fit the conductance and steady-state inactivation relationships of ICa in Epi and Endo cells. *P < 0.05.
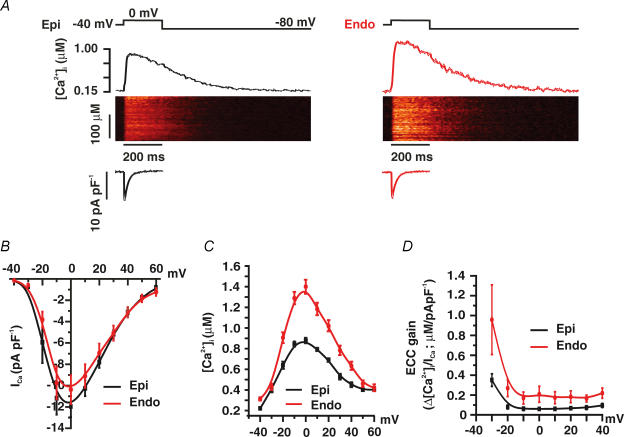
Next, we examined the voltage dependence of ICa and SR Ca2+ release in Epi and Endo cells (Fig. 4). In these experiments, [Ca2+]i and ICa were simultaneously recorded in voltage-clamped Epi and Endo cells. [Ca2+]i was monitored in Fluo-4-loaded myocytes using a confocal microscope. To achieve steady-state SR Ca2+ load, 10 pre-conditioning pulses (100 ms duration) from −80 to 0 mV (1 Hz) were applied just prior to the test pulse. Test pulses began with a slow depolarization (0.08 mV ms−1) from −80 to −40 mV, where the cell was held for 50 ms to inactivate Na+ currents. Cells were then depolarized from this interim holding potential to voltages ranging from −40 to +60 mV. Consistent with the electrophysiological data described above, we found that ICa density was similar in Epi and Endo cells (Fig. 4A and B). In contrast, [Ca2+]i transients were larger in Endo (n = 6) than in Epi cells (n = 7) at most voltages examined (Fig. 4C; P < 0.05). We calculated EC coupling gain in Endo and Epi cells (Fig. 4D). EC coupling gain, defined here as the maximum change in [Ca2+]i divided by the peak ICa density at any given voltage, gives information on the efficacy of ICa to trigger SR Ca2+ release. As Fig. 4D illustrates, we found that EC coupling gain was larger in Endo than in Epi cells over a broad range of voltages (P < 0.05). Together, these data suggest that the amplitude of the evoked [Ca2+]i transient and the amount of Ca2+ released by a given ICa is larger in Endo than in Epi cells during EC coupling.
Figure 4. Higher SR Ca2+ release during EC coupling in Endo than in Epi cells.
A, representative ICa and confocal line-scan images from Epi and Endo cells. ICa and [Ca2+]i transients were evoked by a 200 ms voltage step from −40 to 0 mV. Traces showing the time course of ICa and [Ca2+]i in these cells are shown below and above the line-scan images, respectively. B, current–voltage relationships of ICa in Epi and Endo cells. C, voltage dependence of the amplitude of the [Ca2+]i transient in Epi and Endo cells. D, voltage dependence of EC coupling (ECC) gain.
The frequency and amplitude of Ca2+ sparks is larger in Endo than in Epi cells
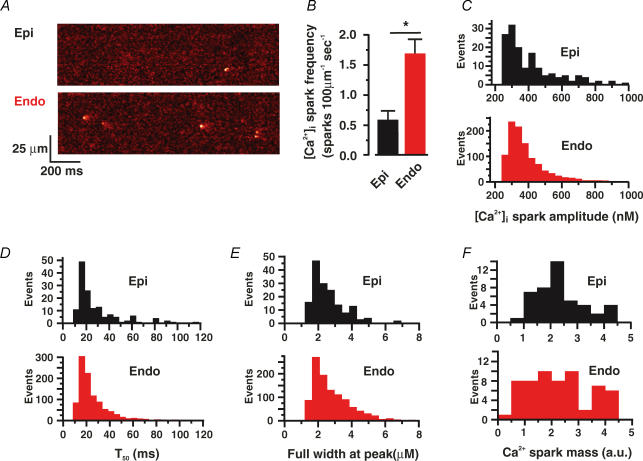
To gain insight into the mechanisms regulating SR Ca2+ release in Endo and Epi cells, we examined Ca2+ sparks, the elementary events of EC coupling, in these cells. Ca2+ sparks were recorded in quiescent Epi and Endo cells loaded with Fluo4-AM using a confocal microscope in the line-scan mode. Note that the cells used in these experiments were never stimulated prior to the experiments. Figure 5A shows representative line-scan images of spontaneous Ca2+ sparks in quiescent Epi and Endo cells. We found that spontaneous Ca2+ spark frequency was 2.85-fold higher in Endo (1.68 ± 0.24 sparks (100 μm)−1 s−1, n = 114) than in Epi cells (0.59 ± 0.15 sparks (100 μm)−1 s−1, n = 47; P < 0.05) (Fig. 5B). Ca2+ spark amplitude (Epi, 422 ± 18 nm; Endo, 353 ± 38 nm), duration (time to 50% amplitude: Epi, 28 ± 2 ms, n = 148; Endo, 26 ± 1 ms, n = 1046), and spatial spread (full width at peak: Epi, 2.5 ± 0.1 μm; Endo, 2.4 ± 0.1 μm) were similar in these cells (P > 0.05) (Fig. 5C–E). Accordingly, Ca2+ spark mass, an indicator of how much Ca2+ is released during a Ca2+ spark (Hollingworth et al. 2001), was similar in Endo and Epi cells (P > 0.05) (Fig. 5F). These data suggest that, while the spatio-temporal properties of Ca2+ sparks in Endo and Epi cells are similar, spontaneous Ca2+ spark activity is higher in Endo than in Epi cells.
Figure 5. Higher Ca2+ spark activity in Endo than in Epi cells.
A, representative confocal line-scan images from Epi and Endo cells. B, bar plot of the mean ± s.e.m. of the frequency of Ca2+ sparks. Histogram plots of amplitude (C), decay time to 50% amplitude (T50) (D), full width at peak amplitude (E), and Ca2+ spark mass (F). *P < 0.05.
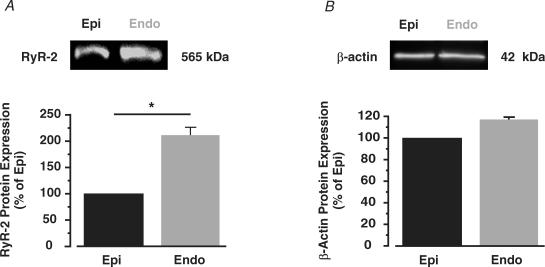
Differences in Ca2+ spark activity between Endo and Epi cells could be due to differences in the expression of ryanodine receptors. To examine this, we used Western blot analysis to compare the relative expression of ryanodine receptor type 2 (RyR2) protein, the predominant RyR isoform expressed in heart (Fill & Copello, 2002), in Endo and Epi tissue. As shown in Fig. 6, we detected approximately 2-fold higher RyR2 protein in Endo than in Epi tissue (n = 5 hearts, P < 0.05), indicating expression of this channel is higher in Endo than in Epi cells.
Figure 6. Higher RyR2 expression in Endo than in Epi tissue.
Western blot analysis of RyR2 (A) and β-actin (B) protein in Epi and Endo tissue. The bar plots show the amount of RyR2 and β-actin protein in Endo relative to Epi cells. *P < 0.05.
SR Ca2+ content is higher in field-stimulated Endo than Epi cells
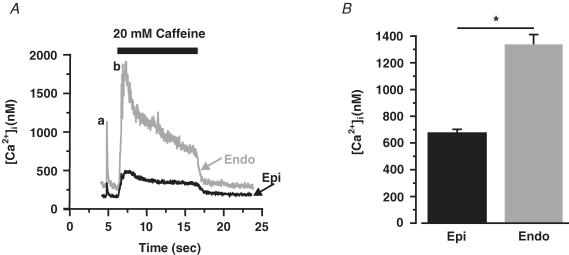
We examined SR Ca2+ load in Endo and Epi cells. The amplitude of the global [Ca2+]i transient induced by caffeine was used as an indicator of SR Ca2+ content. First, we investigated SR Ca2+ load in paced Endo and Epi myocytes. In these experiments, cells were loaded with Fluo-4 AM and field stimulated (1 Hz) for at least 10 s before caffeine (20 mm) was applied. This protocol ensured steady-state SR Ca2+ loading at the time of caffeine application (Santana et al. 1997). As shown in Fig. 7, the amplitude of the caffeine-induced [Ca2+]i transient was nearly 2-fold larger in paced Endo than in Epi cells (680 ± 23 nm, Epi, n = 20 versus 1337 ± 76 nm, Endo, n = 10; P < 0.05). These data suggest that, during stimulation, SR Ca2+ load is larger in Endo than in Epi cells.
Figure 7. Higher SR Ca2+ load in stimulated Endo than in Epi cells.
A, representative field (a) and caffeine-induced [Ca2+]i transients (b) in Epi (black) and Endo (red) cells. B, bar plot of the amplitude of the caffeine-induced [Ca2+]i transient in Epi and Endo cells. *P < 0.05.
We also examined SR Ca2+ load in quiescent Endo and Epi cells. In these experiments we used myocytes that had not been paced prior to the application of caffeine. Interestingly, and in contrast to stimulated cells, we found that SR Ca2+ load was lower in quiescent Endo (1116 ± 70 nm, n = 57) than in Epi cells (1779 ± 286 nm, n = 38; P < 0.05).
Lower Na+–Ca2+ exchanger function in Endo than in Epi cells
A recent report suggested differential expression and function of the Na+–Ca2+ exchanger across the left ventricular wall of the human heart (Xiong et al. 2005). Thus, we investigated if differential Na+–Ca2+ exchanger function contributes to higher [Ca2+]i in Endo than in Epi cells in the mouse. To do this, we voltage-clamped Epi and Endo cells and recorded Na+–Ca2+ exchanger currents (INCX) evoked by caffeine-induced [Ca2+]i transients in these cells. [Ca2+]i was simultaneously recorded using photometry. Caffeine was applied after the application of 10 conditioning pulses (100 ms; 1 Hz) from −80 to 0 mV to ensure steady-state SR Ca2+ load.
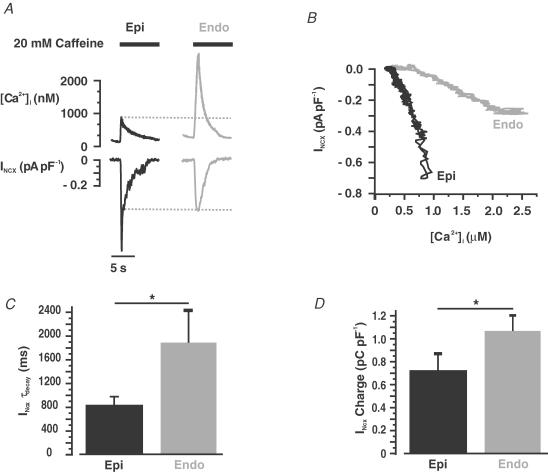
At −80 mV, application of caffeine (20 mm) induced a large, cell-wide [Ca2+]i transient and an inward INCX (Fig. 8A). Interestingly, INCX was larger in Epi (0.66 ± 0.10 pA pF−1, n = 19) than in Endo cells (0.42 ± 0.05 pA pF−1, n = 25, P < 0.05) even though the amplitude of the [Ca2+]i transient, which provides the Ca2+ that drives the INCX, was larger in Endo than in Epi cells. Indeed, examination of a plot of INCX as a function of [Ca2+]i (Fig. 8B; data from the same representative cells included in Fig. 8A) revealed that INCX amplitude was larger in Epi than in Endo cells at virtually all [Ca2+]i recorded. Similar results were obtained in seven additional experiments.
Figure 8. Larger Ca2+-release-induced INCX in Epi than in Endo cells.
A, representative caffeine-induced [Ca2+]i transients and INCX in Epi (left) and Endo (right) cells. B, relationship of [Ca2+]i and INCX in the representative Epi and Endo cells shown in A. Bar plots of INCX time constant of decay (τdecay) (C) and charge (D) in Epi and Endo cells. *P < 0.05.
We fitted the decaying phase of INCX with a single exponential function to determine whether there were differences in the rate of decay of this current between Epi and Endo cells. Indeed, we found that INCX decayed faster in Epi (τdecay = 840.9 ± 135.5 ms, n = 13) than in Endo cells (τdecay = 1888.9 ± 542.5 ms, n = 29; P < 0.05) (Fig. 8C). Taken together, these data indicate that Na+–Ca2+ exchanger function is higher in mouse Epi than in Endo cells.
It is important to note that while the amplitude and rate of decay of the INCX were higher and faster in Epi cells, charge movement via INCX – an indicator of SR Ca2+ content (Trafford et al. 1999) – was higher in Endo (1.1 ± 0.1 pC pF−1, n = 29) than in Epi cells (0.8 ± 0.1 pC pF−1, n = 13) (Fig. 8D). These data provide additional support to the hypothesis that SR Ca2+ load is higher in Endo than in Epi cells (see also Fig. 7 above).
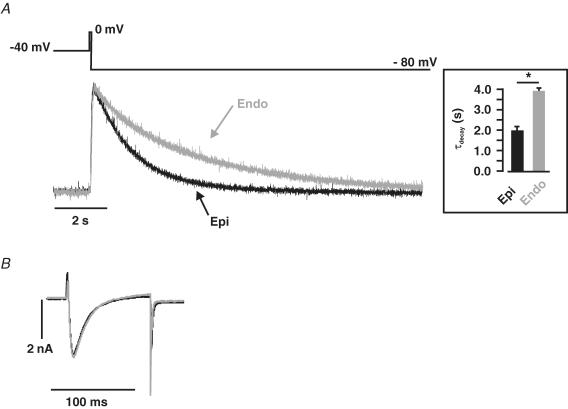
Finally, we tested the capacity of the Na+–Ca2+ exchanger to extrude Ca2+ in Endo and Epi cells. In these experiments, we measured the time course of a transient, global [Ca2+]i increase produced by ICa in Epi and Endo myocytes treated with thapsigargin (1 μm) and caffeine (20 mm) to eliminate SR Ca2+ release (Fig. 9). The [Ca2+]i transient recorded under these conditions reflects the time course of Ca2+ entry via ICa and Ca2+ extrusion, which is mediated predominantly by the Na+–Ca2+ exchanger (Balke et al. 1994; Terracciano et al. 2001). Cells were voltage-clamped and held at −40 mV to inactivate Na+ currents. Epi and Endo cells were depolarized for 100 ms to a test potential of 0 mV followed by a hyperpolarization to −80 mV. [Ca2+]i was simultaneously recorded using photometry.
Figure 9. Faster rate of Ca+ extrusion via the Na+–Ca2+ exchanger in Epi than in Endo cells.
A, representative [Ca2+]i records from Epi (black) and Endo (red) cells. Transients were evoked be the voltage protocol shown above the [Ca2+]i traces. Briefly, Epi and Endo cells treated with thapsigargin and caffeine (to eliminate SR Ca2+ accumulation) were depolarized for 100 ms from −40 to 0 mV, after which the cells were hyperpolarized to −80 mV. The inset shows the mean ± s.e.m. of the rate of decay of the [Ca2+]i transient. B, the ICa evoked by this protocol are shown (with an expanded time scale) below the [Ca2+]i traces. *P < 0.05.
Figure 9 shows ICa and normalized [Ca2+]i records from representative Epi (black trace) and Endo (grey trace) cells. First, note that ICa (i.e. Ca2+ influx; Fig. 9B) was similar in Endo and Epi cells (P > 0.05). As expected, the amplitude of these [Ca2+]i transients was similar in Endo and Epi cells (P > 0.05; data not shown). However, the decay phase of these [Ca2+]i transients (Fig. 9A) was well-fitted with a single exponential function. Interestingly, we found that the rate of decay of the [Ca2+]i transient was faster in Epi (τ = 1.8 ± 0.2 s, n = 6) than in Endo (τ = 4.1 ± 0.3 s, n = 7; P < 0.05) cells. These data suggest that Na+–Ca2+ exchanger activity is lower in Endo than in Epi cells.
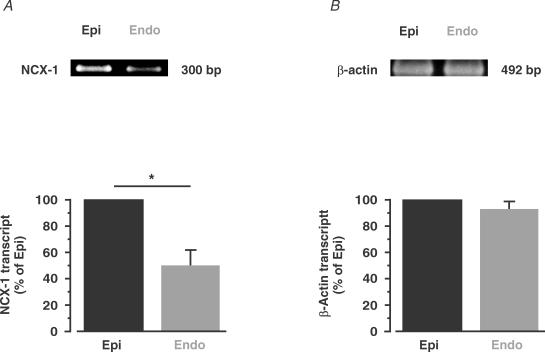
To investigate the molecular mechanisms underlying differential Na+–Ca2+ exchanger function in Epi and Endo cells, we used RT-PCR analysis to determine the relative amount of Na+–Ca2+ exchanger transcript in these cells (Fig. 10). Consistent with the [Ca2+]i data shown above (see Fig. 9), we found nearly 50% higher Na+–Ca2+ exchanger transcript levels in Epi than in Endo cells (n = 4 hearts; P < 0.05). These findings suggest that Endo myocytes express less Na+–Ca2+ exchanger transcript than Epi cells.
Figure 10. Higher Na+–Ca2+ exchanger transcript levels in Epi than in Endo cells.
RT-PCR gel of Na+–Ca2+ exchanger (NCX-1; A) and β-actin (B) transcript in Epi and Endo cells. B, the bar plots show the relative level of these proteins in Endo (compared with Epi). *P < 0.05.
Discussion
In this study, we investigated the mechanisms that underlie differential Ca2+ signalling and EC coupling across the mouse left ventricular free wall. Our data indicate that there are three major differences between mouse Endo and Epi cells that result in heterogeneous Ca2+ signalling. First, we found that differences in AP waveform are partially responsible for variations in [Ca2+]i between Endo and Epi cells. Second, higher SR Ca2+ release in Endo than in Epi cells contributes, at least in part, to higher [Ca2+]i during EC coupling in Endo cells. Third, higher Na+–Ca2+ exchanger expression and function in Epi than in Endo cells, results in decreased Ca2+ extrusion and hence enhanced [Ca2+]i in Endo cells during pacing. We discuss the implications of these findings below.
We found that Ca2+ extrusion via the Na+–Ca2+ exchanger is lower in mouse Endo myocytes than in those from the Epi. Our data suggest the interesting possibility that this difference in Na+–Ca2+ exchanger activity could be due to lower expression of this protein in Endo than in Epi cells. As noted above, similar results have been reported in human (Xiong et al. 2005). Note, however, that a recent study suggested that Na+–Ca2+ exchanger activity is similar in rat Endo and Epi myocytes (Fowler et al. 2005). Thus, differential Na+–Ca2+ exchanger function across the left ventricular wall is not a conserved feature of the mammalian myocardium. In those species where there is heterogeneity in Na+–Ca2+ exchanger activity (e.g. mouse, human), the expectation is that Ca2+ extrusion via Na+–Ca2+ exchanger is decreased in Endo compared with Epi cells, even when depolarizing waveforms (i.e. APs) are the same. During stimulation, the lower Na+–Ca2+ exchanger function in Endo cells, together with the larger Ca2+ influx expected during their longer AP (Sah et al. 2001, 2002), could conspire to maintain [Ca2+]i at a higher level in Endo than in Epi cells. Our observation of higher diastolic [Ca2+]i in Endo than in Epi cells during stimulation supports this hypothesis.
While differences in Na+–Ca2+ exchanger function between mouse Endo and Epi myocytes can have a dramatic impact on the rate of Ca2+ transport during stimulation, under steady-state resting conditions, [Ca2+]i is not affected by differences in magnitude of Na+–Ca2+ exchanger function. For example, note that although the time courses are different (i.e. longer in Endo cells), the [Ca2+]i in Epi and Endo cells towards the end of the 12 s traces presented in Fig. 9A are similar (normalization is irrelevant in this instance as resting [Ca2+]i is not different between these cells). Indeed, assuming that Ca2+ influx via other Ca2+ influx pathways (i.e. L-type Ca2+ channels) is negligible in Endo and Epi cells at a resting potential (∼−75 mV) (McDonald et al. 1994), [Ca2+]i is largely determined by the Na+–Ca2+ exchanger stoichiometry (assumed here to be 3 Na+: 1 Ca2+), membrane potential, external Ca2+, and the Na+ gradient across the sarcolemma as described by the following equation (referred to as eqn (2)) (Blaustein & Lederer, 1999; Blaustein et al. 2004).
| (2) |
where [Ca2+]o is the external Ca2+ concentration (2 mm), [Na+]i is the intracellular Na+ concentration (assumed to be 15 mm), [Na+]o is the extracellular Na+ concentration (140 mm), V is the resting membrane potential (∼−75 mV; see Fig. 1 above), F is the Faraday constant (9.65 × 10⁴ C mol−1), R is the gas constant (8.31 V C mol−1 K−1), and T is the absolute temperature (∼298°K). Using these values and eqn (2), we calculated a resting [Ca2+]i of ∼153 nm, a value that is similar to the average resting [Ca2+]i measured using a fluorescent Ca2+ indicator in Epi (∼150 nm) and Endo (∼156 nm) myocytes. The similarity between the calculated and experimentally determined [Ca2+]i has two important implications. First, it suggests that our assumptions that [Na+]i (∼15 mm) and Na+–Ca2+ exchanger stoichiometry are similar in mouse Epi and Endo cells are reasonable. Indeed, in rat, [Na+]i has been reported to be similar in Endo and Epi cells (Fowler et al. 2005). Second, resting [Ca2+]i in Endo and Epi myocytes is dependent on the Na+–Ca2+ exchanger activity.
Interestingly, a recent study (Cook et al. 1997) has suggested that [Na+]i varies across the left ventricular wall of rabbit. In this species, sub-Epi cells (∼8 mm) have a higher [Na+]i than sub-Endo cells (∼6 mm). Equation (2) above predicts that – in the absence of any significant activity by other Ca2+ transport mechanisms, differences in membrane potential, and/or Na+–Ca2+ exchanger stoichiometry – differential [Na+]i would produce variations in [Ca2+]i: cells with higher [Na+]i would have higher [Ca2+]i. However, contrary to what eqn (2) would predict, resting [Ca2+]i (Chamunorwa & O'Neill, 1995) is similar in rabbit sub-Epi and sub-Endo cells even though resting membrane potential is similar in these cells (Cook et al. 1997). These data suggest that regulation of resting [Ca2+]i in rabbit myocytes is complex, possibly involving multiple transport mechanisms and/or differences in the stoichiometry of the Na+–Ca2+ exchanger between sub-Endo and sub-Epi cells. Future experiments should examine the mechanisms controlling resting [Ca2+]i in rabbit sub-Endo and sub-Epi cells.
Increased Na+–Ca2+ exchanger function in Epi cells would potentially result in higher Ca2+ influx via reverse mode of the exchanger (Bers et al. 1990; Leblanc & Hume, 1990; Vites & Wasserstrom, 1996). However, the magnitude of Ca2+ influx via the Na+–Ca2+ exchanger depends on a number of factors including [Ca2+]i, [Na+]i, and AP waveform (Blaustein & Lederer, 1999). Note that the relatively short duration and negative plateau phase (∼−50 to −60 mV) of the mouse AP probably minimizes Ca2+ influx via the Na+–Ca2+ exchanger.
Our data indicate that L-type Ca2+ channel function is similar in mouse Epi and Endo myocytes. This confirms recent reports in rat suggesting lack of ICa heterogeneity across the left ventricular wall (Volk & Ehmke, 2002). Although L-type Ca2+ channel function is similar in mouse Endo and Epi cells, the longer phase 1 and overall longer duration of the Endo AP would result in higher Ca2+ influx in these than in the Epi cells (Sah et al. 2001, 2002). A mathematical model of the rabbit AP predicts a similar increase in Ca2+ influx in response to an increase in AP duration (Puglisi & Bers, 2001). Our data suggest that increased Ca2+ influx – and decreased Ca2+ extrusion – underlies higher [Ca2+]i, which would contribute to the higher SR Ca2+ load observed in paced Endo than in Epi cells. Recent studies (Cheng et al. 1996; Lukyanenko et al. 1996; Santana et al. 1997) have suggested that higher SR Ca2+ load in Endo than in Epi cells could contribute to higher ryanodine receptor activity and consequently SR Ca2+ release during EC coupling in Endo than in Epi cells.
Although the amount of Ca2+ released during each Ca2+ spark (i.e. Ca2+ spark mass) was similar in mouse Endo and Epi cells, spontaneous Ca2+ spark rate was higher in quiescent Endo than in Epi cells. This suggests that Ca2+ release is higher in mouse Endo than in Epi cells. Since our data indicate that Ca2+ uptake by the SR Ca2+-ATPase function is similar in mouse Endo and Epi cells, the higher Ca2+ spark rate in quiescent Endo than in Epi cells should decrease SR Ca2+ load (Lukyanenko et al. 2001; Trafford et al. 2001). Accordingly, we found that SR Ca2+ load was lower in quiescent Endo than in Epi cells.
The higher spontaneous Ca2+ spark activity in quiescent Endo and Epi cells was surprising because resting [Ca2+]i was similar in these cells. This indicates that differences in Ca2+ spark activity between Endo and Epi cells could not be simply attributed to differences in resting [Ca2+]i between these cells. Similarly, we found larger SR Ca2+ release during EC coupling in Endo than in Epi cells. Indeed, we found that Endo cells express more RyR2 protein than Epi cells. Thus, it is intriguing to speculate that higher RyR2 expression in Endo than in Epi cells contributes to higher Ca2+ release in Endo than in Epi cells. Future studies should investigate the relationship between differential RyR2 expression, SR Ca2+ release and EC coupling across the left ventricular wall.
It is important to note that while regional differences in [Ca2+]i in the mammalian ventricle have been observed in multiple mammalian species, a comparison of our results in mouse with other studies suggests that exact mechanisms underlying these differences vary amongst species. For example, in canine, there is no heterogeneity in SR Ca2+ release (and EC coupling gain) across the left ventricular free wall (Cordeiro et al. 2004). Whether Ca2+ currents (L- and/or T-type) vary between canine Endo and Epi myocytes is unclear, however. Although one study suggested that L- and T-type Ca2+ currents are larger in Endo than in Epi cells (Wang & Cohen, 2003), two others have not (Li et al. 2002; Cordeiro et al. 2004). Future studies are required to resolve these discrepancies. Furthermore, in canine, SR Ca2+-ATPase function is lower in Endo than in Epi cells (Laurita et al. 2003; Katra & Laurita, 2005). In rat, ICa (Volk & Ehmke, 2002) and Na+–Ca2+ exchanger (Fowler et al. 2005) do not vary across the left ventricular wall. Here we show that, in mouse, ICa is also similar in Epi and Endo cells. However, in mouse and human (Xiong et al. 2005), Na+–Ca2+ exchanger is higher in Epi than in Endo cells. Taken together, these findings suggest a diversity in the mechanisms underlying heterogeneous [Ca2+]i across the left ventricular free wall.
To conclude, collectively, our findings indicate that the ‘AP model’ does not sufficiently explain heterogeneous EC coupling across the mouse left ventricular free wall. We propose that increased Ca2+ influx due to longer AP and decreased Ca2+ efflux via Na+–Ca2+ exchanger results in increased diastolic Ca2+ and hence SR Ca2+ load in Endo cells. This, in conjunction with elevated SR Ca2+ release, conspires to increase diastolic and systolic [Ca2+]i during EC coupling in Endo cells.
Acknowledgments
This work was supported by NIH grant HL070556. We would like to thank Drs Gregory C. Amberg, Madeline Nieves, and Manuel F. Navedo for helpful suggestions and reading this manuscript.
References
- Balke CW, Egan TM, Wier WG. Processes that remove calcium from the cytoplasm during excitation–contraction coupling in intact rat heart cells. J Physiol. 1994;474:447–462. doi: 10.1113/jphysiol.1994.sp020036. [DOI] [PMC free article] [PubMed] [Google Scholar]
- Bers DM, Lederer WJ, Berlin JR. Intracellular Ca transients in rat cardiac myocytes: role of Na-Ca exchange in excitation-contraction coupling. Am J Physiol. 1990;258:C944–C954. doi: 10.1152/ajpcell.1990.258.5.C944. [DOI] [PubMed] [Google Scholar]
- Blaustein MP, Kao JP, Matteson DR. Cellular Physiology. Philadelphia: Elsevier Mosby; 2004. [Google Scholar]
- Blaustein MP, Lederer WJ. Sodium/calcium exchange: its physiological implications. Physiol Rev. 1999;79:763–854. doi: 10.1152/physrev.1999.79.3.763. [DOI] [PubMed] [Google Scholar]
- Brunet S, Aimond F, Guo W, Li H, Eldstrom J, Fedida D, Yamada KA, Nerbonne JM. Heterogeneous expression of repolarizing, voltage-gated K+ currents in adult mouse ventricles. J Physiol. 2004;559:103–120. doi: 10.1113/jphysiol.2004.063347. [DOI] [PMC free article] [PubMed] [Google Scholar]
- Chamunorwa JP, O'Neill SC. Regional differences in rest decay and recoveries of contraction and the calcium transient in rabbit ventricular muscle. Pflugers Arch. 1995;430:195–204. doi: 10.1007/BF00374650. [DOI] [PubMed] [Google Scholar]
- Cheng H, Lederer MR, Lederer WJ, Cannell MB. Calcium sparks and [Ca2+]i waves in cardiac myocytes. Am J Physiol. 1996;270:C148–C159. doi: 10.1152/ajpcell.1996.270.1.C148. [DOI] [PubMed] [Google Scholar]
- Cheng H, Song LS, Shirokova N, Gonzalez A, Lakatta EG, Rios E, Stern MD. Amplitude distribution of calcium sparks in confocal images: theory and studies with an automatic detection method. Biophys J. 1999;76:606–617. doi: 10.1016/S0006-3495(99)77229-2. [DOI] [PMC free article] [PubMed] [Google Scholar]
- Cook SJ, Chamunorwa JP, Lancaster MK, O'Neill SC. Regional differences in the regulation of intracellular sodium and in action potential configuration in rabbit left ventricle. Pflugers Arch. 1997;433:515–522. doi: 10.1007/s004240050307. [DOI] [PubMed] [Google Scholar]
- Cordeiro JM, Greene L, Heilmann C, Antzelevitch D, Antzelevitch C. Transmural heterogeneity of calcium activity and mechanical function in the canine left ventricle. Am J Physiol Heart Circ Physiol. 2004;286:H1471–H1479. doi: 10.1152/ajpheart.00748.2003. [DOI] [PubMed] [Google Scholar]
- Fabiato A. Calcium-induced release of calcium from the cardiac sarcoplasmic reticulum. Am J Physiol. 1983;245:C1–C14. doi: 10.1152/ajpcell.1983.245.1.C1. [DOI] [PubMed] [Google Scholar]
- Figueredo VM, Brandes R, Weiner MW, Massie BM, Camacho SA. Endocardial versus epicardial differences of intracellular free calcium under normal and ischemic conditions in perfused rat hearts. Circ Res. 1993;72:1082–1090. doi: 10.1161/01.res.72.5.1082. [DOI] [PubMed] [Google Scholar]
- Fill M, Copello JA. Ryanodine receptor calcium release channels. Physiol Rev. 2002;82:893–922. doi: 10.1152/physrev.00013.2002. [DOI] [PubMed] [Google Scholar]
- Fowler MR, Naz JR, Graham MD, Bru-Mercier G, Harrison SM, Orchard CH. Decreased Ca2+ extrusion via Na+/Ca2+ exchange in epicardial left ventricular myocytes during compensated hypertrophy. Am J Physiol Heart Circ Physiol. 2005;288:H2431–H2438. doi: 10.1152/ajpheart.01069.2004. [DOI] [PubMed] [Google Scholar]
- Hollingworth S, Peet J, Chandler WK, Baylor SM. Calcium sparks in intact skeletal muscle fibers of the frog. J General Physiol. 2001;118:653–678. doi: 10.1085/jgp.118.6.653. [DOI] [PMC free article] [PubMed] [Google Scholar]
- Kaprielian R, Sah R, Nguyen T, Wickenden AD, Backx PH. Myocardial infarction in rat eliminates regional heterogeneity of AP profiles, Ito K+ currents, and [Ca2+]i transients. Am J Physiol Heart Circ Physiol. 2002;283:H1157–H1168. doi: 10.1152/ajpheart.00518.2001. [DOI] [PubMed] [Google Scholar]
- Katra RP, Laurita KR. Cellular mechanism of calcium-mediated triggered activity in the heart. Circ Res. 2005;96:535–542. doi: 10.1161/01.RES.0000159387.00749.3c. [DOI] [PubMed] [Google Scholar]
- Laurita KR, Katra R, Wible B, Wan X, Koo MH. Transmural heterogeneity of calcium handling in canine. Circ Res. 2003;92:668–675. doi: 10.1161/01.RES.0000062468.25308.27. [DOI] [PubMed] [Google Scholar]
- Leblanc N, Hume JR. Sodium current-induced release of calcium from cardiac sarcoplasmic reticulum. Science. 1990;248:372–376. doi: 10.1126/science.2158146. [DOI] [PubMed] [Google Scholar]
- Li GR, Lau CP, Ducharme A, Tardif JC, Nattel S. Transmural action potential and ionic current remodeling in ventricles of failing canine hearts. Am J Physiol Heart Circ Physiol. 2002;283:H1031–H1041. doi: 10.1152/ajpheart.00105.2002. [DOI] [PubMed] [Google Scholar]
- López-López JR, Shacklock PS, Balke CW, Wier WG. Local calcium transients triggered by single L-type calcium channel currents in cardiac cells. Science. 1995;268:1042–1045. doi: 10.1126/science.7754383. [DOI] [PubMed] [Google Scholar]
- Lukyanenko V, Gyorke I, Gyorke S. Regulation of calcium release by calcium inside the sarcoplasmic reticulum in ventricular myocytes. Pflugers Arch. 1996;432:1047–1054. doi: 10.1007/s004240050233. [DOI] [PubMed] [Google Scholar]
- Lukyanenko V, Viatchenko-Karpinski S, Smirnov A, Wiesner TF, Gyorke S. Dynamic regulation of sarcoplasmic reticulum Ca2+ content and release by luminal Ca2+-sensitive leak in rat ventricular myocytes. Biophys J. 2001;81:785–798. doi: 10.1016/S0006-3495(01)75741-4. [DOI] [PMC free article] [PubMed] [Google Scholar]
- McDonald TF, Pelzer S, Trautwein W, Pelzer DJ. Regulation and modulation of calcium channels in cardiac, skeletal, and smooth muscle cells. Physiol Rev. 1994;74:365–507. doi: 10.1152/physrev.1994.74.2.365. [DOI] [PubMed] [Google Scholar]
- McIntosh MA, Cobbe SM, Smith GL. Heterogeneous changes in action potential and intracellular Ca2+ in left ventricular myocyte sub-types from rabbits with heart failure. Cardiovasc Res. 2000;45:397–409. doi: 10.1016/s0008-6363(99)00360-0. [DOI] [PubMed] [Google Scholar]
- Maravall M, Mainen ZF, Sabatini BL, Svoboda K. Estimating intracellular calcium concentrations and buffering without wavelength ratioing. Biophys J. 2000;78:2655–2667. doi: 10.1016/S0006-3495(00)76809-3. [DOI] [PMC free article] [PubMed] [Google Scholar]
- Niggli E, Lederer WJ. Voltage-independent calcium release in heart muscle. Science. 1990;250:565–568. doi: 10.1126/science.2173135. [DOI] [PubMed] [Google Scholar]
- Puglisi JL, Bers DM. LabHEART: an interactive computer model of rabbit ventricular myocyte ion channels and Ca transport. Am J Physiol Cell Physiol. 2001;281:C2049–C2060. doi: 10.1152/ajpcell.2001.281.6.C2049. [DOI] [PubMed] [Google Scholar]
- Rossow CF, Minami E, Chase EG, Murry CE, Santana LF. NFATc3-induced reductions in voltage-gated K+ currents after myocardial infarction. Circ Res. 2004;94:1340–1350. doi: 10.1161/01.RES.0000128406.08418.34. [DOI] [PubMed] [Google Scholar]
- Sah R, Ramirez RJ, Backx PH. Modulation of Ca2+ release in cardiac myocytes by changes in repolarization rate: role of phase-1 action potential repolarization in excitation-contraction coupling. Circ Res. 2002;90:165–173. doi: 10.1161/hh0202.103315. [DOI] [PubMed] [Google Scholar]
- Sah R, Ramirez RJ, Kaprielian R, Backx PH. Alterations in action potential profile enhance excitation–contraction coupling in rat cardiac myocytes. J Physiol. 2001;533:201–214. doi: 10.1111/j.1469-7793.2001.0201b.x. [DOI] [PMC free article] [PubMed] [Google Scholar]
- Santana LF, Chase EG, Votaw VS, Nelson MT, Greven R. Functional coupling of calcineurin and protein kinase A in mouse ventricular myocytes. J Physiol. 2002;544:57–69. doi: 10.1113/jphysiol.2002.020552. [DOI] [PMC free article] [PubMed] [Google Scholar]
- Santana LF, Cheng H, Gomez AM, Cannell MB, Lederer WJ. Relation between the sarcolemmal Ca2+ current and Ca2+ sparks and local control theories for cardiac excitation-contraction coupling. Circ Res. 1996;78:166–171. doi: 10.1161/01.res.78.1.166. [DOI] [PubMed] [Google Scholar]
- Santana LF, Kranias EG, Lederer WJ. Calcium sparks and excitation–contraction coupling in phospholamban-deficient mouse ventricular myocytes. J Physiol. 1997;503:21–29. doi: 10.1111/j.1469-7793.1997.021bi.x. [DOI] [PMC free article] [PubMed] [Google Scholar]
- Smith PK, Krohn RI, Hermanson GT, Mallia AK, Gartner FH, Provenzano MD, Fujimoto EK, Goeke NM, Olson BJ, Klenk DC. Measurement of protein using bicinchoninic acid. Anal Biochem. 1985;150:76–85. doi: 10.1016/0003-2697(85)90442-7. [DOI] [PubMed] [Google Scholar]
- Terracciano CM, Philipson KD, MacLeod KT. Overexpression of the Na+/Ca2+ exchanger and inhibition of the sarcoplasmic reticulum Ca2+-ATPase in ventricular myocytes from transgenic mice. Cardiovasc Res. 2001;49:38–47. doi: 10.1016/s0008-6363(00)00205-4. [DOI] [PubMed] [Google Scholar]
- Trafford AW, Diaz ME, Eisner DA. A novel, rapid and reversible method to measure Ca buffering and time-course of total sarcoplasmic reticulum Ca content in cardiac ventricular myocytes. Pflugers Arch. 1999;437:501–503. doi: 10.1007/s004240050808. [DOI] [PubMed] [Google Scholar]
- Trafford AW, Diaz ME, Eisner DA. Coordinated control of cell Ca2+ loading and triggered release from the sarcoplasmic reticulum underlies the rapid inotropic response to increased L-type Ca2+ current. Circ Res. 2001;88:195–201. doi: 10.1161/01.res.88.2.195. [DOI] [PubMed] [Google Scholar]
- Ufret-Vincenty CA, Baro DJ, Lederer WJ, Rockman HA, Quinones LE, Santana LF. Role of sodium channel deglycosylation in the genesis of cardiac arrhythmias in heart failure. J Biol Chem. 2001;276:28197–28203. doi: 10.1074/jbc.M102548200. [DOI] [PubMed] [Google Scholar]
- Vites AM, Wasserstrom JA. Ca2+ influx via Na-Ca exchange and ICa can both trigger transient contractions in cat ventricular myocytes. Ann N Y Acad Sci. 1996;779:521–524. doi: 10.1111/j.1749-6632.1996.tb44826.x. [DOI] [PubMed] [Google Scholar]
- Volk T, Ehmke H. Conservation of L-type Ca2+ current characteristics in endo- and epicardial myocytes from rat left ventricle with pressure-induced hypertrophy. Pflugers Arch. 2002;443:399–404. doi: 10.1007/s004240100712. [DOI] [PubMed] [Google Scholar]
- Volk T, Nguyen TH, Schultz JH, Ehmke H. Relationship between transient outward K+ current and Ca2+ influx in rat cardiac myocytes of endo- and epicardial origin. J Physiol. 1999;519:841–850. doi: 10.1111/j.1469-7793.1999.0841n.x. [DOI] [PMC free article] [PubMed] [Google Scholar]
- Wang HS, Cohen IS. Calcium channel heterogeneity in canine left ventricular myocytes. J Physiol. 2003;547:825–833. doi: 10.1113/jphysiol.2002.035410. [DOI] [PMC free article] [PubMed] [Google Scholar]
- Woodruff ML, Sampath AP, Matthews HR, Krasnoperova NV, Lem J, Fain GL. Measurement of cytoplasmic calcium concentration in the rods of wild-type and transducin knock-out mice. J Physiol. 2002;542:843–854. doi: 10.1113/jphysiol.2001.013987. [DOI] [PMC free article] [PubMed] [Google Scholar]
- Xiong W, Tian Y, Disilvestre D, Tomaselli GF. Transmural heterogeneity of Na+–Ca2+ exchange. Evidence for differential expression in normal and failing hearts. Circ Res. 2005;97:207–209. doi: 10.1161/01.RES.0000175935.08283.27. [DOI] [PubMed] [Google Scholar]


