

Abstract
Upon activation by agonist, the type A γ-aminobutyric acid receptor (GABAR) ‘gates’, allowing chloride ions to permeate membranes and produce fast inhibition of neurons. There is no consensus kinetic model for the GABAR gating mechanism. We expressed human α1β1γ2S GABARs in HEK 293 cells and recorded single channel currents in the cell-attached configuration using various GABA concentrations (50–5000 μm). Closed and open events occurred individually and in clusters that had at least three different modes that were distinguishable by open probability (PO): High (PO = 0.73), Mid (PO = 0.50), and Low (PO = 0.21). We used a critical time to isolate shorter bursts of openings and to thus eliminate long-lived, desensitized events. Bursts from all three modes contained three closed and three open components. We employed maximum likelihood fitting, autocorrelation analysis and macroscopic current simulation to distinguish kinetic schemes. The ‘core’ gating scheme for most models contained two closed states that preceded an open state (C1⇌ C2⇌ O1). The two best-fitting models had a third closed state connected to C1 and a second open state (O2) connected to C2. The third open state, whose occupancy varied greatly between modes, could be connected either to O2 or C2. We estimated rate constants for two identical, independent GABA binding steps by globally fitting data across GABA concentrations ranging from 50 to 1000 μm. For the most highly ranked model the binding rate constants were: k+ = 3 μm−1 s−1 and k– = 272 s−1 (KD = 91 μm).
The type-A γ-aminobutyric acid receptor (GABAR), a ligand-gated ion channel, mediates fast inhibition in every region of the mammalian brain and is the target of a wide spectrum of pharmacological agents. As a restraint of neuronal excitability, GABARs prevent propagation of generalized seizures (Baulac et al. 2001; Wallace et al. 2001) and regulate memory formation (Bailey et al. 2002) and entry into rapid eye movement sleep (Sanford et al. 2003). Drugs that augment GABA-ergic inhibition include anticonvulsants and anxiolytics (e.g. benzodiazepines, barbiturates) (Kucken et al. 2000; Steinbach & Akk, 2001), anaesthetics (e.g. propofol, isoflurane) (Koltchine et al. 1999; Krasowski et al. 2001), and ethanol (Smith & Gong, 2004). Drugs that diminish GABAR inhibition are currently being studied as memory-enhancing agents for the treatment of Alzheimer's dementia (Sternfeld et al. 2004). Illuminating the gating mechanism of the GABAR is an important initial step in understanding its physiological role in the central nervous system as well as the mechanisms of action of several drug classes.
The GABAR is a member of the pentameric, ‘cys-loop’ receptor-channel family (Kash et al. 2004). There are 16 homologous subunits that can form GABARs (α1-6, β1-3, γ1-3, δ, ɛ, π and θ), and this potential for structural diversity permits the specialization of functional properties in different brain regions. Not all subunit combinations form functional ion channels, and subunit expression in the brain is tightly controlled, both spatially and temporally, corresponding to level of development, disease state, or even pharmacological modification (Steiger & Russek, 2004). In most cases functional receptors require the presence of α and β subunits, both of which affect the gating properties of the channel (Gingrich et al. 1995; Fisher & Macdonald, 1997). The most common stoichiometry in the adult brain is believed to be two α-, two β- and one γ-subunit(s) (Sieghart et al. 1999).
Fully assembled receptors contain two transmitter binding sites located in the extracellular domain, one at each β–α interface (plus–minus, by analogy to AChBP) (Cromer et al. 2002). After binding two molecules of neurotransmitter, the GABAR undergoes a global isomerization (‘gates’) allowing chloride ions to flow through the pore. Several reports have shown that the fully liganded GABAR gating mechanism is complex, but no consensus model exists. Fast application of GABA to macropatches excised from neurons or transiently transfected cells demonstrates rapid activation and multiphasic decay and desensitization kinetics consistent with multiple closed states (Maconochie et al. 1994; Jones & Westbrook, 1995; Haas & Macdonald, 1999). Single channel studies of both native and recombinant GABARs suggest a kinetic scheme containing up to 10 closed (C) states and three open (O) states (Weiss & Magleby, 1989; Twyman et al. 1990; Maconochie et al. 1994; Jones & Westbrook, 1995; Haas & Macdonald, 1999; Burkat et al. 2001; Steinbach & Akk, 2001).
Here we identify simple models for GABAR gating that were derived from analyses of single channel currents from human α1β1γ2S GABARs transiently expressed in HEK 293 cells. We dissected GABAR gating into three modes based on open probability (PO), and then used maximum likelihood methods to rank models, each of which incorporated multiple open and closed states and described the steady-state kinetic activity observed in each mode. Finally, we distinguished models based on their abilities to reproduce the kinetics of transient, macroscopic currents observed in a previous study in which pulses of saturating concentrations of GABA were applied to excised patches containing the same receptor subtype as we used in our experiments (McClellan & Twyman, 1999).
Methods
Cell culture and subunit expression
Human embryonic kidney (HEK) 293 cells were maintained in Dulbecco's minimal essential medium (DMEM) supplemented with 10% fetal bovine serum (FBS) and 1% penicillin–streptomycin (PS), pH 7.4. All cultures were incubated at 37°C and 5% CO2.
Human α1, β1 and γ2S GABAR subunits (generously provided by Neil Harrison, Weill Medical College of Cornell University, New York) in the pCIS expression vector were transiently transfected using the calcium phosphate precipitation method. Cultures were incubated with transfection medium for 8–24 h, after which the medium was replaced with DMEM supplemented with 1% FBS and 1% PS to limit cell growth without affecting expression of functional channels. Cells were allowed to recover for at least 7 hours and were then used in experiments for the next 24–72 h.
Single channel recording
Single channel records were obtained in the cell-attached configuration at room temperature (∼23°C). The bath solution contained (mm): 140 NaCl, 5 KCl, 1 MgCl2, 2 CaCl2, 10 glucose, 10 Hepes; the pipette solution contained (mm): 120 NaCl, 5 KCl, 10 MgCl2, 0.1 CaCl2, 10 glucose, 10 Hepes. Solutions were adjusted to pH 7.4 with NaOH before the addition of agonist. GABA stock solutions were stored frozen in pipette solution and were diluted on the day of the experiments.
Pipette electrodes were pulled from borosilicate glass capillaries (World Precision Instruments, Sarasota, FL, USA), coated with Sylgard 184 (Dow Corning, Midland, MI, USA), and fire-polished to 8–12 MΩ when filled with the pipette solution. The pipette potential was held at +80 mV. To determine the single channel conductance, the single channel current amplitude was measured in 20 mV steps, between −80 and +80 mV. The single channel conductance was calculated as the slope of the current–voltage relationship.
Single channel currents were amplified and low-pass filtered to 10 kHz with the Axopatch 200B amplifier (Axon Instruments, Inc., Union City, CA, USA), digitized at 20 kHz using a National Instruments PCI-6024E acquisition board and QuB software (http://www.qub.buffalo.edu) and stored directly on a PC hard-drive.
Approach to modelling GABAR activation
We employed a stepwise approach to modelling GABAR gating. First, we focused on the most prevalent gating mode, and, because the other modes had the same number of closed an open components, we assumed that all modes could be modelled by using the same gating scheme. Second, using maximum likelihood methods, we ranked model schemes based on the log likelihood (LL) at a saturating GABA concentration. Third, we applied autocorrelation analysis in an attempt to determine the number of gateway states. Fourth, we modelled GABAR activation by fitting globally across subsaturating GABA concentrations, to determine rate constants for GABA association and dissociation. And fifth, we simulated macroscopic currents by using the most highly ranked models and compared the results to the experimental observations of McClellan & Twyman (1999) (MT), who applied brief pulses of GABA to human α1β1γ2S GABARs expressed in HEK cells.
Kinetic analysis of single channel recordings
Each data file was analysed with QuB software in a series of steps. (1) Clusters of openings were selected by eye and extracted to a new data file for further analysis. We defined a cluster as a group of openings separated from other such groups by long non-conducting periods that correspond to desensitized states (Fig. 1) (Elenes & Auerbach, 2002). If necessary, the clusters were baseline-corrected before idealization into noise-free open/closed interval durations. In most patches, short (≤ 1 ms), isolated openings occurred throughout the entire recording. Care was taken to select clusters that contained as few of these overlapping open events as possible. Although they could not be avoided altogether, they accounted for < 1% of the openings analysed in all patches.
Figure 1. GABAR gating is heterogeneous and complex.

A, 5 min of data from a cell-attached patch on HEK cells expressing human α1, β1, and γ2S GABAR subunits with 5 mm GABA in the pipette. Slashes (//) denote a 3-min section of data that was removed for display purposes. Long closed intervals separate clusters of single channel openings (open is downward). Brackets ([…]) mark clusters that were selected by eye, and each represents a distinct gating mode, designated Low, Mid, and High. The boxed data show the overlap of current from two simultaneously active channels. Data were filtered to 1 kHz for display. B, amplitude histogram for events in all clusters selected by eye (66 in total) showing only two conductance classes. The single-channel current was ∼2 pA when the pipette potential was held at +80 mV. C, dwell time histograms for events in all clusters selected by eye. They were best fitted by a model containing five closed and four open states. Prior to modelling, a τcrit was applied to eliminate events that were not major components of receptor gating (e.g. C4 and C5). A τcrit of 40 ms is marked in the closed time histogram, which corresponds to the τcrit applied to isolate Low PO bursts in the patch.
(2) The segmental-k-means algorithm (SKM) (Qin, 2004) was used for idealization. All data were idealized without digital filtering, and the first and last closed events of clusters were dropped to eliminate the flanking closed events that were arbitrarily grabbed by eye-selection. Because clusters of GABAR gating events contained closed and open durations spanning four orders of magnitude, it was necessary to idealize the data using a model that reflected this complexity. From here on, ‘idealize’ refers to the following procedure. First, the SKM algorithm was applied using a simple C ⇌ O model with starting rate constants of 100 s−1. The number of C and O components was then determined by successively adding states to the central O state, and then re-fitting the model using the maximum interval likelihood method (MIL) (Qin et al. 1996). An added state was considered to significantly improve the fit of the model to the data if the log likelihood increased by ≥ 10 units. Second, the data were re-idealized with SKM using the resultant ‘star’ kinetic model and rate constants.
(3) Clusters were separated into distinct modes based on open probability (PO), mean closed time (τC), and mean open time (τO) using ‘Select’ in QuB. This feature uses the k-means algorithm to group data segments based on user-defined criteria. Initial values for PO, τC and τO were determined from the scatter plots for these parameters (Fig. 2). Then, iterations of the k-means algorithm were run until the distribution of segments was stable. Three populations of clusters were apparent and were named in reference to their open probability – High, Mid, and Low. Each mode was then analysed separately, as follows.
Figure 2. GABAR gating modes are distinguishable PO.

A, histogram showing the distribution of gating modes from the patch shown in Fig. 1. Bursts isolated by a 40-ms τcrit are binned according to PO. The histogram is fitted well by three Gaussian distributions with means of 0.83 (High), 0.55 (Mid) and 0.26 (Low). B, scatter plots of the τO and τC for the same bursts. The mean values for each parameter were: τO = 6.01 (High, ▴), 1.28 (Mid, •) and 0.65 (Low, ▾); τC = 1.15 (High), 1.13 (Mid), and 2.26 (Low).
(4) The GABAR can enter into desensitized states of various durations (Jones & Westbrook, 1995; Haas & Macdonald, 1999; Burkat et al. 2001). Consistent with these previous findings, we observed long closed components that comprised only a small proportion of the events within clusters, were not dependent on GABA concentration, and may have caused bias in selecting clusters by eye. Therefore, we divided clusters into shorter bursts of openings by imposing a critical time (τcrit). This step insured that selecting clusters by eye did not affect the durations of open and closed events used for model-fitting. An appropriate τcrit was determined for each file by fitting all events in the eye-selected clusters with MIL, and then imposing successively shorter cut-off times until only the shortest three closed components were represented in the bursts (Fig. 1C). The critical times used for High, Mid and Low bursts were 15, 15–20 and 40–60 ms, respectively.
(5) Rate constants for state transitions were estimated and an LL value, reflecting the goodness of fit of the model for the data, was generated using the MIL algorithm. All rate constants were unconstrained. In general, complex models were built either by adding one state at a time, or by making changes in the connectivity of a model having the same number of C and O states. For Mid-mode bursts, we ranked models using the sum of LL (ΣLL) values from three separate patches.
The interval duration histograms (Figs 1, 3 and 6) show both the binned data and a smoothed curve calculated from the model. With SKM idealization, interval durations are integral multiples of the sampling interval. Thus, for short duration events, some bins are empty and others are overpopulated, compared to the theoretical curve. However, the discrete nature of the event durations did not have a significant effect on the rate constant estimates because even the briefest time constant (0.15 ms) was twice as long as the dead time.
Figure 3. Bursts exhibit complex gating behaviour.

A, a single Mid-mode burst showing a rare change in kinetic activity. The arrow at left indicates a 2-ms closed event, which appears to be the point at which the channel gives rise to a series of short openings. The arrow at right indicates a 14-ms closed event, when the series of short openings appears to end. B, a single cluster is shown for each mode; from top: High, Mid, Low. The low resolution view shows a trace from an eye-selected cluster, while the high resolution view shows a trace from a typical GABAR gating burst. In this patch, the τcrit was 15 ms for High- and Mid-, and 40 ms for Low-mode bursts. Below the traces are the duration histograms for events of the same mode with the time constants and fractional amplitudes. The histograms are overlain by the probability density function (pdf) calculated from the ‘star’ model. Each mode was best fitted by a model containing three closed and three open states. Number of events – High: 17 911; Mid: 80 982; Low: 40 738. Data were filtered to 1 kHz for display.
Figure 6. Global fitting across concentrations indicates that GABA binding occurs at a pregateway closed state.

A, results of global fitting across concentrations. All 51 models were fitted (to four patches each) with models having two identical binding sites connected, in turn, to each of the fully liganded C states. G = a single GABA molecule; CU = unliganded closed state; CM = monoliganded closed state; numbered C and O states are diliganded; k+ and k− are binding and unbinding rate constants, respectively. B, representative data traces from each patch used in the global fitting with closed and open duration histograms for the same patch at right. Probability density functions were calculated using model III (see Fig. 7) with binding steps added to C1. The number of events in each patch ranged from 5000 to 9000 (total = 27 256). C, the LL values for the fitting of the four single-gateway models with binding connected to each of the closed states. NC: no convergence, the model could not be fitted to the data with binding connected at the particular C state.
Note that the complexity of the single channel data required us to employ sometimes strict selection criteria that imposed some limitations on the analysis. First, our modelling of the High- and Low-modes was based heavily on fittings of Mid-mode data. Second, we imposed a very short τcrit. While this allowed us to focus on key steps in the principal gating reaction, we acquired no information on long-lived desensitized states. Third, because we used high concentrations of GABA (to elicit clusters of gating events) and imposed a short dead time, there is no simple relationship between the cluster duration obtained at saturation and macroscopic deactivation time constants. Fourth, we did not consider models with loops and therefore cannot exclude the possibility of a cyclic reaction mechanism(s).
Global fitting across GABA concentrations
For global fitting, we selected Mid-mode bursts from patches at four subsaturating GABA concentrations. Each patch contained ∼5000–9000 events and was analysed as above, with the following exceptions. A specific τcrit was determined for each file. At GABA concentrations below 500 μm, four closed components were preserved (rather than three) to account for the prolonged closed intervals associated with agonist binding. Above 500 μm, the duration of binding-associated closed intervals overlapped with concentration-independent closed durations, and only three closed states were required to model bursts. For concentrations of 1000, 500, 100 and 50 μm, the τcrit values were 22, 33, 56 and 200 ms, respectively. The only constraint we placed on the fitting was to assume that GABA binds independently to two equivalent sites. Therefore, we fixed the rate constants (k) so that  ; where U signifies unliganded, M signifies monoliganded, and numbered states (whether C or O) are diliganded (Fig. 6A). Each model was fitted to the data three times – once with the binding steps connected to each closed state.
Autocorrelation analysis
Autocorrelation analysis was applied using a program written in OriginC language, as previously described (Colquhoun & Hawkes, 1987; Auerbach & Zhou, 2005). When used to analyse idealized, stationary single channel data, the autocorrelation coefficient, ρ(k), can identify the presence of a correlation between paired events separated by a lag of k events. In this study we analysed the autocorrelation functions for open–open (O–O) pairs, closed–closed (C–C) pairs, and open–closed (O–C) pairs (i.e. an open event and a subsequent closed event separated by k events of either conductance). A significant correlation between events will appear as an autocorrelation function that geometrically decays as k increases (Fig. 5C), suggesting a gating mechanism with multiple entry/exit (or gateway) states from one conductance class to the other (Fredkin et al. 1985; Labarca et al. 1985).
Figure 5. Autocorrelation analysis does not differentiate between models.

Autocorrelation functions for Mid-mode bursts (A) and simulated bursts generated from models V (B) and I (C). All Mid-mode bursts were extracted from the same patch. The number of events in each burst is inset in the plot. For models V and I simulations, each plot represents a burst with a different number of total events (approximate values inset). O–O, C–C and O–C correlations are plotted as shown in the legend. The dashed lines are at  , the standard error of the correlation estimate in the case of white noise.
We plotted the autocorrelation function for individual Mid-mode gating bursts and for data simulated using the optimal models generated from fitting Mid-mode bursts at 5 mm GABA. No correction was made for missed events. Mid-mode data were selected as the 10 bursts with the highest number of events (typically ∼1500/burst) from each patch. We used the top eight models from the 5 mm GABA fitting to simulate continuous bursts of varying lengths (from ∼2000 to ∼50 000 events). Rate constants for the single-gateway models were averaged from three patches. Rate constants for models with multiple gateway states were variable and thus could not be averaged. Instead we used the rate constants that gave the highest LL value in the patch with the most total events.
Macroscopic current simulations
Macroscopic current responses were simulated using QuB. The model to be tested represented a single GABAR. To simulate macroscopic responses, the number of channels was set to 1000. The simulated responses were generated at a sampling frequency of 100 kHz. We simulated two experiments performed by McClellan & Twyman (1999) (MT). The first was the response to a single 800 μs application of 10 mm GABA. The second was the response to paired pulses of 1 ms applications of 10 mm GABA. The intervals between the pulses were 8, 20, 30, 50 and 100 ms.
We simulated two model motifs. First, we tested the most highly ranked Mid-mode models alone, with rate constants estimated from the cross-concentration global fittings. We set the starting probability of CU to one, assuming that all receptors began in the unliganded state before GABA application.
Second, we tested more comprehensive models by incorporating the High- and Low-modes along with the Mid-mode models described above. The rate constants for the High- and Low-modes were fixed at the values estimated from fitting clusters acquired at a saturating GABA concentration. We assumed that GABA binding was mode-independent, and used identical binding rate constants for all three modes. The High- and Low-mode models were connected to the Mid-mode model by transitions between the CU states that had rate constants of 10−4 s−1 (to minimize mode switching). We set the starting probability for each CU state to reflect the proportion of each mode that we observed in our records (see Results): CU(Low) = 0.29, CU(Mid) = 0.56, and CU(High) = 0.15. This set the contribution of each mode to the simulated macroscopic current.
Estimation of the activation rate, the deactivation rates, and the difference between peaks in paired pulses was performed in OriginPro 7.0 (OriginLab Corp., Northampton, MA, USA). The activation rate was measured as the 10–90% rise time of the response after the initiation of the agonist pulse. The deactivation phase of the response was fitted to mono-, di-, or triexponential functions.
To predict the whole-cell dose–response curve and calculate the EC50 value, we used model V (including all three modes) to simulate responses to 100 ms pulses of GABA and plotted the peak current versus GABA concentration. The curve was then fitted by the Hill equation in OriginPro 7.0.
Results
Modal gating
We applied a saturating (5 mm) GABA concentration to wild-type α1β1γ2S GABARs expressed in HEK cells. GABARs mainly opened to a single conductance of 24 pS, which corresponded to an amplitude of ∼2 pA when the pipette potential was held at +80 mV (Fig. 1B).
Single channel records obtained from GABARs activated by 5 mm GABA were kinetically heterogeneous. We observed two basic classes of gating events (Fig. 1A). The first was comprised of discrete clusters of openings. A single GABAR remained active for several seconds before entering a long inactive period that could last from seconds to minutes (Fig. 1A). We only analysed such clusters of events, which we initially selected by eye (Fig. 1A, brackets), excluding periods of activity during which multiple channels were active simultaneously (Fig. 1A, boxed). We observed at least three distinct patterns, which we named based on PO: High, Mid and Low (Fig. 2A). When activated by 5 mm GABA, the PO values for High, Mid and Low eye-selected clusters were, respectively (mean ± s.e.m.): 0.73 ± 0.02 (3 patches), 0.50 ± 0.01 (4 patches), and 0.21 ± 0.02 (4 patches). The respective cluster durations were (mean ± s.e.m.): 4.9 ± 1.8 s, 8.5 ± 4.3 s, and 8.9 ± 1.6 s.
The second class of gating event was composed of brief (≤ 1 ms) isolated openings. This ‘chatter’ occurred throughout most patches, but in some cases silenced after 10 min or more. Although these openings were always sparse, we noticed that the presence and persistence of this activity varied between patches, and seemed to correspond with the overall level of activity in the patch. The background chatter may arise from clusters having very low PO values.
Taken together, the eye-selected clusters for a particular file represented all types of events present in the file with the exception of the long silent periods and the brief isolated openings. Fitting all clusters (combined) required a model with at least five closed components and four open components (Fig. 1C). The two longest closed components comprised only a small proportion (< 5%) of the overall activity, were not dependent upon GABA concentration, and may have reflected bias in selecting clusters by eye. Therefore, we divided clusters into shorter ‘bursts’ of gating events by applying a τcrit that preserved the three shortest closed interval components.
Figure 2 shows bursts segregated into populations by PO, τO and τC. A histogram of burst PO values from the patch shown in Fig. 1 shows three components. Scatter plots of τO and τC for the same bursts show that the PO difference is mostly dependent on the open duration (Table 1).
Table 1.
Kinetic parameters of GABAR gating modes
| Time Constants | Burst Properties | |||||||||||||||
|---|---|---|---|---|---|---|---|---|---|---|---|---|---|---|---|---|
| Mode | τC1 | Fr | τC2 | Fr | τC3 | Fr | τO1 | Fr | τO2 | Fr | τO3 | Fr | Burst duration | Mean closed time | Mean open time | Open probability |
| HIGH | 0.18 | 0.52 | 0.69 | 0.33 | 3.44 | 0.15 | 0.44 | 0.15 | 2.97 | 0.46 | 8.13 | 0.39 | 452.67 | 0.94 | 4.78 | 0.83 |
| s.e.m. | 0.03 | 0.02 | 0.07 | 0.03 | 0.05 | 0.02 | 0.05 | 0.01 | 0.22 | 0.04 | 2.56 | 0.05 | 60.28 | 0.09 | 0.49 | 0.01 |
| MID | 0.19 | 0.47 | 0.83 | 0.28 | 3.01 | 0.25 | 0.38 | 0.29 | 1.68 | 0.69 | 8.17 | 0.03 | 473.30 | 1.25 | 1.82 | 0.58 |
| s.e.m. | 0.00 | 0.05 | 0.05 | 0.06 | 0.47 | 0.01 | 0.07 | 0.03 | 0.12 | 0.03 | 2.51 | 0.01 | 95.89 | 0.21 | 0.46 | 0.01 |
| LOW | 0.30 | 0.36 | 2.28 | 0.46 | 7.60 | 0.18 | 0.28 | 0.48 | 0.87 | 0.50 | 9.08 | 0.02 | 764.97 | 2.97 | 0.84 | 0.23 |
| s.e.m. | 0.03 | 0.06 | 0.45 | 0.10 | 0.90 | 0.04 | 0.02 | 0.08 | 0.17 | 0.08 | 3.72 | 0.01 | 63.42 | 0.48 | 0.17 | 0.03 |
s.e.m. = standard error of the mean (n = 2–4 patches); Fr = Fraction; all times are in ms.
Relative proportions of gating modes
The Mid gating mode was the predominant type of activity, regardless of GABAR concentration. After selecting clusters by eye, we counted the number of clusters for each mode type. The relative contribution of each mode varied greatly between patches. Most patches contained several overlapping channels that were active at the beginning of the patch and these were not analysed.
In three patches with 5 mm GABA in the pipette, Mid-mode clusters accounted for 40–70% of all the clusters (mean = 56%) and 61% of the openings. On average, Low-mode clusters made up 29% and High-mode clusters made up 15%. The High-mode was also the most likely to be absent from individual patches.
At lower GABA concentrations we saw a similar trend in the proportions of each mode. In patches at GABA concentrations of 100 μm (n = 2), 500 μm (n = 3), and 1000 μm (n = 7), Mid clusters made up 46–54% of the total, while Low and High clusters made up 28–42% and 13–19%, respectively. In patches at 50 μm GABA (n = 2), Mid and High clusters both made up 44% of the total, and Low clusters made up the remaining 12%. At concentrations of ≤ 50 μm, Low clusters were difficult to identify, which may be the cause of their apparent relative infrequency. At this low concentration, the closed states associated with agonist binding became longer in duration, and thus the PO of all modes decreased (for the Low-mode, PO was < 0.05) Therefore, bursts could only be extracted from patches that contained fewer, well spaced, clusters in order to minimize the likelihood that a series of openings from multiple simultaneously active channels was considered a single cluster.
Even though the High- and Low-modes were observed in most experiments, Mid-mode clusters were both the most identifiable and reliable. Thus, we concentrated our efforts on deriving a gating scheme for the Mid-mode.
Single GABARs possess complex gating kinetics
Interval durations within bursts were, for the most part, kinetically homogeneous, but we did observe epochs in which there appeared to be a switch from the normal activity pattern to one having unusually brief openings (Fig. 3A). Although rare, such epochs were likely to occur within at least one Mid burst in long duration patches (> 20 min). Similar switches in kinetic activity were even rarer in the High- and Low-modes, but did occur. In the High- and Low-modes, drastic changes in kinetics (e.g. a series of very high PO events during a Low-mode burst) were more easily recognized by eye than were series of Mid PO events. To avoid subjectivity in selecting data, we did not eliminate bursts based on the presence of these changes in kinetic activity.
Open and closed interval durations within bursts were best fitted by a model having three closed and three open components, regardless of the mode (Fig. 3B). Table 1 shows time constants for all closed and open components in GABAR bursts activated by 5 mm GABA. As shown in Fig. 2, the key difference between each mode was the open time. The lifetimes of the longest (τ = 8.5 ms) and briefest (τ = 0.4 ms) open components were similar for all modes, but the fraction of each varied considerably between modes. In contrast, the intermediate duration open component varied more in time constant and less in fraction between modes.
Between patches, the proportion of the longest open component was the most variable. Regardless of GABA concentration, this component comprised from 1 to 20% of openings in Mid-mode bursts. In Low-mode bursts it consistently comprised < 1% of open events, and in High-mode bursts it comprised nearly 40% of the data. In some patches with < 10 000 events, this component was undetectable in Mid- and Low-mode bursts. Only patches that demonstrated all three open components were used in our modelling analyses. Even when the longest open component accounted for < 1% of openings in Low- and Mid-mode clusters, it was very long-lived, and thus we included it in all of our modelling attempts in order to accurately estimate the rate constants for state transitions.
Because all three modes could be modelled using the same number of C and O components, and because we occasionally observed unusual changes in kinetic activity within bursts of all modes, we suspect that the modes represent the activity of the same GABARs. That is, we speculate that any α1β1γ2S GABAR in the patch can generate currents according to any of the three modes. In support of this hypothesis, we examined single channel currents from cells in which only two of the subunits (yielding α-, β- or γ-less GABARs) had been transfected, and did not see any ∼2 pA, single channel activity resembling the modes described above (data not shown). These observations suggest that GABAR modal activity is not a consequence of heterogeneity in subunit composition within the patch.
Modelling GABAR gating at a saturating GABA concentration
There are 1087 possible model schemes comprising three open and three closed states. We limited our search to models without loops, which brought the number to a more manageable 51. We then ranked, with maximum likelihood methods, all of these models on Mid-mode bursts from three patches of GABARs activated by 5 mm GABA.
We ranked all 51 models by the sum of the LL values from three patches. The models generated a wide range of ΣLL values, and there was no clear threshold by which we could eliminate model schemes (Fig. 4). One scheme (model I, shown with binding steps in Fig. 7) produced high LL values all three patches, which is reflected in its high ΣLL value. However, we were skeptical of this model for two reasons. First, the final rate constants were heavily dependent on the starting values. Second, four of the 10 rate constants were not consistent between all three patches. Thus we could not accept this model without further investigation despite its high ΣLL value.
Figure 4. Models distributed over a range of LL values.

A histogram of ΣLL values for fits of 50 GABAR gating models. The ΣLL values were summed from fits of each model to Mid-mode bursts from three patches. One model is not plotted because it could not be fitted to one data set, and thus had a much lower ΣLL value than the rest of the models. Inset is the distribution of the top eight models with the ΣLL ratio plotted on the origin. The top seven models are shown with rate constants from the cross-concentration global fitting in Fig. 7. Model VIII was omitted because it was not highly ranked in the global fitting.
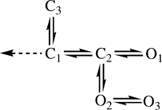
Figure 7. Kinetic models.

The top seven models with rate constants calculated from global fitting across GABA concentrations. Models are divided into single-gateway and multigateway subsets and numbered according to their rank in the fitting at 5 mm GABA (Fig. 4). KD values (μm) for each model are: I, 59.5; II, 54.8; III, 131.7; IV, 91.6; V, 91.58; VI, 54.1; VII, 131.7.
We chose to explore the top eight models from the ΣLL rank list. Seven of these model schemes are shown (with rate constants and binding steps) in Fig. 7 as two subsets. Four models contained multiple C → O gateways, and three had a single C → O gateway.
Models with multiple gateways showed similar characteristics to model I, i.e. the rate constants for state transitions were not stable between different data sets and were heavily dependent on the starting values. Additionally, these models did not rank high by LL for every individual data set, but when they were favoured, had very high LL values. The sum of one or two high LL values summed with a moderate or low LL value resulted in a ΣLL value that was competitive with other models.
Models of the single-gateway subset varied only by the connectivity of two states: C3 and O3. That is, all of these schemes had the following core:
 |
Scheme 1 |
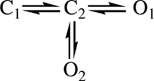
The minimal core mechanism is simply C ⇌ C ⇌ O because O1 is occupied with a much higher probability than O2.
Unlike models with multiple gateways, the optimal rate constants for single-gateway schemes were consistent between data sets, and the rate constant final values were less sensitive to the starting values. For models III and IV, the starting values did not have any affect whatsoever on the final rate constant estimates.
To make sure that these schemes could also adequately describe the other modes we fitted High- and Low-mode bursts (from two patches for each) with the top eight models. We found a similar distribution of ΣLL, with the following differences in the rank order. Model I was again the best fit for High-mode bursts, but ranked among the worst for Low-mode bursts (7th of 8). Model II provided the best fit for Low-mode bursts. Model VI ranked 3rd and 2nd for the High- and Low-mode, respectively. Similar to the fitting of Mid bursts, models III, IV, V and VII were similar in ΣLL; and model VIII was a poor fit for both High and Low bursts.
In summary, the single-gateway models produced high ΣLL values, consistent rate constants across patches and similar ranks for all three gating modes.
Autocorrelation analysis at saturating GABA
Figure 5A shows autocorrelation functions for three Mid-mode bursts from one patch. Although some points fell outside of the correlation estimate for white noise, there is no clear evidence of decay in the correlation function.
The Fig. 5B and C shows autocorrelation functions for simulated bursts with increasing numbers of total events (top to bottom). Models with a single gateway state (represented by model V) did not show any correlation, even within bursts containing up to 50 000 events. Data simulated by models with multiple gateway states did show a correlation, but only in bursts with tens of thousands of events. For model I, a correlation between open times emerged in the plots of most bursts with ∼10 000 events, but was very clear in bursts with > 20 000 events. At least 20 000 events were required to observe an O–O correlation for model II, and a correlation for both O–O and O–C pairs for model VI (not shown).
The longest Mid-mode bursts that we could extract from our wild-type data contained ∼2000 total events. Although this number of events has previously been used to establish a correlation in other receptors (Labarca et al. 1985), we found, by analysing simulated data, that the O–O correlation was not apparent when so few events were analysed. In summary, autocorrelation analysis was not useful in distinguishing models of GABAR gating.
Modelling GABAR gating at subsaturating GABA concentrations
We globally fitted models to single channel GABAR current interval durations across concentration in order to: (1) test whether the same schemes could be used to model GABAR gating activated by subsaturating GABA concentrations and (2) determine the connectivity of states and rate constants associated with transmitter binding. We extracted Mid-mode clusters from data files obtained with 50, 100, 500, or 1000 μm GABA in the patch pipette using the same selection criteria (PO, τC, and τO) as for 5 mm GABA.
Figure 6B shows segments of data from each file used in the global fitting and the associated closed and open time histograms. As the GABA concentration decreased, binding-associated closed intervals increased in duration, but the durations of the three open components did not change.
By LL rank, the top seven models were similar for the global fitting as for the currents activated by 5 mm GABA. The only differences were that model VI was ranked third by LL and model VIII was not a top ranked model in the global fitting. In models with a single gateway (and aggregated closed states), connecting the binding steps to the closed state adjacent to the gateway closed state (the ‘pregateway’ state, C1) always produced the highest LL (Fig. 6C).
Figure 7 shows the seven top-ranked models (from the concentration series) with rate constants estimated by global fitting. There are four single-gateway schemes that differ with respect to the connectivity of the open states (partly coupled or uncoupled) and one of the closed states (connected to the gateway or the pregateway closed state). The association and dissociation rate constants were similar for all schemes. For model V k+ = 2.97 μm−1 s−1, k− = 272 s−1, and KD = 91 μm, and the EC50 of a simulated whole-cell dose–response curve is 56 μm. The KD values for each model are listed in the Fig. 7 legend.
Structurally, both binding sites reside at the interface of a β and α subunit (Cromer et al. 2002), so the hypothesis that both are identical is not unreasonable. However, through fitting of the activation phase in response to several different concentrations of GABA, two groups have provided evidence of cooperativity or inequality between the binding sites (Lavoie et al. 1997; Mozrzymas et al. 2003). We tried re-fitting all seven models after relaxing the equal-binding constraint. Three models (I, IV and V) converged on non-identical binding rate constants, in which the first association rate was slower than the second, i.e. binding appeared to be cooperative. However, the dissociation rate constants also increased, so that the binding affinity of the first binding site was greater than that of the second. Despite two additional free parameters, the LL increased by only 6–10 units (data not shown). Thus we did not find significant evidence that models with cooperative binding were required to fit our data.
Macroscopic current simulations
Certain models cannot be distinguished by using only steady-state kinetic data (Kienker, 1989). As the final step in our modelling efforts, we tested the ability of each scheme to reproduce non-stationary, macroscopic currents. In their previous study, McCLellan & Twyman (1999) applied submillisecond pulses of saturating GABA concentrations to outside-out patches from HEK 293 cells transiently transfected with human α1, β1 and γ2S subunits using calcium phosphate precipitation. Their expression system was almost identical to our own, and in response to submillisecond agonist applications they did not observe any effects of desensitization on the macroscopic currents. Similarly, we used a critical time to eliminate long closed states that we associate with desensitization. Thus we expected that currents simulated from an accurate model of GABAR gating should resemble the MT experimental data.
MT used two different pulse protocols: (1) a single, 800 μs pulse of a saturating GABA concentration (1–10 mm) or (2) paired 1 ms pulses of 10 mm GABA at increasing intervals (8, 20, 30, 50 and 100 ms). They measured the 10–90% rise time, the bi-exponential deactivation time constants and the peak amplitude (Table 2). With paired pulses, after the 8 ms interval the peak current increased by 25% but was unchanged for intervals ≥ 20 ms.
Table 2.
Macroscopic responses of recombinant GABARs: simulated versus experimental data
| Activation | Deactivation | Paired pulse | |||||||
|---|---|---|---|---|---|---|---|---|---|
| Model | Peak (PO) | 10–90% rise time (ms) | τ1 (ms) | Amp | τ2 (ms) | Amp | τ3 (ms) | Amp | Percent increase |
| Single gateway | |||||||||
| IV, V (M) | 0.37 | 1.16 | 13.91 | 1.00 | — | — | 14 | — | — |
| IV, V (HML) | 0.35 | 1.18 | 13.01 | 0.75 | 48.06 | 0.25 | — | 15 | — |
| III, VII (M) | 0.43 | 1.03 | 4.57 | 0.28 | 19.69 | 0.71 | — | 4 | — |
| III, VII (HML) | 0.40 | 1.03 | 4.49 | 0.32 | 20.08 | 0.46 | 66.29 | 0.21 | 6 |
| Multi-Gateway | I (M) | 0.27 | 1.62 | 11.13 | 1.00 | — | — | 24 | — |
| II (M) | 0.29 | 1.73 | 11.71 | 1.00 | — | — | 23 | — | |
| VI (M) | 0.28 | 1.64 | 11.05 | 1.00 | — | — | 22 | — | — |
| McClellan & Twyman | — | 1.0 ± 0.06 | 9.4 ± 0.01 | 0.66 | 33.6 ± 0.03 | 0.34 | — | — | 25 |
(M): Mid mode model used for simulation; (HML): High, Mid and Low modes incorporated into a single model for simulation; Percent increase: the increase in the macroscopic current amplitude in response to the second pulse after an 8-ms interval.
We simulated macroscopic currents using the top seven models. For Schemes III, IV, V and VII we simulated each experiment under two conditions. First, we used the Mid-mode rate constants estimated from the cross-concentration fitting. Second, we added the High- and Low-modes to the model, assuming that their relative contributions to the macroscopic current was the same as in the steady-state, single channel records.
The simulated Mid-mode responses generally matched the experimental responses, but with some important differences between model types. In response to a single pulse, the single-gateway schemes (Fig. 8A, red traces) predicted a peak amplitude of (in PO) ∼0.4, and a 10–90% rise time that was similar to the experimental result (1 ms; Table 2). The current decay was bi-exponential (but with fractional amplitudes that differed from the MT data) when C3 was connected to the gateway closed state, and mono-exponential when connected to the pregateway closed state. Multi-gateway models predicted a peak PO of ∼0.3, a 10–90% rise time that was ∼1.7 times longer than the experimental result and a mono-exponential deactivation time course. In summary, none of the Mid-mode simulations was in perfect accord with the experimental results.
Figure 8. Simulated macroscopic responses from GABAR gating models.

Simulations of single-gateway models are shown in the left and centre columns (A and C). Simulations of multigateway models are shown in the right column (B and D). Models IV and V, and models III and VII predicted identical macroscopic responses. A and B, simulations using the protocols of MT. In A red curves were generated from Mid-mode models, while blue curves were generated from models of all three modes combined. In B the navy, dark green and brown curves were generated from Mid-mode models of I, II and VI, respectively. Upper traces show the simulated responses to a single 800 μs pulse with high resolution views of the activation phases inset. Lower traces show the simulated responses to paired-pulses. In B, only the paired-pluse for model I is shown. C and D, the occupancies of closed components CM (green) and C3 (violet) during the response to the paired-pulses separated by an 8-ms interval (from A and B). When C3 branches from C1 (the pregateway state), more receptors occupy the monoliganded state when the second agonist pulse is applied. When C3 branches from C2, it traps receptors in a state that is insensitive to the second agonist application. In model I, C3 is rarely accessed do to a slow rate of entry.
For the single-gateway schemes, adding the High- and Low-modes (Fig. 8A, blue traces) slightly decreased the peak amplitude but added an additional, slow component to the decay phase. Models IV and V, which showed mono-exponential decays with only Mid-mode rate constants, gave rise to bi-exponential decays with all three modes.
In the paired pulse simulations, adding the High- and Low-modes, had little effect on the increase in response to the second pulse. Although all of the models showed an increase in the response to the second pulse, the largest potentials were observed with multiple-gateway schemes, and with the single-gateway schemes in which C3 was connected to C1 (Table 2).
Discussion
The principal findings are as follows. (1) At saturating GABA concentrations, GABAR activity mainly occurs in clusters of openings that have at least three distinct kinetic patterns. (2) Each pattern is characterized by bursts of openings generated by three non-conducting and three conducting states. (3) The ‘core’ for all modes is a relatively simple, linear (C ⇌ C ⇌ O) gating mechanism. (4) The GABA association and dissociation rate constants are similar irrespective of model. Values for KD range from ∼50 to 130 μm. (5) The single-gateway models IV and V were the only schemes that produced high LL values with stable rate constants, and that accurately predicted the macroscopic current responses to rapid pulses of a high concentration of GABA.
Multiple patterns of GABAR gating
We observed at least three GABAR gating patterns (‘modes’) that were distinguishable by the parameters of PO and τO. Because individual clusters generally exhibited a single type of activity and lasted for several seconds, we speculate that mode switching is a slow and/or rare process that usually occurs during the long inactive periods.
The complexity of native GABAR gating is well known (Macdonald et al. 1989; Newland et al. 1991), and recent studies have demonstrated unstable gating responses in macroscopic currents elicited from apparently single GABAR subtypes (Nusser et al. 2001). In experiments with recombinant GABARs, MT showed two distinct patterns of activity for recombinant α2β1γ2S GABARs but not α1β1γ2S GABARs. Furthermore, modal gating has been suggested as a mechanism of action for neurosteroids (Bianchi & Macdonald, 2003).
We can only speculate about the mechanisms that generate modes. The macroscopic response of recombinant α1β2γ2 GABARs to rapid agonist pulses differs depending on whether they are expressed in HEK cells or QT6 cells (Mercik et al. 2003). Thus it is possible that intracellular regulatory mechanisms affect mode switching. In support of this hypothesis, Hinkle & Macdonald (2003) have demonstrated that basal phosphorylation of α1β3γ2L GABARs expressed in HEK cells affects the macroscopic response to 1 mm GABA, and a similar modification may occur at β1-containing receptors through phosphorylation by protein kinase A. In addition, over-expression of GABAR associated protein (GABARAP) with α1β2γ2L GABARs in QT6 fibroblasts increased the number of clustered GABARs, which slowed desensitization and increased the rate of deactivation (Chen et al. 2000). ‘Declusterization’ of GABARs in hippocampal neurons increased the activation rate of mIPSCs and in response to rapid applications of GABA (Petrini et al. 2003). Thus intracellular proteins may influence GABAR gating kinetics.
Although it may be possible for GABARs comprising α1, β1 and γ2S subunits to adopt a variety of subunit stoichiometries, our results with subunit-less receptors suggest that essentially all the currents that we analysed represented GABARs containing all three subunits. Although α1β1 GABARs are expressed in HEK cells (Boileau et al. 1999), we were unable to observe currents from γ2S-less receptors, which, regardless, have a conductance that is half that of α1β1γ2 GABARs (Angelotti & Macdonald, 1993) and would therefore have been easy to identify.
The results of the present study are significant to other experiments using recombinant GABAR subunits. All three modes would contribute to the observed current in macroscopic responses of receptors activated by GABA or in single channel currents activated by low GABA concentrations. Thus, models derived from such experiments are likely to represent the composite response of at least a few different modes. Similarly, at high GABA concentrations, substituted cysteine accessibility is likely to be a weighted average of the labelling of at least three conducting and three non-conducting states from at least three different modes, not just a single ‘open’ state.
Gating models
Several groups have made major contributions towards developing kinetic schemes for GABAR gating (Macdonald et al. 1989; Weiss & Magleby, 1989; Twyman et al. 1990; Jones & Westbrook, 1995; Burkat et al. 2001; Akk et al. 2004; Celentano & Hawkes, 2004). We now frame our analysis in the context of these previous studies.
As in these previous studies, which employed both neuronal and recombinant αβγ-containing GABARs, we observed multiple open and closed components. In particular, our observed number of open components (for all modes, combined) are consistent with those observed by other groups who studied single channel currents from recombinant α1β1γ2S GABARs (Lavoie et al. 1997; Burkat et al. 2001; Greenfield et al. 2002).
Our results suggest that this complexity emerges from a simple, core gating scheme for fully liganded GABARs, C1⇌ C2⇌ O1, occurring in three distinct modes. Although we have no basis for discriminating between the two best schemes (IV and V, which differ only in the connectivity of O3), for the purposes of this discussion we will focus on model V:
 |
Scheme 2 |
All of the states represent a fully liganded GABAR: C2 is the lone ‘gateway’ state for a change in conductance. C1 is a brief (∼750 μs) ‘pregateway’ state from which the GABAR can do one of three things: enter either of two short-lived closed states (having concentration-independent lifetimes), C2 and C3, or lose agonist (dashed arrow). The C1⇌ C2 rate constant decreases modestly (∼2.5-fold) from High- to Low-modes, which is enough to increase equilibrium occupancy in C1 by ∼4-fold (Fig. 9B). Regardless of mode, this rate constant is ∼5-fold greater than the C1⇌ C3 rate constant, and thus most fully liganded GABARs usually progress towards an open state. C2 is also brief (∼200 μs, independent of mode) and egress from this state is approximately equal for all three of its neighbours. The mean first passage time from C1 to an open state is 1.38 ms (Mid-mode), and simulations show that the 10–90% of the impulse response is ∼1.2 ms.
Figure 9. Comparison of gating modes activated by 5 mm GABA.

A, model V with rate constants for the High, Mid and Low gating modes estimated from patches acquired with 5 mm GABA in the pipette. The core mechanism is shown in bold. Rate constants in the Mid-mode model were averaged from 3 patches; rate constants in the High- and Low-mode models were averaged from 2 patches. B and C, the equilibrium state occupancy probabilities (calculated from the rate constants in model V) of the closed (B) and open (C) states plotted versus the kinetic mode. Closed states are plotted as filled symbols, while open states are plotted as open symbols. Lines merely connect the data points, and are not fits to the data. The thick, continuous lines give emphasis to the states that vary by more than 10% between modes.
The inclusion of a pregateway, non-conducting state is a key difference between ours and other proposed gating schemes. In general, brief closures have been modelled as connected directly to open states and thus distal to the C → O transition (Twyman et al. 1990; Steinbach & Akk, 2001), or have been labelled as short-lived desensitized states (Burkat et al. 2001; Celentano & Hawkes, 2004). In our model, the brief closed states C1 and C3 occur proximal to the C2⇌ O1 transition. Pre-gateway closed states have previously been proposed for glycine receptors (Burzomato et al. 2004), NMDA receptors (Popescu & Auerbach, 2003) and acetylcholine receptors (Auerbach, 2005).
State C3 is of particular interest. Occupancy in C3 draws the GABAR away from the main activation pathway for a period of time (1.7 ms in Mid-mode) that is longer than the transmitter impulse. This lowers the peak open probability, but in effect reserves receptors for reactivation by a subsequent transmitter pulse. State C3 is therefore critical for paired-pulsed potentiation, with the lifetime and occupancy of this state setting the degree of potentiation as a function of pulse frequency. A similar behaviour has been reported for NMDA receptors (Popescu et al. 2004). Although C2 and C3 may be considered to be short-lived ‘desensitized’ states insofar as they have no ionic conductance and a high affinity for GABA, they serve important roles in shaping the synaptic response, but hardly protect the GABAR against overactivation.
In the Mid- and Low-modes, O1 is the dominant conducting state (Fig. 9C). This state has a lifetime of 1.4 ms in Mid-mode (1 ms in Low and 2.6 ms in High). In all modes, state O2 is brief (∼300 μs) and does not contribute significantly to the macroscopic current. However, O2 is significant because it provides access to O3, which, in the High-mode, produces a significant amount of the current. In High-mode, O1 and O3 have similar occupancy probabilities.
All of the conducting states in our GABAR gating models are fully liganded. These results are in contrast to the findings of Macdonald et al. (1989) and Jones & Westbrook (1995), who analysed currents from native GABARs activated by low concentrations (0.5–5 μm, Macdonald et al. 1989; 10–30 μm, Jones & Westbrook, 1995). Both groups proposed models in which short openings (< 1 ms) reflected monoliganded GABARs. Although we did not analyse GABAR gating at such low concentrations, we observed that similar brief openings comprised up to 50% of the openings within bursts at 5 mm GABA and that the fraction of brief openings within Mid-mode clusters did not increase with decreasing GABA concentration (to GABA concentrations as low as 50 μm). Thus we conclude that these brief open states represent fully liganded GABARs. Similar results have been found for the rat α1β2γ2L (Steinbach & Akk, 2001), and the bovine α1β1γ2S subtypes (Burkat et al. 2001). These results do not exclude the possibility that monoliganded openings occur at GABA concentrations ≤ 50 μm, but they do indicate that some brief openings represent diliganded receptors.
Although O2 is always occupied with a low probability, it serves an important role in the context of modal gating. With model V (but not IV), access to the long-lived O3 state is only through O2. The O2→ O3 rate constant is the most significant difference between modes, varying ∼32-fold between High and Low. Thus, from state O2 GABARs in High-mode have about an equal chance of closing or visiting O3, whereas those in Low-mode close with a > 99% probability.
In accord with past modelling attempts (Jones & Westbrook, 1995; Haas & Macdonald, 1999; Burkat et al. 2001; Akk et al. 2004), we modelled GABA binding as having two identical, independent binding sites. Our results for binding rates were model-independent and similar to previous reports, but because of a slightly faster unbinding rate, our results indicate a modestly lower affinity for GABA binding (KD = 50–130 μm versus 10–25 μm; ibid). The association and dissociation rate constants, which are about 100-times slower than for neuromuscular acetylcholine receptors (Salamone et al. 1999), is consistent with the notion that GABA binding is not diffusion-limited and that extensive conformational changes accompany the formation of the low affinity, liganded complex (Jones et al. 2001).
Table 3.
Equilibrium constants for model V
| K(C1C2) | K(C1C3) | K(C2O1) | K(C2O2) | K(O2O3) | |
|---|---|---|---|---|---|
| High | 1.10 | 0.83 | 5.42 | 1.65 | 3.80 |
| Mid | 0.74 | 0.49 | 3.00 | 0.56 | 0.69 |
| Low | 0.43 | 0.44 | 0.94 | 0.39 | 0.44 |
K(CiOj) = equilibrium constant calculated as the forward rate/reverse rate.
Acknowledgments
We thank Chris Nicolai and John Bannen for the developing advanced features in QuB software and Mary Teeling for maintenance of cell cultures. Supported by NIA NS 23513.
References
- Akk G, Bracamontes JR, Covey DF, Evers A, Dao T, Steinbach JH. Neuroactive steroids have multiple actions to potentiate GABAA receptors. J Physiol. 2004;558:59–74. doi: 10.1113/jphysiol.2004.066571. [DOI] [PMC free article] [PubMed] [Google Scholar]
- Angelotti TP, Macdonald RL. Assembly of GABAA receptor subunits: α1β1 and α1β1γ2S subunits produce unique ion channels with dissimilar single-channel properties. J Neurosci. 1993;13:1429–1440. doi: 10.1523/JNEUROSCI.13-04-01429.1993. [DOI] [PMC free article] [PubMed] [Google Scholar]
- Auerbach A. Gating of acetylcholine receptor channels: brownian motion across a broad transition state. Proc Natl Acad Sci U S A. 2005;102:1408–1412. doi: 10.1073/pnas.0406787102. [DOI] [PMC free article] [PubMed] [Google Scholar]
- Auerbach A, Zhou Y. Gating reaction mechanisms for NMDA receptor channels. J Neurosci. 2005;25:7914–7923. doi: 10.1523/JNEUROSCI.1471-05.2005. [DOI] [PMC free article] [PubMed] [Google Scholar]
- Bailey DJ, Tetzlaff JE, Cook JM, He X, Helmstetter FJ. Effects of hippocampal injections of a novel ligand selective for the α5β2γ2 subunits of the GABA/benzodiazepine receptor on Pavlovian conditioning. Neurobiol Learn Mem. 2002;78:1–10. doi: 10.1006/nlme.2001.4050. [DOI] [PubMed] [Google Scholar]
- Baulac S, Huberfeld G, Gourfinkel-An I, Mitropoulou G, Beranger A, Prud'homme JF, Baulac M, Brice A, Bruzzone R, LeGuern E. First genetic evidence of GABAA receptor dysfunction in epilepsy: a mutation in the γ2-subunit gene. Nat Genet. 2001;28:46–48. doi: 10.1038/ng0501-46. [DOI] [PubMed] [Google Scholar]
- Bianchi MT, Macdonald RL. Neurosteroids shift partial agonist activation of GABAA receptor channels from low- to high-efficacy gating patterns. J Neurosci. 2003;23:10934–10943. doi: 10.1523/JNEUROSCI.23-34-10934.2003. [DOI] [PMC free article] [PubMed] [Google Scholar]
- Boileau AJ, Evers AR, Davis AF, Czajkowski C. Mapping the agonist binding site of the GABAA receptor: evidence for a β-strand. J Neurosci. 1999;19:4847–4854. doi: 10.1523/JNEUROSCI.19-12-04847.1999. [DOI] [PMC free article] [PubMed] [Google Scholar]
- Burkat PM, Yang J, Gingrich KJ. Dominant gating governing transient GABAA receptor activity: a first latency and Po/o analysis. J Neurosci. 2001;21:7026–7036. doi: 10.1523/JNEUROSCI.21-18-07026.2001. [DOI] [PMC free article] [PubMed] [Google Scholar]
- Burzomato V, Beato M, Groot-Kormelink PJ, Colquhoun D, Sivilotti LG. Single-channel behavior of heteromeric α1β glycine receptors: an attempt to detect a conformational change before the channel opens. J Neurosci. 2004;24:10924–10940. doi: 10.1523/JNEUROSCI.3424-04.2004. [DOI] [PMC free article] [PubMed] [Google Scholar]
- Celentano JJ, Hawkes AG. Use of the covariance matrix in directly fitting kinetic parameters: application to GABAA receptors. Biophys J. 2004;87:276–294. doi: 10.1529/biophysj.103.036632. [DOI] [PMC free article] [PubMed] [Google Scholar]
- Chen L, Wang H, Vicini S, Olsen RW. The γ-aminobutyric acid type A (GABAA) receptor-associated protein (GABARAP) promotes GABAA receptor clustering and modulates the channel kinetics. Proc Natl Acad Sci U S A. 2000;97:11557–11562. doi: 10.1073/pnas.190133497. [DOI] [PMC free article] [PubMed] [Google Scholar]
- Colquhoun D, Hawkes AG. A note on correlations in single ion channel records. Proc R Soc Lond B Biol Sci. 1987;230:15–52. doi: 10.1098/rspb.1987.0008. [DOI] [PubMed] [Google Scholar]
- Cromer BA, Morton CJ, Parker MW. Anxiety over GABAA receptor structure relieved by AChBP. Trends Biochem Sci. 2002;27:280–287. doi: 10.1016/s0968-0004(02)02092-3. [DOI] [PubMed] [Google Scholar]
- Elenes S, Auerbach A. Desensitization of diliganded mouse muscle nicotinic acetylcholine receptor channels. J Physiol. 2002;541:367–383. doi: 10.1113/jphysiol.2001.016022. [DOI] [PMC free article] [PubMed] [Google Scholar]
- Fisher JL, Macdonald RL. Functional properties of recombinant GABAA receptors composed of single or multiple β subunit subtypes. Neuropharmacology. 1997;36:1601–1610. doi: 10.1016/s0028-3908(97)00133-0. [DOI] [PubMed] [Google Scholar]
- Fredkin DR, Montal M, Rice JA. Identification of aggregated markovian models: Application to the nicotinic acetylcholine receptor. In: LeCam LM, Olshen RA, editors. Proceedings of the Berkley Conference in Honor of Jerzy Neyman and Jack Kiefer. Belmont, CA, USA: Wadsworth Publishing Co.; 1985. [Google Scholar]
- Gingrich KJ, Roberts WA, Kass RS. Dependence of the GABAA receptor gating kinetics on the α-subunit isoform: implications for structure–function relations and synaptic transmission. J Physiol. 1995;489:529–543. doi: 10.1113/jphysiol.1995.sp021070. [DOI] [PMC free article] [PubMed] [Google Scholar]
- Greenfield LJ, Jr, Zaman SH, Sutherland ML, Lummis SC, Niemeyer MI, Barnard EA, Macdonald RL. Mutation of the GABAA receptor M1 transmembrane proline increases GABA affinity and reduces barbiturate enhancement. Neuropharmacology. 2002;42:502–521. doi: 10.1016/s0028-3908(01)00196-4. [DOI] [PubMed] [Google Scholar]
- Haas KF, Macdonald RL. GABAA receptor subunit γ2 and δ subtypes confer unique kinetic properties on recombinant GABAA receptor currents in mouse fibroblasts. J Physiol. 1999;514:27–45. doi: 10.1111/j.1469-7793.1999.027af.x. [DOI] [PMC free article] [PubMed] [Google Scholar]
- Hinkle DJ, Macdonald RL. β subunit phosphorylation selectively increases fast desensitization and prolongs deactivation of α1β1γ2L and α1β3γ2L GABAA receptor currents. J Neurosci. 2003;23:11698–11710. doi: 10.1523/JNEUROSCI.23-37-11698.2003. [DOI] [PMC free article] [PubMed] [Google Scholar]
- Jones MV, Jonas P, Sahara Y, Westbrook GL. Microscopic kinetics and energetics distinguish GABAA receptor agonists from antagonists. Biophys J. 2001;81:2660–2670. doi: 10.1016/S0006-3495(01)75909-7. [DOI] [PMC free article] [PubMed] [Google Scholar]
- Jones MV, Westbrook GL. Desensitized states prolong GABAA channel responses to brief agonist pulses. Neuron. 1995;15:181–191. doi: 10.1016/0896-6273(95)90075-6. [DOI] [PubMed] [Google Scholar]
- Kash TL, Trudell JR, Harrison NL. Structural elements involved in activation of the gamma-aminobutyric acid type A (GABAA) receptor. Biochem Soc Trans. 2004;32:540–546. doi: 10.1042/BST0320540. [DOI] [PubMed] [Google Scholar]
- Kienker P. Equivalence of aggregated Markov models of ion-channel gating. Proc R Soc Lond B Biol Sci. 1989;236:269–309. doi: 10.1098/rspb.1989.0024. [DOI] [PubMed] [Google Scholar]
- Koltchine VV, Finn SE, Jenkins A, Nikolaeva N, Lin A, Harrison NL. Agonist gating and isoflurane potentiation in the human γ-aminobutyric acid type A receptor determined by the volume of a second transmembrane domain residue. Mol Pharmacol. 1999;56:1087–1093. doi: 10.1124/mol.56.5.1087. [DOI] [PubMed] [Google Scholar]
- Krasowski MD, Nishikawa K, Nikolaeva N, Lin A, Harrison NL. Methionine 286 in transmembrane domain 3 of the GABAA receptor β subunit controls a binding cavity for propofol and other alkylphenol general anesthetics. Neuropharmacology. 2001;41:952–964. doi: 10.1016/s0028-3908(01)00141-1. [DOI] [PMC free article] [PubMed] [Google Scholar]
- Kucken AM, Wagner DA, Ward PR, Teissere JA, Boileau AJ, Czajkowski C. Identification of benzodiazepine binding site residues in the γ2 subunit of the γ-aminobutyric acidA receptor. Mol Pharmacol. 2000;57:932–939. [PubMed] [Google Scholar]
- Labarca P, Rice JA, Fredkin DR, Montal M. Kinetic analysis of channel gating. Application to the cholinergic receptor channel and the chloride channel from Torpedo californica. Biophys J. 1985;47:469–478. doi: 10.1016/S0006-3495(85)83939-4. [DOI] [PMC free article] [PubMed] [Google Scholar]
- Lavoie AM, Tingey JJ, Harrison NL, Pritchett DB, Twyman RE. Activation and deactivation rates of recombinant GABAA receptor channels are dependent on α-subunit isoform. Biophys J. 1997;73:2518–2526. doi: 10.1016/S0006-3495(97)78280-8. [DOI] [PMC free article] [PubMed] [Google Scholar]
- McClellan AM, Twyman RE. Receptor system response kinetics reveal functional subtypes of native murine and recombinant human GABAA receptors. J Physiol. 1999;515:711–727. doi: 10.1111/j.1469-7793.1999.711ab.x. [DOI] [PMC free article] [PubMed] [Google Scholar]
- Macdonald RL, Rogers CJ, Twyman RE. Kinetic properties of the GABAA receptor main conductance state of mouse spinal cord neurones in culture. J Physiol. 1989;410:479–499. doi: 10.1113/jphysiol.1989.sp017545. [DOI] [PMC free article] [PubMed] [Google Scholar]
- Maconochie DJ, Zempel JM, Steinbach JH. How quickly can GABAA receptors open? Neuron. 1994;12:61–71. doi: 10.1016/0896-6273(94)90152-x. [DOI] [PubMed] [Google Scholar]
- Mercik K, Pytel M, Mozrzymas JW. Recombinant α1β2γ2 GABAA receptors expressed in HEK293 and in QT6 cells show different kinetics. Neurosci Lett. 2003;352:195–198. doi: 10.1016/j.neulet.2003.08.060. [DOI] [PubMed] [Google Scholar]
- Mozrzymas JW, Barberis A, Mercik K, Zarnowska ED. Binding sites, singly bound states, and conformation coupling shape GABA-evoked currents. J Neurophysiol. 2003;89:871–883. doi: 10.1152/jn.00951.2002. [DOI] [PubMed] [Google Scholar]
- Newland CF, Colquhoun D, Cull-Candy SG. Single channels activated by high concentrations of GABA in superior cervical ganglion neurones of the rat. J Physiol. 1991;432:203–233. doi: 10.1113/jphysiol.1991.sp018382. [DOI] [PMC free article] [PubMed] [Google Scholar]
- Nusser Z, Naylor D, Mody I. Synapse-specific contribution of the variation of transmitter concentration to the decay of inhibitory postsynaptic currents. Biophys J. 2001;80:1251–1261. doi: 10.1016/S0006-3495(01)76101-2. [DOI] [PMC free article] [PubMed] [Google Scholar]
- Petrini EM, Zacchi P, Barberis A, Mozrzymas JW, Cherubini E. Declusterization of GABAA receptors affects the kinetic properties of GABAergic currents in cultured hippocampal neurons. J Biol Chem. 2003;278:16271–16279. doi: 10.1074/jbc.M213081200. [DOI] [PubMed] [Google Scholar]
- Popescu G, Auerbach A. Modal gating of NMDA receptors and the shape of their synaptic response. Nat Neurosci. 2003;6:476–483. doi: 10.1038/nn1044. [DOI] [PubMed] [Google Scholar]
- Popescu G, Robert A, Howe JR, Auerbach A. Reaction mechanism determines NMDA receptor response to repetitive stimulation. Nature. 2004;430:790–793. doi: 10.1038/nature02775. [DOI] [PubMed] [Google Scholar]
- Qin F. Restoration of single-channel currents using the segmental k-means method based on hidden Markov modeling. Biophys J. 2004;86:1488–1501. doi: 10.1016/S0006-3495(04)74217-4. [DOI] [PMC free article] [PubMed] [Google Scholar]
- Qin F, Auerbach A, Sachs F. Estimating single-channel kinetic parameters from idealized patch-clamp data containing missed events. Biophys J. 1996;70:264–280. doi: 10.1016/S0006-3495(96)79568-1. [DOI] [PMC free article] [PubMed] [Google Scholar]
- Salamone FN, Zhou M, Auerbach A. A re-examination of adult mouse nicotinic acetylcholine receptor channel activation kinetics. J Physiol. 1999;516:315–330. doi: 10.1111/j.1469-7793.1999.0315v.x. [DOI] [PMC free article] [PubMed] [Google Scholar]
- Sanford LD, Tang X, Xiao J, Ross RJ, Morrison AR. GABAergic regulation of REM sleep in reticularis pontis oralis and caudalis in rats. J Neurophysiol. 2003;90:938–945. doi: 10.1152/jn.00993.2002. [DOI] [PubMed] [Google Scholar]
- Sieghart W, Fuchs K, Tretter V, Ebert V, Jechlinger M, Hoger H, Adamiker D. Structure and subunit composition of GABAA receptors. Neurochem Int. 1999;34:379–385. doi: 10.1016/s0197-0186(99)00045-5. [DOI] [PubMed] [Google Scholar]
- Smith SS, Gong QH. Ethanol administration rapidly reverses α4 GABAA receptor subunit upregulation following steroid exposure. Neuropharmacology. 2004;47:9–16. doi: 10.1016/j.neuropharm.2004.03.010. [DOI] [PubMed] [Google Scholar]
- Steiger JL, Russek SJ. GABAA receptors: building the bridge between subunit mRNAs, their promoters, and cognate transcription factors. Pharmacol Ther. 2004;101:259–281. doi: 10.1016/j.pharmthera.2003.12.002. [DOI] [PubMed] [Google Scholar]
- Steinbach JH, Akk G. Modulation of GABAA receptor channel gating by pentobarbital. J Physiol. 2001;537:715–733. doi: 10.1111/j.1469-7793.2001.00715.x. [DOI] [PMC free article] [PubMed] [Google Scholar]
- Sternfeld F, Carling RW, Jelley RA, Ladduwahetty T, Merchant KJ, Moore KW, Reeve AJ, Street LJ, O'Connor D, Sohal B, Atack JR, Cook S, Seabrook G, Wafford K, Tattersall FD, Collinson N, Dawson GR, Castro JL, MacLeod AM. Selective, orally active γ-aminobutyric acidAα5 receptor inverse agonists as cognition enhancers. J Med Chem. 2004;47:2176–2179. doi: 10.1021/jm031076j. [DOI] [PubMed] [Google Scholar]
- Twyman RE, Rogers CJ, Macdonald RL. Intraburst kinetic properties of the GABAA receptor main conductance state of mouse spinal cord neurones in culture. J Physiol. 1990;423:193–220. doi: 10.1113/jphysiol.1990.sp018018. [DOI] [PMC free article] [PubMed] [Google Scholar]
- Wallace RH, Marini C, Petrou S, Harkin LA, Bowser DN, Panchal RG, Williams DA, Sutherland GR, Mulley JC, Scheffer IE, Berkovic SF. Mutant GABAA receptor γ2-subunit in childhood absence epilepsy and febrile seizures. Nat Genet. 2001;28:49–52. doi: 10.1038/ng0501-49. [DOI] [PubMed] [Google Scholar]
- Weiss DS, Magleby KL. Gating scheme for single GABA-activated Cl− channels determined from stability plots, dwell-time distributions, and adjacent-interval durations. J Neurosci. 1989;9:1314–1324. doi: 10.1523/JNEUROSCI.09-04-01314.1989. [DOI] [PMC free article] [PubMed] [Google Scholar]