

Abstract
The fat-derived peptide leptin regulates cellular activity in areas of the CNS related to feeding, and application of leptin to the fourth ventricle or the nucleus tractus solitarii (NTS) inhibits food intake and weight gain. The hypothesis that leptin modulates cellular activity in the NTS was tested using whole-cell patch-clamp recordings in brainstem slices. Leptin caused a rapid membrane hyperpolarization in 58% of rat NTS neurones, including neurones receiving tractus solitarius input (i.e. viscerosensory) and those involved in regulating output to the stomach, identified after gastric inoculation with a transneuronal retrograde viral label. The hyperpolarization was accompanied by a decrease in input resistance and cellular responsiveness, reversed near the K+ equilibrium potential, and was prevented by intracellular Cs+. Perfusion of tolbutamide (200 μm) or wortmannin (100–200 nm) prevented the hyperpolarization, indicating activation of an ATP-sensitive K+ channel via a PI3 kinase-dependent mechanism. Constant latency tractus solitarius-evoked EPSCs were decreased in amplitude by leptin, and the paired-pulse ratio was increased, suggesting effects on evoked EPSCs involved activation of receptors on vagal afferent terminals. Leptin reduced the frequency of spontaneous and miniature EPSCs, whereas IPSCs were largely unaffected. Leptin's effects were observed in neurones from lean, but not obese, Zucker rats. Neurones that expressed enhanced green fluorescent protein (EGFP) in a subpopulation of putative GABAergic neurones in transgenic mice did not respond to leptin, whereas unlabelled murine neurones responded similarly to rat neurones. Leptin therefore directly and rapidly suppresses activity of excitatory NTS neurones likely to be involved in viscerosensory integration and/or premotor control of the stomach.
The homeostatic regulatory peptide leptin is the product of the obese gene (Ob) and is produced largely by adipose cells (Zhang et al. 1994), with additional production by skeletal muscle (Wang et al. 1998) and the fundus of the stomach (Bado et al. 1998). Intraperitoneal (i.p.) and intracerebroventricular (i.c.v.) injection of leptin reduces food intake and weight gain in rats (Halaas et al. 1995; Seeley et al. 1996; Grill et al. 2002). A leptin-induced, modulation of neuronal activity has been observed in diencephalic and brainstem nuclei associated with feeding and autonomic regulation (Woods & Stock, 1996; Elmquist et al. 1997; Spanswick et al. 1997; Powis et al. 1998; Cowley et al. 2001; Schwartz & Moran, 2002). These data have led to speculation that leptin regulates energy homeostasis by acting on neural circuits associated with feeding.
The dorsal vagal complex (DVC), a major autonomic centre in the caudal brainstem, includes area postrema (AP), dorsal motor nucleus of the vagus (DMV), and nucleus tractus solitarii (NTS). Caudal NTS subnuclei receive and process viscerosensory information from thoracic and abdominal viscera. The NTS is reciprocally connected with various brain areas, including brainstem and hypothalamic areas that regulate appetitive functions (Kalia & Sullivan, 1982; Sawchenko, 1983). Additionally, the NTS contains fenestrated capillaries, potentially allowing circulating peptides access to the nucleus (Gross et al. 1990; Gross et al. 1991). Thus, neurones in the NTS process information arising from a variety of neural and humoral sources. It is therefore in a prime position to rapidly modify ingestive behaviour in direct response to transiently altered plasma levels of leptin, as occurs with leptin's diurnal rhythm or when fasted animals are fed (Saladin et al. 1995; Kolaczynski et al. 1996).
Leptin receptor RNA and protein are found in brain areas involved in feeding regulation, including the DVC (Elmquist et al. 1998; Shioda et al. 1998; Grill et al. 2002). Accordingly, increases in c-fos expression have been reported in the NTS 2–6 h after peripheral or central leptin administration (Elmquist et al. 1997; Elias et al. 2000). Fourth ventricle administration of leptin reduces food ingestion and weight gain within 24 h and these effects are mimicked by microinjection of the peptide into the NTS (Grill et al. 2002). Also, increases in NTS unit activity have been observed 2 h after peripheral or third ventricle administration of leptin (Yuan et al. 1999; Schwartz & Moran, 2002). These results implicate a role for the DVC in the feeding modulation attributed to leptin. However, these studies were performed on a long time scale and did not address possible direct cellular effects of leptin within the NTS, which appear likely but have never been studied.
In the present study, the hypothesis that leptin rapidly modulates cellular activity by direct action in the NTS was tested using whole-cell recordings in medullary slices from rats and transgenic mice. Acute effects of leptin were assessed on intrinsic membrane properties and synaptic responses in NTS neurones, including subsets of second order viscerosensory cells, putative gastric-related premotor neurones, and GABAergic neurones.
Methods
Animals
Adult male (21- to 60-day-old) Sprague-Dawley rats (Harlan, Indianapolis, IN, USA), lean and obese Zucker rats (a gift from Dr J. Porter, LSU School of Dentistry, New Orleans, LA, USA), and transgenic mice that expressed enhanced green fluorescent protein (EGFP) under control of the GAD67 promoter allowing for identification of a subpopulation of GABAergic Inhibitory Neurones (i.e. GIN mice) (Oliva et al. 2000) were used for these experiments. Animals were housed in a vivarium under a 12 h light–dark cycle with food and water available ad libitum. The Tulane University Animal Care and Use Committee approved all animal procedures.
Retrograde transsynaptic neuronal tracing
Use of a transsynaptic retrograde label using pseudorabies virus (Bartha strain: PRV-152; a gift from L. W. Enquist, Princeton University) expressing EGFP has been extensively described (Smith et al. 2000; Irnaten et al. 2001; Davis et al. 2003; Glatzer et al. 2003; Derbenev et al. 2004; Glatzer & Smith, 2005). Under sodium pentobarbital anaesthesia (50 mg kg−1, i.p.), rats received injections of PRV-152 (2 × 10⁸ pfu ml−1) directed tangentially into the musculature of the greater curvature of the stomach using a Hamilton syringe fitted with a 26-gauge needle. Rats were maintained in a biosafety level 2 laboratory for up to 75 h post-injection, at which time the incidence of transsynaptic labelling in the NTS has peaked (Glatzer et al. 2003). This type of injection results in a relatively selective and sequential transsynaptic labelling of NTS neurones related to gastric motor control (Card et al. 1993; Rinaman et al. 1993; Glatzer et al. 2003). It has previously been shown that injection into the lumen, on the gastric surface, or intraperitoneal injection (i.e. not intramuscular) does not result in specific uptake of the virus into the DVC in this time frame. Recordings in this study were limited to infection times < 75 h, a time at which no apparent degradation of membrane or synaptic properties has been identified (Card et al. 1993; Rinaman et al. 1993; Smith et al. 2000; Irnaten et al. 2001; Davis et al. 2003; Glatzer et al. 2003; Derbenev et al. 2004; Glatzer & Smith, 2005).
Tissue preparation
Whole-cell patch-clamp recordings were made in transverse brainstem slices (300–400 μm) containing the NTS from rats or mice (21–60 days old). Under deep anaesthesia (sodium pentobarbital; 100 mg kg−1, i.p.) or halothane inhalation, animals were decapitated and the brainstem removed and immersed in ice-cold (0–4°C), oxygenated (95% O2−5% CO2) artificial cerebrospinal fluid (ACSF) containing (mm): 124 NaCl, 3 KCl, 26 NaHCO3, 1.4 NaH2PO4, 11 glucose, 1.3 CaCl2, and 1.3 MgCl2, pH 7.3–7.4, with an osmolality of 290–305 mosmol kg−1. The brainstem then was mounted on a glass stage and transverse slices were cut with a vibratome. The slices were then transferred to a submersion-type recording chamber mounted on a fixed-stage platform under an upright microscope (Olympus BX50WI, Melville, NY, USA).
After an equilibration period of 1–2 h, whole-cell patch-clamp recordings were obtained from neurones in the NTS using patch pipettes with open tip resistance of 2–5 MΩ. Seal resistance was 1–5 GΩ and series resistance was < 24 MΩ, uncompensated. Patch pipettes were filled with (mm): 130–140 potassium or caesium gluconate, 1 NaCl, 5 EGTA, 10 Hepes, 1 MgCl2, 1 CaCl2, 3 KOH or CsOH, 2–4 ATP; biocytin, 0.2%; pH 7.2. Added to the ACSF for specific experiments were: tetrodotoxin (TTX; 2 μm; Sigma, St Louis, MO, USA or Alomone Laboratories, Jerusalem, Israel), 6-cyano-7-nitroquinoxaline-2,3-dione (CNQX; 10 μm; Sigma), bicuculline methiodide (30 μm; Sigma), picrotoxin (PTX; 50–100 μm; Sigma), dl-2-amino-5-phosphono-valeric acid (APV; 50 μm; Sigma), tolbutamide (200 μm; Sigma), wortmannin (100–200 nm; Alomone Laboratories), and leptin (10 nm to 1 μm; Sigma; or PeproTech, Rocky Hill, NJ, USA). Wortmannin was dissolved in dimethylsulphoxide (DMSO) as a 5-mm stock solution and added to ACSF to obtain a final DMSO concentration of < 0.01%. Tolbutamide was dissolved in 100% ethanol, with the final ethanol concentration in ACSF of < 0.5%. Leptin was reconstituted in 15 mm HCl, pH normalized with NaOH. For all solvents, vehicle alone at the final concentration was without effect in separate recordings from NTS neurones. All other drugs were dissolved directly in the ACSF. Recording pipettes were pulled from borosilicate glass capillaries of 1.65 mm outer diameter and 0.45 mm wall thickness (Garner Glass Co., Claremont, CA, USA). Electrophysiological signals were recorded using an Axopatch 200B amplifier (Axon Instruments, Union City, CA, USA), low-pass filtered at 5 kHz, digitized at 88 kHz (Neuro-corder, Cygnus Technology, Delaware Water Gap, PA, USA), stored on videotape, and analysed off-line on a PC with pCLAMP programs (Axon Instruments) or Mini-analysis (Synaptosoft, Decatur, GA, USA). Recordings were performed under visual control in a recording chamber on an upright, fixed-stage microscope equipped with infrared differential interference contrast (IR-DIC) and epifluorescence to identify non-labelled and EGFP-labelled cells (Olympus BX50WI). Epifluorescence was briefly used to target fluorescent cells, at which time the light source was switched to IR-DIC to obtain the whole-cell recording. Once in the whole-cell configuration, cells were voltage clamped for 5 min near resting membrane potential (determined by temporarily removing the voltage clamp) to allow equilibration of recording pipette contents with the intracellular milieu. Synaptic currents were examined at holding potentials positive and negative to resting membrane potential (−30 to 0 mV for IPSCs and −60 to −80 mV for EPSCs). Current-clamp (i.e. voltage) recordings were performed at resting membrane potential. Input resistance was assessed by measuring voltage deflection at the end of the response to injected rectangular current pulses (100–500 ms of ±10–50 pA).
Stimulation and recording
Electrical stimulation of primary afferents was performed using a concentric bipolar electrode (125 μm outer diameter, 12.5 μm inner diameter; FHC, Bowdoinham, ME, USA) placed over the tractus solitarius (TS). The stimulus intensity required for minimum response was determined and then the intensity increased until the response was consistently obtained over 10 consecutive stimuli at 4–5 s intervals (0.20–0.25 Hz). At these stimulation intervals, the EPSC amplitude was consistent from pulse to pulse, indicative of full recovery before application of subsequent stimuli. Pairs or trains of stimuli (25–50 Hz interpulse frequency) were applied to establish constant latency, high frequency following, and frequency-dependent suppression of EPSC amplitude, characteristics of putative monosynaptic visceral afferent input to NTS neurones (Miles, 1986; Smith et al. 1998; Doyle & Andresen, 2001).
Analysis
A value of twice the mean peak-to-peak noise level for a given recording in control solutions was used as the detection limit for minimum postsynaptic current (PSC) amplitude (i.e. typically ∼5 pA). For spontaneous excitatory and inhibitory PSCs (i.e. sEPSCs and sIPSCs), at least 2 min of activity was examined to identify leptin effects on amplitude and frequency distributions. Effects of leptin on spontaneous PSC frequency before, during and after drug application were analysed within a recording using the Kolmogorov-Smirnov test. Typically 100–300 events were compared in order to obtain statistical significance with this test. Pooled results from responding cells were analysed using Student's t test for paired data; multiple groups of cells were compared using ANOVA. Proportions of responding cells from different groups were analysed using a χ2 test of independence. Effects of leptin on spontaneous PSC amplitude and evoked PSC amplitude were analysed using a paired two-tailed t test. Measurements of 5–10 electrically evoked responses were used to obtain mean synaptic current amplitudes. Paired pulse ratios (PPR) were used as indirect measures of changes in the probability of release, in which a change in the amplitude ratio of the first to the second response to paired TS stimuli implied a presynaptic site of action. Membrane potential values were compensated to account for junction potential (−8 mV). Results are reported as the mean ± standard error of the mean (s.e.m.) unless indicated otherwise; significance was set at P < 0.05 for all statistical measures.
Histology
Recorded neurons were identified as EGFP-labelled as previously described (Smith et al. 2000; Glatzer et al. 2003; Glatzer & Smith, 2005) via real-time visualization under fluorescence microscopy and/or via post hoc identification utilizing the avidin–Texas Red reaction (Fig. 1). Subsequent to recording, slices were fixed in 4% paraformaldehyde in 0.15 m sodium phosphate buffer overnight. After rinsing 3× with 0.01 m phosphate buffered saline (PBS), EGFP-labelled slices (PRV-152 rat and GIN mice) containing recorded, biocytin-filled neurones were immersed in Texas Red-conjugated avidin (1: 400; Vector Laboratories, Burlingame, CA, USA) to visualize the filled neurones. Slices were then washed in PBS, mounted on glass slides, and visualized using epifluorescence illumination (Leica DMLB) and a Spot RT CCD camera (Diagnostic Instruments, Sterling Heights, MI, USA) or a confocal microscope (Zeiss LSM 510 META).
Figure 1. NTS neurones which expressed enhanced green fluorescent protein (EGFP) were visualized and targeted for whole-cell recordings.
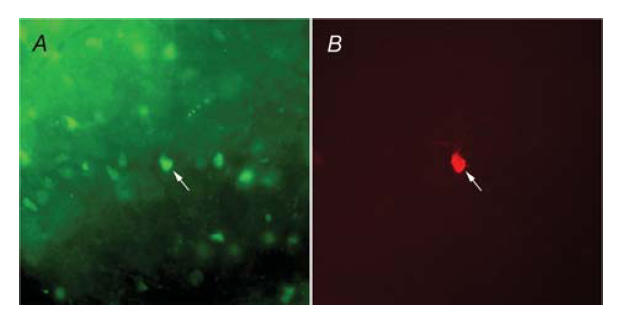
A, fluorescence illumination of a gastric-related EGFP-labelled NTS neurone targeted for recording. B, image of the same biocytin-filled neurone, visualized using filters for Texas Red–Avidin. Arrows point to the targeted neurone in both images.
Results
Membrane properties of NTS neurones
Whole-cell patch-clamp recordings were made in 155 caudal NTS neurones. One hundred and ten NTS neurones were from Sprague-Dawley rats (16 PRV-152 EGFP-labelled and 94 unidentified), 15 were from lean Zucker rats, and 17 from obese Zucker rats. Another seven cells expressed EGFP under the transcriptional control of the GAD67 promoter in GIN mice, and six non-EGFP expressing neurones were recorded from the same GIN mice. The labelled neurones in the GIN mice are hereafter referred to as GAD67/EGFP-expressing. When K+ was used as the major cation in the recording pipette, NTS neurones in Sprague-Dawley rats (n = 100) had a resting membrane potential of −60.2 ± 1.0 mV, a mean input resistance of 767.9 ± 57.8 MΩ, and overshooting action potentials.
When compared to values obtained from unidentified NTS neurones (−60.9 ± 1.1 mV; 765.07 ± 67.6 MΩ; n = 84), no significant variation was observed for resting membrane potential and input resistance in PRV-152 EGFP-labelled neurones (−59 ± 2.9 mV; 801.0 ± 227.8 MΩ; not significant (NS)), neurones from lean Zucker (−60.0 ± 4.3 mV; 601.4 ± 146.8 MΩ; NS), or obese Zucker rats (−59.9 ± 3.5 mV; 539.0 ± 98.8 MΩ; NS). In addition, the resting membrane potential and membrane input resistance of GAD67/EGFP-expressing neurones in GIN mice (−61.3 ± 5.4 mV and 1026.5 ± 234.2 MΩ, respectively) were not statistically different from neurones that did not express GAD67/EGFP in the same mice (−59.3 ± 3.9 mV; 1156.3 ± 291.2 MΩ; NS). NTS neurones from rats and mice both received EPSCs and IPSCs, which could be blocked by application of ionotropic glutamate receptor antagonists (i.e. CNQX and AP5) or GABAA receptor antagonists (i.e. picrotoxin or bicuculline), respectively, as previously described (Smith et al. 1998; Smith et al. 2002; Glatzer et al. 2003; Davis et al. 2004; Glatzer & Smith, 2005). There were no statistically significant differences in these measures between different neuronal groups or neurones from rats and mice (P > 0.05, ANOVA, repeated measures).
Effects of leptin on membrane potential
In order to analyse leptin effects on membrane potential, NTS neurones from rats were recorded at rest in current-clamp mode. Alternatively, neurones recorded in voltage-clamp mode were transiently monitored for changes in resting membrane potential by periodically removing voltage clamp (i.e. switch to I = 0) to monitor resting membrane potential. Bath application of leptin (100 nm) caused a rapid (range = 2–10 min) membrane hyperpolarization of −7.8 ± 0.8 mV from rest in 33 of 60 unidentified NTS neurones from Sprague-Dawley rats (Fig. 2). Within a recording, the hyperpolarization was at least partially reversible within 15 min in 24 neurones and repeatable in subsequent applications in 10 neurones. The membrane potential of the remaining neurones either depolarized (3.6 ± 0.7 mV; n = 8) or remained unchanged (−0.2 ± 0.3 mV; n = 19). Application of different concentrations of leptin from 10 to 300 nm resulted in a concentration-dependent hyperpolarization of the membrane potential (Fig. 2). The hyperpolarization induced by leptin (100 nm) was observed in the presence of TTX (2 μm; −4.9 ± 0.5 mV; 5 of 7 cells), indicative of a direct membrane hyperpolarization independent of action potential-mediated synaptic transmission.
Figure 2. Leptin induced a hyperpolarization of the resting membrane potential.
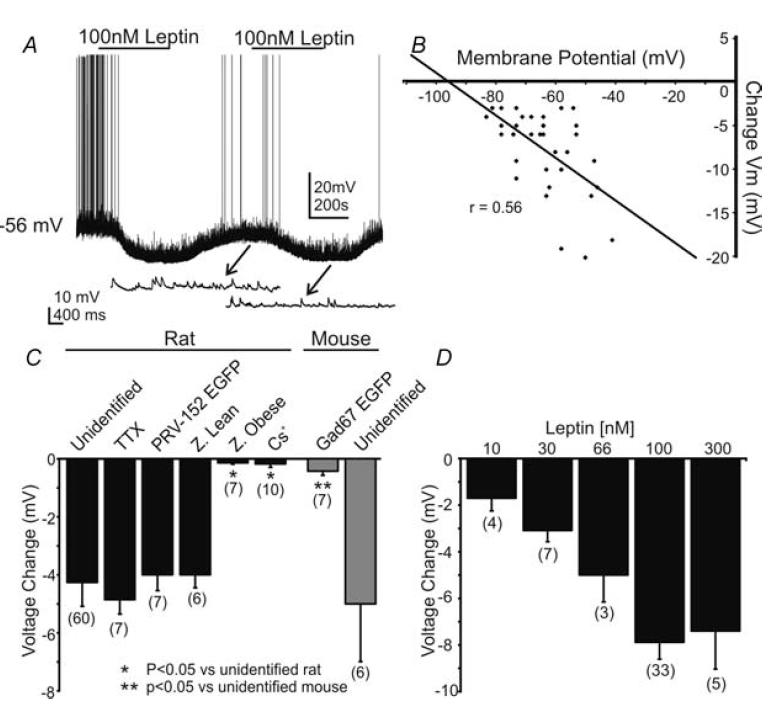
A, current-clamp record depicting the characteristic hyperpolarization of an unidentified NTS neurone by leptin (100 nm) at resting membrane potential (−56 mV). Arrows point to expanded portions showing the underlying EPSPs. The hyperpolarization was reversible within 10 min, with the membrane returning to −58 mV, and repeatable in the same neurone. B, plot of hyperpolarization as a function of resting membrane potential. The regression line reveals a correlation (r = 0.56) between the hyperpolarization amplitude and the resting membrane potential of the cell. C, bar graph demonstrating the leptin-induced hyperpolarization in the neurone populations examined in rats and mice. Unidentified, NTS neurones in normal ACSF; TTX, neurones recorded in the presence of tetrodotoxin; PRV-152 EGFP, neurones labelled retrogradely from the stomach; Z. lean and Z. Obese, neurones from Zucker rats; Cs+, recordings made with Cs+ in the recording pipette; GAD67 EGFP, murine neurones that expressed EGFP under a GAD67 promoter in transgenic mice; unidentified, non-labelled NTS neurones in transgenic mice. Number of neurones for each group is indicated in parentheses. D, histogram showing the concentration dependence of the response to leptin in unidentified NTS neurones. Number of replicates at each concentration is in parentheses above each bar.
The amplitude of the hyperpolarization was plotted as a function of the resting membrane potential at the time of leptin application. Extrapolation of linear regression plots revealed an estimated reversal potential of −95.6 mV for the hyperpolarization (n = 33; Fig. 2), which is near the calculated K+ equilibrium (calculated EK = −99.7 mV). Additionally, no change in membrane potential was observed in any neurones in which Cs+ was used as the major cation in the recording pipette (−0.2 ± 0.1 mV; n = 10), indicating K+ as the major cation responsible for the membrane hyperpolarization. Unidentified rat NTS neurones (n = 13) were voltage-clamped at membrane potentials between −50 and −70 mV, and changes in whole cell current were monitored during bath application of leptin. Twelve of these neurones displayed a change in whole-cell current subsequent to leptin application. Superfusion of leptin (100 nm) resulted in an outward current in 9 of 13 cells (+10.4 ± 3.4 pA). The remaining cells showed either a very small inward current (−4.0 ± 1.5 pA; n = 3) or were unaffected (0 pA; n = 1). These data suggested that leptin rapidly induced a K+-dependent membrane hyperpolarization, and resulted in an outward current in the majority of rat NTS neurones.
Obese Zucker rats (fa/fa) have a single point mutation in the long form of the leptin receptor (Ob-Rb), which reduces activation of intracellular signalling cascades subsequent to leptin binding, whereas the homozygous (Fa/Fa) and heterozygous lean Zucker rats (Fa/fa) have functional Ob-Rb signalling. A hyperpolarization was observed after leptin application (100 nm) in 5 of 6 neurones from lean Zucker rats (−4.8 ± 1.9 mV; n = 5; Fig. 2). However, no effect of leptin on membrane potential was detected in any neurone from obese Zucker rats (−0.1 ± 0.2 mV; n = 7), implicating the leptin receptor in the response.
Leptin effects on neuronal excitability
In current clamp configuration, rectangular current steps (400 ms; ±10–20 pA) were applied to the membrane in order to test the hypothesis that the leptin-induced hyperpolarization was associated with a modulation of neuronal excitability. The hyperpolarization was accompanied by a 38.4% decrease in whole-cell input resistance, such that the input resistance was reduced from 702.5 ± 86.7 MΩ in control ACSF to 432.8 ± 56.5 MΩ in leptin (n = 21; n = 16 from unidentified Sprague-Dawley rats and n = 5 from lean Zucker rats; Fig. 3). No change in whole-cell input resistance was detected in obese Zucker rats (666.7 ± 117.9 MΩ in control ACSF to 643.2 ± 100.1 MΩ in leptin; n = 3). Overshooting action potentials were evoked by applying depolarizing current steps (10–20 pA). The leptin-induced hyperpolarization was accompanied by a decrease in action potential frequency in response to depolarizing current injection (Fig. 3). Leptin therefore activated a membrane conductance (i.e. a putative K+ current) and decreased the excitability of NTS neurones.
Figure 3. Leptin induced a decrease in whole-cell input resistance and responsiveness.
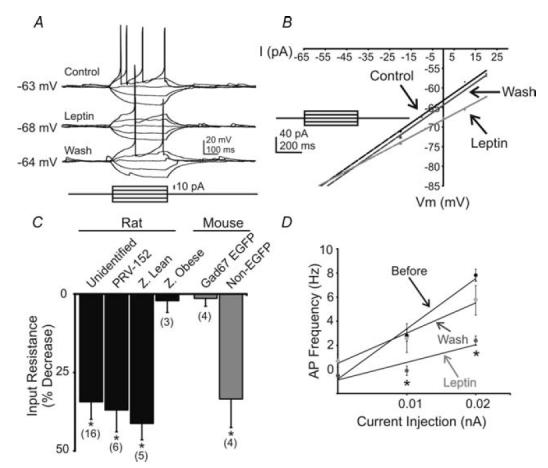
A, current-clamp recording from an unidentified NTS neurone showing a decreased voltage deflection and action potential firing in response to current injection after leptin application (100 nm). B, current versus voltage (I–V) plot from an unidentified NTS neurone illustrating a characteristic decrease in input resistance subsequent to leptin application. Arrows indicate responses before, during and after leptin application. C, plot demonstrating decreases in whole-cell input resistance from the neurone groups examined. Asterisks indicate populations in which a significant reduction in input resistance was observed (P < 0.05). D, current versus frequency (I–F) plot demonstrates the leptin-induced suppression of action potentials in NTS cells that were also hyperpolarized (n = 9).
Mechanisms of leptin-induced hyperpolarization
Leptin alters membrane potential via an ATP-sensitive K+ conductance in cell cultures and hypothalamic neurones (Spanswick et al. 1997; Spanswick et al. 2000; Mirshamsi et al. 2004), and this involved a phosphoinositide 3 kinase (PI3K)-mediated mechanism in hypothalamic cell lines (Harvey et al. 1997) and hypothalamic brain slices (Mirshamsi et al. 2004). In order to investigate whether a similar conductance contributed to the leptin-induced hyperpolarization in NTS neurones, tolbutamide was used to block ATP-sensitive K+ channels and the selective PI3K inhibitor, wortmannin, was used to test the contribution of PI3K to the leptin-induced hyperpolarization. In 12 of 14 neurones tested, bath application of tolbutamide (200 μm) induced a 9.7 ± 2.2 mV depolarization (n = 12). In current-clamp configuration, rectangular current steps (400 ms; ± 20pA) were applied to the membrane in order to obtain a current-voltage (I–V) plot. Subsequent linear regression analysis revealed the reversal potential of the tolbutamide-induced depolarization to be −93.1 ± 6.1 mV (n = 5), suggesting a decreased potassium conductance. Tolbutamide prevented the leptin-induced hyperpolarization in five neurones that had hyperpolarized during a prior application of leptin (Fig. 4), implicating an ATP-sensitive K+ channel in the response to leptin. When bath applied at resting membrane potential, wortmannin (100–200 nm) induced a depolarization in 5 of 9 neurones tested (3.3 ± 0.5 mV, n = 5; RMP = −58.9 ± 1.8 mV). By comparison, responses to tolbutamide in an equivalent range of resting membrane potentials was 4.1 ± 0.5 mV (n = 6; RMP = −57.0 ± 2.1 mV). In addition, wortmannin occluded the tolbutamide-induced depolarization in five neurones in which wortmannin was applied prior to tolbutamide (Fig. 4), confirming previous data showing that the ATP-sensitive K+ conductance required PI3K activation (Harvey et al. 2000a, b; Mirshamsi et al. 2004). Wortmannin inhibited the leptin-induced membrane hyperpolarization by 72% in four cells that had previously responded to leptin and prevented the leptin-induced hyperpolarization in another five neurones, implicating involvement of PI3 kinase in the leptin-induced membrane hyperpolarization (Fig. 4). Together, these data suggested that the leptin-induced membrane hyperpolarization involved activation of an ATP-sensitive K+ channel via a PI3 kinase-dependent mechanism in NTS neurones.
Figure 4. The sulphonylurea tolbutamide and the selective PI3K inhibitor wortmannin blocked the leptin-induced hyperpolarization in NTS neurones.
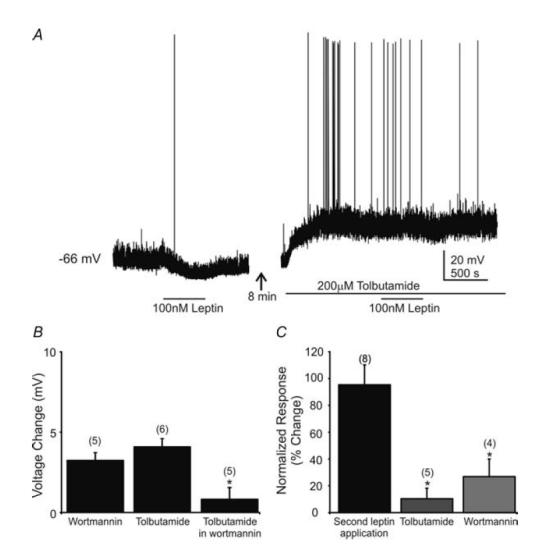
A, current-clamp recording at resting membrane potential showing a leptin-induced hyperpolarization (100 nm) followed by tolbutamide (200 μm) blockade of the leptin effect. Leptin superfusion (represented by horizontal bar) resulted in a 5 mV hyperpolarization. After washout of leptin, addition of tolbutamide depolarized the cell by 19 mV. Addition of leptin in the presence of tolbutamide had no effect. B, bar graph showing the effect of tolbutamide and wortmannin alone on NTS cells and the lack of a tolbutamide effect when in the presence of wortmannin (replicate number in parentheses above bars). Asterisk indicates wortmannin significantly occluded the tolbutamide-induced depolarization (P < 0.05). C, tolbutamide or wortmannin prevented the leptin-induced hyperpolarization. Plot indicates the response to a second application of leptin, normalized to the amplitude of the hyperpolarization seen after the first application, which was made in normal ACSF. The response to the second application in normal ACSF was not different from the first. Addition of tolbutamide or wortmannin prior to the second leptin application resulted in a significantly reduced response to leptin (response 2 amplitude/response 1 amplitude × 100%). Asterisks indicate significant difference from first response to leptin (P < 0.05); numbers of replicates are in parentheses.
Leptin effects on membrane potential in gastric-related NTS neurones
Gastric-related neurones were identified for targeted recordings after inoculation of the stomach wall with PRV-152 and subsequent retrograde transsynaptic labelling of NTS cells that projected to DMV motor neurones, as previously described in detail (Glatzer et al. 2003; Glatzer & Smith, 2005). Leptin application (100 nm) caused a membrane hyperpolarization in 6 of 7 neurones expressing EGFP after PRV-152 inoculation of the stomach (−5.8 ± 1.3 mV; Fig. 2). Similar to unidentified rat NTS neurones, the membrane hyperpolarization was accompanied by a 35% decrease in whole cell input resistance, such that the input resistance was reduced from 666.7 ± 117.9 MΩ in control ACSF to 432.4 ± 101.1 MΩ in leptin (n = 6; Fig. 3) and a decrease in action potential frequency, indicating that leptin suppressed the cellular activity of gastric-related NTS neurones. Although a large majority of PRV-152 labelled neurones was hyperpolarized by leptin (86%), the proportion of cells responding was not statistically different from that of the unlabelled neurone population (58%; NS; χ2 test).
Effects on excitatory synaptic transmission evoked from TS
A concentric bipolar stimulating electrode (125 μm diameter) was placed over TS to test the hypothesis that leptin suppresses primary viscerosensory input to NTS neurones, recorded in voltage-clamp mode. Subsequent to TS stimulation, 6 of 14 neurones from unidentified rats received short- and constant-latency-evoked EPSCs (variability < 0.5 ms within a recording; onset latency = 4.1 ± 0.3 ms; n = 6). Of these six neurones, three were recorded using K+ as the primary intracellular cation and three were recorded using Cs+ as the major cation. Leptin (100 nm) induced a hyperpolarization in each of the three neurones that both received constant-latency TS excitatory input and were recorded with K+ as the major intracellular cation, suggesting a leptin-induced inhibition of neurones that receive primary viscerosensory input. Leptin also reversibly diminished the amplitude of constant-latency evoked EPSCs in 5 of 6 neurones from −89.0 ± 20.3 pA in control ACSF to −62.9 ± 18.7 pA in leptin (29.4% decrease from control; n = 5; P < 0.05, paired t test; Fig. 5). Of these neurones, three were Cs+-loaded, suggesting the effect of leptin on evoked EPSC amplitude was not simply due to a change in input resistance secondary to postsynaptic leptin receptor activation. The PPR was examined in order to assess whether leptin may have acted presynaptically to suppress constant-latency EPSCs. Stimuli paired at 25–50 Hz revealed a paired-pulse depression in EPSC amplitude, where the amplitude of the second evoked EPSC was smaller than the first, typical of putative second order viscerosensory neurones (Miles, 1986; Smith et al. 1998; Doyle & Andresen, 2001). Bath application of leptin suppressed the amplitude of the first evoked EPSC to a larger degree than the second in all affected cells, revealing an increase in the paired-pulse ratio from 0.57 ± 0.05 in control ACSF to 0.75 ± 0.06 in leptin (n = 5; P < 0.05, t test; Fig. 5). Other neurones (n = 8) received input of variable and/or long latency associated with the stimulus (latency > 6 ms; latency variability > 0.5 ms). Bath application of leptin decreased the amplitude of EPSCs in four of these eight NTS neurones, including two of three PRV-152 EGFP-labelled NTS neurones. These data indicated that leptin decreased excitatory input evoked by stimulation of the TS.
Figure 5. Leptin suppressed constant-latency EPSCs evoked after TS stimulation.
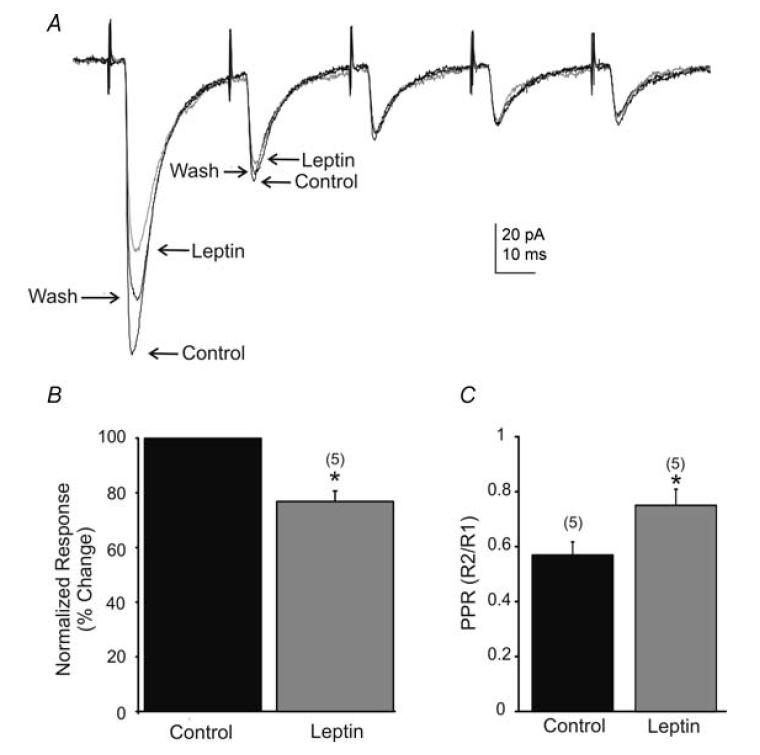
A, traces showing the average response to TS-evoked EPSCs before, during, and 10 min after perfusion of leptin (100 nm; Vm = −65 mV). Pairs of pulses were generated 30 ms (33 Hz) apart, resulting in EPSCs with characteristic paired-pulse depression of the second and subsequent pulses. B, percentage suppression of evoked EPSC amplitude of the first response to TS stimulation. Evoked EPSC amplitude was significantly reduced by leptin. C, shown is a significant increase (asterisks; P < 0.05, t test) in the paired-pulse ratios (PPR) of TS stimulation (numbers of cells are in parentheses).
Effects on spontaneous excitatory synaptic transmission
The effects of leptin on spontaneous excitatory postsynaptic potentials (sEPSPs) were analysed in seven unidentified rat NTS neurones. Neurones were recorded at resting membrane potential in current-clamp mode. Leptin (100 nm) decreased the frequency of depolarizing postsynaptic potentials in four of seven neurones (P < 0.05; Kolmogorov-Smirnov test). In these four neurones, the frequency of sEPSPs was reduced from 2.8 ± 0.6 Hz in control ACSF to 1.9 ± 0.7 Hz in leptin (32.6% decrease from control; n = 4; P < 0.05; paired t test), with synaptic input to the remaining three cells being unchanged. The amplitude of depolarizing postsynaptic potentials in these seven neurones was variably affected, being suppressed in two neurones, enhanced in three neurones, and unchanged in the remaining two cells. These data indicated a suppression of overall excitatory synaptic input in the NTS.
In order to better describe the effects of leptin on excitatory synaptic activity in the absence of voltage fluctuations, neurones were voltage-clamped at −65 mV, allowing for examination of spontaneous inward postsynaptic currents (Fig. 6). As previously described (Smith et al. 1998; Kawai & Senba, 2000; Doyle & Andresen, 2001; Glatzer et al. 2003; Jin et al. 2004; Glatzer & Smith, 2005), these inward postsynaptic currents were distinguished from small outward currents by their polarity, were blocked by CNQX and AP-5, reversed polarity near 0 mV, and thus were considered to be glutamatergic spontaneous excitatory postsynaptic currents (sEPSCs). The frequency of sEPSCs under normal conditions was 5.0 ± 1.1Hz. With a similar time course to the leptin-induced membrane hyperpolarization (i.e. < 5 min after application), leptin (100 nm) decreased the frequency of sEPSCs in 7 of 10 NTS neurones in normal rats from 4.9 ± 0.9 Hz in normal ACSF to 3.1 ± 0.7 Hz in leptin (37.3% decrease from control; P < 0.05; paired t test; n = 7; Fig. 6). A decrease in sEPSC amplitude was observed in 3 of 10 NTS neurones from −23.6 ± 1.9 pA in normal ACSF to −18.5 ± 1.5 pA in leptin (21.6% decrease from control; n = 3), but the overall amplitude was unaffected (−28.4 ± 3.3 pA in control ACSF to −27.1 ± 4.2 pA in leptin; n = 10; NS, paired t test). Effects on synaptic activity were reversible within a recording for five of these neurones such that the frequency after washing to control ACSF was 4.7 ± 1.5 Hz (n = 5). In order to assess effects on isolated EPSCs, the effect of leptin was examined in the presence of picrotoxin or bicuculline, which blocked IPSCs, in an additional six neurones. A significant decrease in sEPSC frequency was observed in four cells, from 4.6 ± 1.2 Hz in ACSF containing GABAA receptor antagonists to 2.6 ± 1.6 Hz in leptin (42.0% decrease from control; P < 0.05; Kolmogorov-Smirnov test). This suggested that a leptin-induced suppression of NTS excitatory synaptic activity occurred independently of any GABAA-receptor-mediated influence on overall spontaneous excitatory synaptic transmission, which can be significant in the NTS (Smith et al. 1998).
Figure 6. Leptin suppressed spontaneous EPSC (sEPSC) frequency.
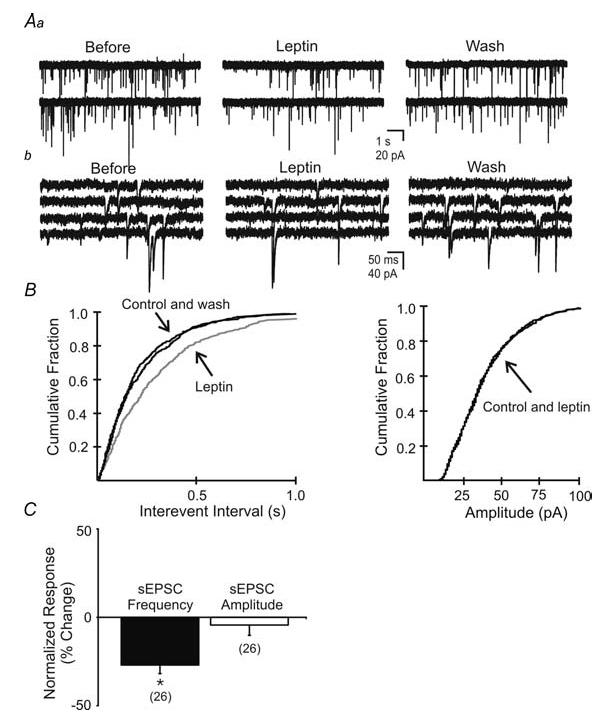
Aa, spontaneous EPSCs recorded in unidentified NTS neurone before, during, and after washout of leptin (100 nm; Vm = −65 mV). b, expanded continuous portions of corresponding traces in A. B, cumulative fraction plot shows a significant decrease in the frequency but not amplitude of spontaneous EPSCs (P < 0.05). C, plots indicating leptin-induced changes in sEPSC frequency and amplitude observed in the neurone population (n = 26). Asterisks indicate significant changes (P < 0.05).
A significant decrease in sEPSC frequency was also observed in 3 of 5 PRV-152 EGFP-labelled cells from 2.4 ± 0.7 Hz in control ACSF to 1.6 ± 0.5 Hz in leptin (35.2% decrease from control; P < 0.05; n = 3), indicating that a suppression of excitatory synaptic activity occurred in gastric-related neurones. A leptin-induced suppression of sEPSC frequency was observed in cells from lean Zucker rats (33.2% decrease from control; 2.5 ± 1.2 Hz in normal ACSF to 1.7 ± 0.8 Hz in leptin; P < 0.05; 4 of 5 cells), but not in cells from obese Zucker rats (1.6 ± 0.6 Hz in normal ACSF to 1.7 ± 0.5 Hz in leptin; NS; n = 3). Cumulatively, the population of neurones recorded in the rat NTS, including responsive and non-responsive cells from both unlabelled neurones and PRV-152 EGFP-labelled neurones in Sprague-Dawley and Zucker lean rats, exhibited an overall 22.4% decrease in sEPSC frequency from control (4.9 ± 0.8 Hz in control ACSF to 3.8 ± 0.7 Hz in 100 nm leptin; n = 26; P < 0.05, paired t test), with no change in sEPSC amplitude (2.2% decrease from control; 27.2 ± 1.9 Hz in control ACSF to 26.6 ± 2.3 Hz in leptin; n = 26; NS; paired t test; Fig. 6).
Effects on miniature EPSCs
To investigate the possible location of receptors responsible for the decrease in sEPSC frequency, we analysed the effect of leptin on miniature EPSCs (mEPSCs) in unidentified NTS neurones. In the presence of TTX (2 μm), which blocked action potential-dependent synaptic activity, mEPSC frequency was 4.6 ± 1.3 Hz (n = 6; Fig. 7). In 4 of 6 neurones, application of leptin (100 nm) significantly decreased the frequency of mEPSCs (P < 0.05; Kolmogorov-Smirnov test; Fig. 7). In these neurones, the frequency was reduced from 5.2 ± 1.9 to 3.6 ± 1.3 Hz (25.5% decrease from control; P < 0.05; n = 4). No change in frequency was observed in the remaining two cells. There was no accompanying change in mEPSC amplitude (23.0 ± 2.7 pA in normal ACSF to 23.2 ± 2.7 pA in 100 nm leptin; NS, t test; n = 6; Fig. 7). This implied that leptin may act at receptors on terminals presynaptic to the recorded neurone. Leptin effects on the frequency of mEPSCs were significantly different from the leptin suppression of sEPSC frequency (25.5% decrease from control in TTX versus 37.3% decrease from control in normal ACSF; P < 0.05; unpaired t test), suggesting leptin may act at both terminal and soma/dendritic loci on afferent neurones.
Figure 7. Leptin suppressed miniature EPSC (mEPSC) frequency.
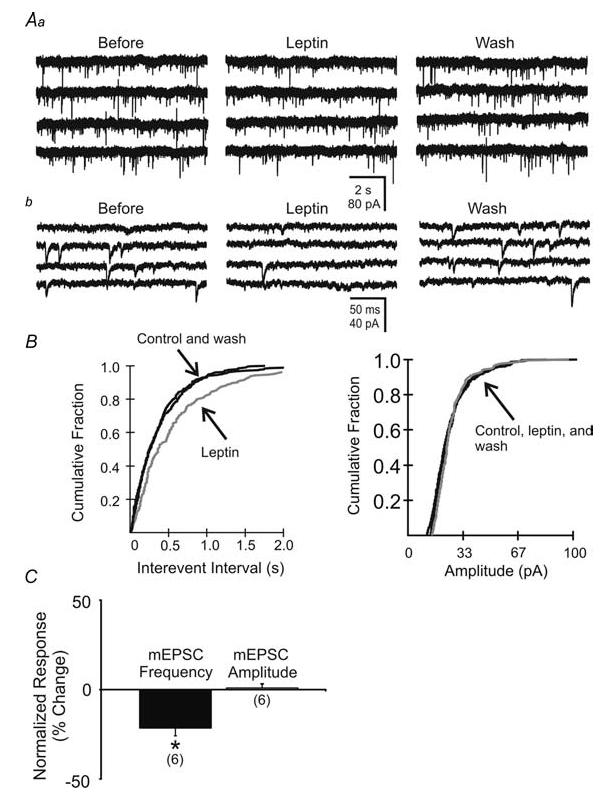
Aa, miniature EPSCs recorded within unidentified NTS neurone before, during and after washout of leptin (100 nm; Vm = −65 mV). b, expanded portions of corresponding traces in A. B, cumulative fraction plot shows a significant decrease in the frequency and no change in amplitude of mEPSCs. C, plots indicating leptin-induced changes in mEPSC frequency and amplitude observed in 6 neurones. Asterisks indicate significant changes (P < 0.05) in frequency, but not amplitude.
Mechanism of effects on synaptic transmission
Neurones in the NTS were exposed to wortmannin to determine if leptin suppressed excitatory synaptic input via a mechanism similar to its effects on membrane potential. In the presence of wortmannin (100–200 μm), leptin (100 nm) failed to influence the frequency of sEPSCs in any of 10 cells. The frequency of sEPSCs was 5.9 ± 1.3 Hz in ACSF containing wortmannin and 6.0 ± 1.2 Hz in ACSF containing both leptin and wortmannin (n = 10; NS; paired t test).
To determine if the suppression of EPSCs reflected a decrease in overall fast synaptic activity, we examined leptin effects on the frequency and amplitude of sIPSCs in unidentified NTS neurones. Since leptin decreased sEPSC frequency in most cases, CNQX and AP5 were used to isolate effects on GABAergic input from possible effects on glutamatergic networks. Bath application of leptin (100 nm) failed to influence the frequency of sIPSCs in NTS neurones (1.4 ± 0.4 Hz in normal ACSF to 1.3 ± 0.2 Hz in leptin; NS; n = 9; Fig. 8). Leptin also failed to affect the amplitude of sIPSCs (4.4% decrease from control; NS, paired t test; n = 9). These data indicated that leptin had little effect on inhibitory synaptic input to NTS neurones.
Figure 8. Leptin had no effect on spontaneous IPSC frequency (sIPSC).
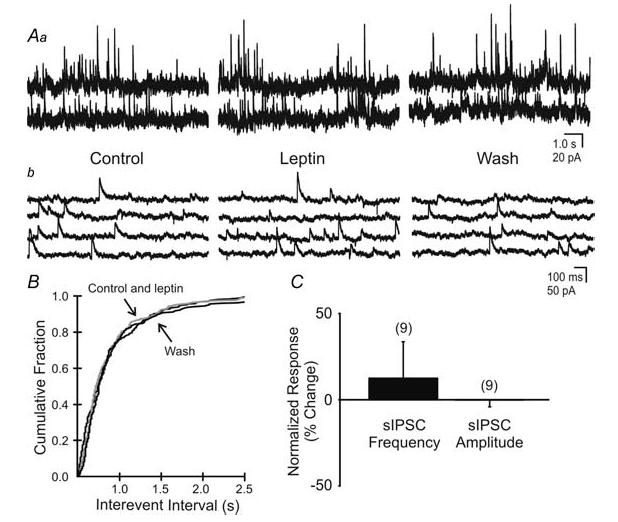
Aa, spontaneous IPSCs observed in this unidentified neurone before, during and after superfusion of leptin (100 nm; Vm = −15 mV). b, expanded portions of corresponding traces in A. B, cumulative fraction plot shows no significant change in sIPSC frequency in response to leptin (P > 0.05). C, percentage change of sIPSC frequency and amplitude in response to leptin application (P > 0.05).
Leptin effects on membrane potential of murine GABAergic NTS neurones
The findings above suggested a relatively selective inhibition of glutamatergic, but not GABAergic synaptic activity within the NTS by leptin. Since a substantial component of the GABAergic input to NTS neurones is likely to be of local origin (Smith et al. 1998; Glatzer & Smith, 2005), we hypothesized that leptin would not alter the membrane potential of GABAergic neurones in the NTS. Transgenic GIN mice were used to test the membrane effects of leptin on GAD67/EGFP-expressing and non-GAD67/EGFP-expressing neurones within the NTS in current-clamp mode. Bath application of leptin (100 nm) resulted in no change of membrane potential in 6 of 7 GAD67/EGFP-expressing neurones in GIN mice (the remaining neurone hyperpolarized by 3 mV). Conversely, leptin caused a rapid hyperpolarization of −7.6 ± 0.9 mV in 4 of 6 unlabelled neurones recorded in slices from the same GIN mice, implicating a leptin-induced hyperpolarization of non-GAD67/EGFP-expressing neurones in the NTS (Fig. 2). The hyperpolarization in unlabelled neurones was accompanied by a 31.7% decrease in whole-cell input resistance, such that the input resistance was reduced from 1249.8 ± 382.1 MΩ in control ACSF to 853.9 ± 348.6 MΩ in leptin (n = 4). No effect was detected on sEPSP frequency in labelled or unlabelled neurones. These data indicated that, as in rat, leptin hyperpolarized unlabelled NTS neurones in mice. However, leptin had no effect on the membrane potential of GAD67/EGFP-expressing, GABAergic neurones.
Discussion
Leptin is secreted from adipose cells and has been shown to suppress feeding over several hours when injected centrally or peripherally (Yuan et al. 1999; Grill et al. 2002). The predominant effects of leptin on NTS neurones were a membrane hyperpolarization and/or inhibition of excitatory synaptic input. Leptin effects occurred with an onset < 5 min, similar to effects on membrane potential observed in hypothalamic neurones (Spanswick et al. 1997; Cowley et al. 2001), but much shorter than many analyses of leptin effects on feeding. Effects were evident in neurones that responded to stimulation of primary afferents as well as those related to premotor control of the stomach, but they were not limited to these identified sets of cells. Effects were not observed in a subset of putative inhibitory neurones, and inhibitory synaptic activity was not affected, suggesting relatively selective actions of leptin on excitatory neurones and circuits involved in rapid modulation of autonomic behaviours.
Membrane effects
Excluding GABAergic neurones and neurones from Zucker obese rats, approximately 60% of all NTS neurones were hyperpolarized in response to leptin superfusion. The hyperpolarization was observed in the presence of TTX, and thus occurred independent of action potentials in afferent neurones, implying a direct effect on the soma/dendritic membrane. The hyperpolarization was accompanied by a decrease in input resistance, which revealed an increased ionic conductance that reversed near the K+ equilibrium potential and was absent when intracellular Cs+ was present. These results are consistent with the hypothesis that leptin hyperpolarized NTS neurones by enhancing a resting K+ conductance. For those cells identified as gastric-related, putative premotor NTS neurones by virtue of their being transsynaptically labelled after PRV-152 inoculation of vagal terminal fields in the stomach (Glatzer et al. 2003; Glatzer & Smith, 2005), the percentage of neurones hyperpolarized by leptin was slightly higher (86%) than for the unidentified pool of cells (58%). Although this was not a significant difference, the result provides positive evidence supporting the hypothesis that leptin alters membrane properties of gastric-related neurones. It is possible that many unidenfied neurones were actually gastric-related and were therefore affected similarly to the identified cells. Alternatively, neurones controlling output to other viscera or regulating viscerosensory information from a variety of systems in the thorax and abdomen might also be modulated by the peptide. This raises the possibility that leptin's influence on parasympathetic functions may not be limited to feeding mechanisms, but might influence autonomic functions in general (Elias et al. 2000). Leptin effects were also examined in neurones from a transgenic mouse which express EGFP in a subset of GAD67-expressing cells (Oliva et al. 2000). These cells are presumed to be GABAergic. Although their distribution resembles that of GAD67 or GABA immunolabelled neurones in the NTS (Izzo et al. 1992), GAD67/EGFP-expressing neurones may not represent the entire GABA neurone population in the NTS. Even so, GAD67/EGFP-expressing murine neurones were largely unresponsive to leptin, whereas unlabelled neurones in mice responded to leptin in a similar manner to those in rats. Together with the relative absence of effect on sIPSCs, these data suggest an inhibition of gastric-related and non-GABAergic NTS neurones, which may contribute to local circuit control within the NTS or vagal complex. As such, leptin would be expected to suppress viscerosensory and other information related to visceral autonomic function, including gastric regulation, via actions at the level of the NTS.
Leptin has been shown to induce a membrane hyperpolarization by activating BK channels in the hippocampus (Shanley et al. 2002a, b) or ATP-sensitive K+ channels in cell lines (Harvey et al. 1997, 2000a; Levin, 2001) and in hypothalamic neurones (Spanswick et al. 1997, 2000; Mirshamsi et al. 2004), both via a PI3 kinase-dependent mechanism. Application of tolbutamide, a sulphonylurea drug that blocks ATP-sensitive K+ channels, depolarized NTS neurones, suggesting the presence of a ‘leak’ ATP-sensitive K+ channel in these cells. Pre-application of tolbutamide prevented the leptin-induced hyperpolarization, indicating that leptin enhanced conductance through this channel. Application of wortmannin, a selective PI3 kinase inhibitor, also depolarized NTS neurons and occluded the tolbutamide-induced depolarization, implicating PI3 kinase in the constitutive activation of a ‘leak’ ATP-sensitive K+ channel in these cells, consistent with previous observations (Harvey et al. 2000a, b; Mirshamsi et al. 2004). Pre-application of wortmannin prevented the leptin-induced hyperpolarization, implicating PI3 kinase in the intracellular cascade mediating the response. This hyperpolarization was not observed in obese Zucker rats (fa/fa), which have a single point mutation in the long form of the leptin receptor (Ob-Rb), resulting in decreased leptin receptor expression, variable leptin binding affinity, and reduced activation of intracellular signalling cascades subsequent to leptin binding (Chua et al. 1996a, b; Rosenblum et al. 1996; White et al. 1997; Yamashita et al. 1997; Da Silva et al. 1998). Leptin therefore appears to hyperpolarize NTS neurones subsequent to binding the type I cytokine receptor, Ob-Rb, which then activates an ATP-sensitive K+ channel via a PI3 kinase mechanism.
Synaptic effects
In addition to its release by vagal afferents, glutamate is released subsequent to activation of glutamate neurones intrinsic to the NTS (Smith et al. 1998; Glatzer & Smith, 2005), and probably also arising from elsewhere in the brain. Bath application of leptin suppressed the frequency of spontaneous glutamatergic EPSCs in the NTS. A suppression of sEPSC amplitude was also observed in some neurones, which could indicate a pre- or postsynaptic site of action. Application of wortmannin prevented the leptin-induced suppression of sEPSCs, implicating PI3 kinase in mediating the response. We would hypothesize that the same mechanism responsible for the hyperpolarization would contribute to the synaptic suppression, but this has yet to be substantiated. Leptin suppressed the frequency but not amplitude of mEPSCs, implying a presynaptic action on terminals contacting NTS neurones. Leptin suppressed the amplitude of constant-latency EPSCs evoked after stimulation of TS, indicating that it suppressed glutamate-mediated primary viscerosensory input, which includes gastric viscerosensory input. There was a consistent increase in the PPR, which also argues for a presynaptic site of action at the level of primary vagal afferent terminals in the NTS. The difference in degree of suppression between sEPSC and mEPSC frequency suggests leptin acts both on soma/dendrites of intact glutamatergic neurones, consistent with the observed hyperpolarization of NTS neurones, as well as on glutamatergic terminals to diminish synaptic excitation. Previous studies have implicated a modulatory role of leptin in the PVN (Powis et al. 1998), which might also contribute glutamatergic input to the NTS. The specific modulation of neuronal terminals and cell bodies within the NTS provides an additional level of leptin action on this autonomic neural circuitry. Notably, sIPSCs were mainly unaffected by leptin. The absence of membrane effects on GAD67/EGFP-expressing NTS neurones further suggests that leptin does not significantly affect local GABAergic synaptic transmission. Rather, leptin relatively selectively inhibited glutamatergic synaptic connections in the NTS. Preliminary evidence also suggests that leptin suppresses excitatory, but not inhibitory, input to motor neurones in the DMV, further implying a preferential effect of the peptide on glutamatergic circuits in the vagal complex (Williams & Smith, 2005).
Relationship to feeding
Physiologically, it is difficult to understand the cumulative effects of leptin in the whole animal due to the lack of cellular data, and rapid effects of the peptide on the scale of those identified here have never been studied in vivo. Classically, increases in feeding are accompanied by increases in gastric motility, while the cessation of feeding is preceded by the expansion of the stomach and decreased gastric motility (Abrahamsson & Jansson, 1969; Rogers & Hermann, 1987). Moreover, initial satiety signals triggered by gastric distension are thought to involve increased glutamate-mediated viscerosensory afferent activity to the NTS, presumably activating second-order neurones that alter motor output to the gut. However, correlates of cellular activity are not always predictive of visceral system behaviour, partly because of the different pathways involved in gastric control at the level of the stomach and other viscera (e.g. the inhibitory non-adrenergic non-cholinergic (NANC) and excitatory cholinergic pathways). Further, DVC activity regulates several organs, and thus any change in activity of the NTS does not necessarily implicate a specific change in gastric activity. However, our data are consistent with the hypothesis that leptin directly modulates neurones known to control gastric function, regardless of any possible associations with other visceral systems.
The NTS is made of a heterogeneous population of neurones with regard to morphology, electrical properties, and phenotype. Neuronal populations of the hypothalamus have been shown to have phenotype-specific responses to leptin (Cowley et al. 2001), with NPY neurones being inhibited and POMC neurons being excited. Leptin inhibits the majority of neurones in the NTS – both directly via a membrane hyperpolarization and/or indirectly by suppressing excitatory synaptic input. Inhibition of putative glutamatergic neurones that in turn project to the DMV would be expected to decrease activity of DMV neurones. Depending on the pathway (i.e. NANC versus non-NANC) this may increase or decrease gastric motility, with a decrease in gastric motility being the classical response. Leptin influences in the dorsal brainstem have previously been associated with long-term suppression of food intake and weight gain, measured hours to days after leptin treatment (Smedh et al. 1998; Grill et al. 2002). However, the rapid (< 5 min) effects of leptin observed here are most likely not directly associated with longer metabolic changes. Rather, they probably report a faster feed-back response to changing leptin levels.
There has been long-standing interest in understanding glucose sensitivity in neurones (i.e. ‘the glucostatic hypothesis’), including neurones that are receptive to adiposity signals, such as leptin and insulin (Mayer, 1953; Seeley & Woods, 2003; Elmquist et al. 2005). A leptin-induced activation of an ATP-sensitive K+ channel within the NTS is analogous to effects of lowering glucose in the NTS (Ferreira et al. 2001). The apparent utilization of a common ionic mechanism for glucose- and leptin-sensing NTS neurones may be related to proposed interactions between leptin and other regulators of energy, including glucose metabolism (Schwartz & Porte, 2005).
Due to leptin's effects in the NTS – and in particular gastric-related putative premotor neurones – the rapid responses to leptin can be associated with neurones identified to be directly involved in the process of feeding and ingestion. Direct association with gut control has not been made in studies of other neurones, including those in the hypothalamus. It is also possible that some of the unidentified NTS neurones affected by leptin represent a population of gut-related neurones that were simply not labelled by the virus. Additionally, effects on neurones related to cardiovascular, hepatic, or pancreatic regulation are also possible and may be more closely related to autonomic effects of leptin on blood pressure, glucose production, and insulin sensitivity (Schwartz & Porte, 2005) instead of or in addition to those on feeding behaviours.
Excitation versus inhibition
c-fos is an immediate early gene, which has been associated with increased cellular excitability due to its presence in areas known to have increases in intracellular calcium or cAMP. Central or peripheral administration of leptin results in a sparse distribution of c-fos within the NTS, implicating a leptin-induced excitation in a relatively small number of cells (Elmquist et al. 1998; Elias et al. 2000). However, evaluating message for c-fos is an indirect measure of cellular activity and is a method in which cellular inhibition (e.g. hyperpolarization, diminished glutamatergic input) cannot be identified. Also, leptin has been shown to increase excitability of NTS neurones subsequent to a gastric load, which increased vagal afferent input (Schwartz & Moran, 2002). However, those responses were found in a subset of NTS neurones two or more hours after third ventricle administration, suggesting the long-term effects of a leptin bolus in response to a gastric load is the eventual activation of some neurones in the NTS. Such responses are not likely to be due to direct actions of leptin, but probably instead reflect metabolic changes induced considerably after the initial response to the peptide. Only a small proportion of neurones (∼13%) responded with a depolarization, consistent with the sparse c-fos distribution or unit activity in the NTS subsequent to central or peripheral administration of leptin. However, the major rapid cellular effects of leptin in the NTS are a membrane hyperpolarization and a decrease in excitatory synaptic activity in the NTS, both of which would result in a net inhibition of cellular activity. It is likely that the rapid effects seen here and the slow effects seen previously represent two distinct phases of leptin activity within the brainstem. Whether they are interrelated and/or reflect real cellular correlates of feeding and ingestion remains in question. The reported leptin-induced long-term effect is a decrease in food intake. It is possible that the rapid effects of leptin act to initiate suppression of gastric activity or otherwise alter ingestive behaviours during a meal. The apparent immediate and delayed effects implicate leptin in regulating multiple phases of digestion. The rapid effects may also reflect a function for leptin in decreasing overall parasympathetic tone.
Hypothalamus or brainstem?
The hypothalamus is regarded as a key site for study of homeostatic modalities. Since leptin's discovery, there has been a heavy emphasis on understanding leptin's effects on hypothalamic activity, whereas relatively few studies have examined effects on other central autonomic regions like the DVC (Grill et al. 2002; Schwartz & Moran, 2002). This may have been due to the initial description of message for the leptin receptor as ‘low density and inconsistent’ within the NTS (Elmquist et al. 1998). Recent use of fluorescence in situ hybridization (FISH) for the leptin receptor within the NTS described approximately 30% of NTS neurones as expressing message for the leptin receptor (Grill et al. 2002). We attributed responses to postsynaptic receptor location in approximately 58% of cells and to presynaptic location in a similar proportion (66%), consistent with the widespread distribution of Ob-Rb immunoreactivity. Given that leptin is peripherally produced, that message and protein for the leptin receptor have been described within the NTS, and that fenestrated capillaries are abundant in the AP and NTS (Gross et al. 1990; Gross et al. 1991), the NTS is a good candidate for rapid leptin-induced responses. Also, fourth ventricle administration or microinjection of leptin into the NTS alone is sufficient to suppress food intake and weight gain (Grill et al. 2002), suggesting a role for leptin in regulating ingestion by acting at the level of the DVC, possibly independent of any direct effects in the hypothalamus. Most studies have focused on long-term metabolic changes, with only a few having studied immediate membrane effects of the peptide (Harvey et al. 1997; Spanswick et al. 1997; Harvey et al. 2000a; Cowley et al. 2001). The data presented here support a role for leptin in the rapid suppression of excitatory synaptic input and direct cellular inhibition of neurones in the NTS, which are critical modulators of gastric and other visceral functions. Thus, while the hypothalamus is a critical regulator of feeding homeostasis, present data implicate the DVC as a potentially important substrate for the cellular actions of leptin in regulating gastric and other autonomic functions.
Acknowledgments
We thank Dr L. Enquist for supplying the PRV-152, and Dr T. Stuart for expanding the viral stock, and Dr J. Porter for the Zucker rats. Thanks also to Dr J. Tasker and M.D. Bhaskaran for comments on the article. Deepest thanks to Dr W.E. Armstrong for graciously lending his space, time, and effort during a critical and extremely difficult period for our lab and these studies. This work was supported by NIH (DK56132), NSF (IBN-0080322), and the Louisiana Board of Regents.
References
- Abrahamsson H, Jansson G. Elicitation of reflex vagal relaxation of the stomach from pharynx and esophagus in the cat. Acta Physiol Scand. 1969;77:172–178. doi: 10.1111/j.1748-1716.1969.tb04561.x. [DOI] [PubMed] [Google Scholar]
- Bado A, Levasseur S, Attoub S, Kermorgant S, Laigneau JP, Bortoluzzi MN, Moizo L, Lehy T, Guerre-Millo M, Le Marchand-Brustel Y, Lewin MJ. The stomach is a source of leptin. Nature. 1998;394:790–793. doi: 10.1038/29547. [DOI] [PubMed] [Google Scholar]
- Card JP, Rinaman L, Lynn RB, Lee BH, Meade RP, Miselis RR, Enquist LW. Pseudorabies virus infection of the rat central nervous system: ultrastructural characterization of viral replication, transport, and pathogenesis. J Neurosci. 1993;13:2515–2539. doi: 10.1523/JNEUROSCI.13-06-02515.1993. [DOI] [PMC free article] [PubMed] [Google Scholar]
- Chua SC, Jr, Chung WK, Wu-Peng XS, Zhang Y, Liu SM, Tartaglia L, Leibel RL. Phenotypes of mouse diabetes and rat fatty due to mutations in the OB (leptin) receptor. Science. 1996a;271:994–996. doi: 10.1126/science.271.5251.994. [DOI] [PubMed] [Google Scholar]
- Chua SC, Jr, White DW, Wu-Peng XS, Liu SM, Okada N, Kershaw EE, Chung WK, Power-Kehoe L, Chua M, Tartaglia LA, Leibel RL. Phenotype of fatty due to Gln269Pro mutation in the leptin receptor (Lepr) Diabetes. 1996b;45:1141–1143. doi: 10.2337/diab.45.8.1141. [DOI] [PubMed] [Google Scholar]
- Cowley MA, Smart JL, Rubinstein M, Cerdan MG, Diano S, Horvath TL, Cone RD, Low MJ. Leptin activates anorexigenic POMC neurons through a neural network in the arcuate nucleus. Nature. 2001;411:480–484. doi: 10.1038/35078085. [DOI] [PubMed] [Google Scholar]
- Da Silva BA, Bjorbaek C, Uotani S, Flier JS. Functional properties of leptin receptor isoforms containing the gln→pro extracellular domain mutation of the fatty rat. Endocrinology. 1998;139:3681–3690. doi: 10.1210/endo.139.9.6168. [DOI] [PubMed] [Google Scholar]
- Davis SF, Derbenev AV, Williams KW, Glatzer NR, Smith BN. Excitatory and inhibitory local circuit input to the rat dorsal motor nucleus of the vagus originating from the nucleus tractus solitarius. Brain Res. 2004;1017:208–217. doi: 10.1016/j.brainres.2004.05.049. [DOI] [PMC free article] [PubMed] [Google Scholar]
- Davis SF, Williams KW, Xu W, Glatzer NR, Smith BN. Selective enhancement of synaptic inhibition by hypocretin (orexin) in rat vagal motor neurons: implications for autonomic regulation. J Neurosci. 2003;23:3844–3854. doi: 10.1523/JNEUROSCI.23-09-03844.2003. [DOI] [PMC free article] [PubMed] [Google Scholar]
- Derbenev AV, Stuart TC, Smith BN. Cannabinoids suppress synaptic input to neurones of the rat dorsal motor nucleus of the vagus nerve. J Physiol. 2004;559:923–938. doi: 10.1113/jphysiol.2004.067470. [DOI] [PMC free article] [PubMed] [Google Scholar]
- Doyle MW, Andresen MC. Reliability of monosynaptic sensory transmission in brain stem neurons in vitro. J Neurophysiol. 2001;85:2213–2223. doi: 10.1152/jn.2001.85.5.2213. [DOI] [PubMed] [Google Scholar]
- Elias CF, Kelly JF, Lee CE, Ahima RS, Drucker DJ, Saper CB, Elmquist JK. Chemical characterization of leptin-activated neurons in the rat brain. J Comp Neurol. 2000;423:261–281. [PubMed] [Google Scholar]
- Elmquist JK, Ahima RS, Maratos-Flier E, Flier JS, Saper CB. Leptin activates neurons in ventrobasal hypothalamus and brainstem. Endocrinology. 1997;138:839–842. doi: 10.1210/endo.138.2.5033. [DOI] [PubMed] [Google Scholar]
- Elmquist JK, Bjorbaek C, Ahima RS, Flier JS, Saper CB. Distributions of leptin receptor mRNA isoforms in the rat brain. J Comp Neurol. 1998;395:535–547. [PubMed] [Google Scholar]
- Elmquist JK, Coppari R, Balthasar N, Ichinose M, Lowell BB. Identifying hypothalamic pathways controlling food intake, body weight, and glucose homeostasis. J Comp Neurol. 2005;493:63–71. doi: 10.1002/cne.20786. [DOI] [PubMed] [Google Scholar]
- Ferreira M, Jr, Browning KN, Sahibzada N, Verbalis JG, Gillis RA, Travagli RA. Glucose effects on gastric motility and tone evoked from the rat dorsal vagal complex. J Physiol. 2001;536:141–152. doi: 10.1111/j.1469-7793.2001.t01-1-00141.x. [DOI] [PMC free article] [PubMed] [Google Scholar]
- Glatzer NR, Hasney CP, Bhaskaran MD, Smith BN. Synaptic and morphologic properties in vitro of premotor rat nucleus tractus solitarius neurons labeled transneuronally from the stomach. J Comp Neurol. 2003;464:525–539. doi: 10.1002/cne.10831. [DOI] [PubMed] [Google Scholar]
- Glatzer NR, Smith BN. Modulation of synaptic transmission in the rat nucleus of the solitary tract by endomorphin-1. J Neurophysiol. 2005;93:2530–2540. doi: 10.1152/jn.00429.2004. [DOI] [PubMed] [Google Scholar]
- Grill HJ, Schwartz MW, Kaplan JM, Foxhall JS, Breininger J, Baskin DG. Evidence that the caudal brainstem is a target for the inhibitory effect of leptin on food intake. Endocrinology. 2002;143:239–246. doi: 10.1210/endo.143.1.8589. [DOI] [PubMed] [Google Scholar]
- Gross PM, Wall KM, Pang JJ, Shaver SW, Wainman DS. Microvascular specializations promoting rapid interstitial solute dispersion in nucleus tractus solitarius. Am J Physiol. 1990;259:R1131–R1138. doi: 10.1152/ajpregu.1990.259.6.R1131. [DOI] [PubMed] [Google Scholar]
- Gross PM, Wall KM, Wainman DS, Shaver SW. Subregional topography of capillaries in the dorsal vagal complex of rats. II. Physiological properties. J Comp Neurol. 1991;306:83–94. doi: 10.1002/cne.903060107. [DOI] [PubMed] [Google Scholar]
- Halaas JL, Gajiwala KS, Maffei M, Cohen SL, Chait BT, Rabinowitz D, Lallone RL, Burley SK, Friedman JM. Weight-reducing effects of the plasma protein encoded by the obese gene. Science. 1995;269:543–546. doi: 10.1126/science.7624777. [DOI] [PubMed] [Google Scholar]
- Harvey J, Hardy SC, Irving AJ, Ashford ML. Leptin activation of ATP-sensitive K+ (KATP) channels in rat CRI-G1 insulinoma cells involves disruption of the actin cytoskeleton. J Physiol. 2000a;527:95–107. doi: 10.1111/j.1469-7793.2000.00095.x. [DOI] [PMC free article] [PubMed] [Google Scholar]
- Harvey J, McKay NG, Walker KS, Van Der Kaay J, Downes CP, Ashford ML. Essential role of phosphoinositide 3-kinase in leptin-induced KATP channel activation in the rat CRI-G1 insulinoma cell line. J Biol Chem. 2000b;275:4660–4669. doi: 10.1074/jbc.275.7.4660. [DOI] [PubMed] [Google Scholar]
- Harvey J, McKenna F, Herson PS, Spanswick D, Ashford ML. Leptin activates ATP-sensitive potassium channels in the rat insulin-secreting cell line, CRI-G1. J Physiol. 1997;504:527–535. doi: 10.1111/j.1469-7793.1997.527bd.x. [DOI] [PMC free article] [PubMed] [Google Scholar]
- Irnaten M, Neff RA, Wang J, Loewy AD, Mettenleiter TC, Mendelowitz D. Activity of cardiorespiratory networks revealed by transsynaptic virus expressing GFP. J Neurophysiol. 2001;85:435–438. doi: 10.1152/jn.2001.85.1.435. [DOI] [PubMed] [Google Scholar]
- Izzo PN, Sykes RM, Spyer KM. γ-Aminobutyric acid immunoreactive structures in the nucleus tractus solitarius: a light and electron microscopic study. Brain Res. 1992;591:69–78. doi: 10.1016/0006-8993(92)90979-j. [DOI] [PubMed] [Google Scholar]
- Jin YH, Bailey TW, Li BY, Schild JH, Andresen MC. Purinergic and vanilloid receptor activation releases glutamate from separate cranial afferent terminals in nucleus tractus solitarius. J Neurosci. 2004;24:4709–4717. doi: 10.1523/JNEUROSCI.0753-04.2004. [DOI] [PMC free article] [PubMed] [Google Scholar]
- Kalia M, Sullivan JM. Brainstem projections of sensory and motor components of the vagus nerve in the rat. J Comp Neurol. 1982;211:248–265. doi: 10.1002/cne.902110304. [DOI] [PubMed] [Google Scholar]
- Kawai Y, Senba E. Electrophysiological and morphological characteristics of nucleus tractus solitarii neurons projecting to the ventrolateral medulla. Brain Res. 2000;877:374–378. doi: 10.1016/s0006-8993(00)02701-3. [DOI] [PubMed] [Google Scholar]
- Kolaczynski JW, Considine RV, Ohannesian J, Marco C, Opentanova I, Nyce MR, Myint M, Caro JF. Responses of leptin to short-term fasting and refeeding in humans: a link with ketogenesis but not ketones themselves. Diabetes. 1996;45:1511–1515. doi: 10.2337/diab.45.11.1511. [DOI] [PubMed] [Google Scholar]
- Levin BE. Glucosensing neurons do more than just sense glucose. Int J Obes Relat Metab Disord. 2001;25(Suppl. 5):S68–S72. doi: 10.1038/sj.ijo.0801916. [DOI] [PubMed] [Google Scholar]
- Mayer J. Glucostatic mechanism of regulation of food intake. N Engl J Med. 1953;249:13–16. doi: 10.1056/NEJM195307022490104. [DOI] [PubMed] [Google Scholar]
- Miles R. Frequency dependence of synaptic transmission in nucleus of the solitary tract in vitro. J Neurophysiol. 1986;55:1076–1090. doi: 10.1152/jn.1986.55.5.1076. [DOI] [PubMed] [Google Scholar]
- Mirshamsi S, Laidlaw HA, Ning K, Anderson E, Burgess LA, Gray A, Sutherland C, Ashford ML. Leptin and insulin stimulation of signalling pathways in arcuate nucleus neurones: PI3K dependent actin reorganization and KATP channel activation. BMC Neurosci. 2004;5:54. doi: 10.1186/1471-2202-5-54. [DOI] [PMC free article] [PubMed] [Google Scholar]
- Oliva AA, Jr, Jiang M, Lam T, Smith KL, Swann JW. Novel hippocampal interneuronal subtypes identified using transgenic mice that express green fluorescent protein in GABAergic interneurons. J Neurosci. 2000;20:3354–3368. doi: 10.1523/JNEUROSCI.20-09-03354.2000. [DOI] [PMC free article] [PubMed] [Google Scholar]
- Powis JE, Bains JS, Ferguson AV. Leptin depolarizes rat hypothalamic paraventricular nucleus neurons. Am J Physiol. 1998;274:R1468–R1472. doi: 10.1152/ajpregu.1998.274.5.R1468. [DOI] [PubMed] [Google Scholar]
- Rinaman L, Card JP, Enquist LW. Spatiotemporal responses of astrocytes, ramified microglia, and brain macrophages to central neuronal infection with pseudorabies virus. J Neurosci. 1993;13:685–702. doi: 10.1523/JNEUROSCI.13-02-00685.1993. [DOI] [PMC free article] [PubMed] [Google Scholar]
- Rogers RC, Hermann GE. Oxytocin, oxytocin antagonist, TRH, and hypothalamic paraventricular nucleus stimulation effects on gastric motility. Peptides. 1987;8:505–513. doi: 10.1016/0196-9781(87)90017-9. [DOI] [PubMed] [Google Scholar]
- Rosenblum CI, Tota M, Cully D, Smith T, Collum R, Qureshi S, Hess JF, Phillips MS, Hey PJ, Vongs A, Fong TM, Xu L, Chen HY, Smith RG, Schindler C, Van Der Ploeg LH. Functional STAT 1 and 3 signaling by the leptin receptor (OB-R); reduced expression of the rat fatty leptin receptor in transfected cells. Endocrinology. 1996;137:5178–5181. doi: 10.1210/endo.137.11.8895396. [DOI] [PubMed] [Google Scholar]
- Saladin R, De Vos P, Guerre-Millo M, Leturque A, Girard J, Staels B, Auwerx J. Transient increase in obese gene expression after food intake or insulin administration. Nature. 1995;377:527–529. doi: 10.1038/377527a0. [DOI] [PubMed] [Google Scholar]
- Sawchenko PE. Central connections of the sensory and motor nuclei of the vagus nerve. J Auton Nerv Syst. 1983;9:13–26. doi: 10.1016/0165-1838(83)90129-7. [DOI] [PubMed] [Google Scholar]
- Schwartz GJ, Moran TH. Leptin and neuropeptide Y have opposing modulatory effects on nucleus of the solitary tract neurophysiological responses to gastric loads: implications for the control of food intake. Endocrinology. 2002;143:3779–3784. doi: 10.1210/en.2002-220352. [DOI] [PubMed] [Google Scholar]
- Schwartz MW, Porte D., Jr Diabetes, obesity, and the brain. Science. 2005;307:375–379. doi: 10.1126/science.1104344. [DOI] [PubMed] [Google Scholar]
- Seeley RJ, Van Dijk G, Campfield LA, Smith FJ, Burn P, Nelligan JA, Bell SM, Baskin DG, Woods SC, Schwartz MW. Intraventricular leptin reduces food intake and body weight of lean rats but not obese Zucker rats. Horm Metab Res. 1996;28:664–668. doi: 10.1055/s-2007-979874. [DOI] [PubMed] [Google Scholar]
- Seeley RJ, Woods SC. Monitoring of stored and available fuel by the CNS: implications for obesity. Nat Rev Neurosci. 2003;4:901–909. doi: 10.1038/nrn1245. [DOI] [PubMed] [Google Scholar]
- Shanley LJ, Irving AJ, Rae MG, Ashford ML, Harvey J. Leptin inhibits rat hippocampal neurons via activation of large conductance calcium-activated K+ channels. Nat Neurosci. 2002a;5:299–300. doi: 10.1038/nn824. [DOI] [PubMed] [Google Scholar]
- Shanley LJ, O'Malley D, Irving AJ, Ashford ML, Harvey J. Leptin inhibits epileptiform-like activity in rat hippocampal neurones via PI 3-kinase-driven activation of BK channels. J Physiol. 2002b;545:933–944. doi: 10.1113/jphysiol.2002.029488. [DOI] [PMC free article] [PubMed] [Google Scholar]
- Shioda S, Funahashi H, Nakajo S, Yada T, Maruta O, Nakai Y. Immunohistochemical localization of leptin receptor in the rat brain. Neurosci Lett. 1998;243:41–44. doi: 10.1016/s0304-3940(98)00082-2. [DOI] [PubMed] [Google Scholar]
- Smedh U, Hakansson ML, Meister B, Uvnas-Moberg K. Leptin injected into the fourth ventricle inhibits gastric emptying. Neuroreport. 1998;9:297–301. doi: 10.1097/00001756-199801260-00022. [DOI] [PubMed] [Google Scholar]
- Smith BN, Banfield BW, Smeraski CA, Wilcox CL, Dudek FE, Enquist LW, Pickard GE. Pseudorabies virus expressing enhanced green fluorescent protein: a tool for in vitro electrophysiological analysis of transsynaptically labeled neurons in identified central nervous system circuits. Proc Natl Acad Sci U S A. 2000;97:9264–9269. doi: 10.1073/pnas.97.16.9264. [DOI] [PMC free article] [PubMed] [Google Scholar]
- Smith BN, Davis SF, Van Den Pol AN, Xu W. Selective enhancement of excitatory synaptic activity in the rat nucleus tractus solitarius by hypocretin 2. Neuroscience. 2002;115:707–714. doi: 10.1016/s0306-4522(02)00488-8. [DOI] [PubMed] [Google Scholar]
- Smith BN, Dou P, Barber WD, Dudek FE. Vagally evoked synaptic currents in the immature rat nucleus tractus solitarii in an intact in vitro preparation. J Physiol. 1998;512:149–162. doi: 10.1111/j.1469-7793.1998.149bf.x. [DOI] [PMC free article] [PubMed] [Google Scholar]
- Spanswick D, Smith MA, Groppi VE, Logan SD, Ashford ML. Leptin inhibits hypothalamic neurons by activation of ATP-sensitive potassium channels. Nature. 1997;390:521–525. doi: 10.1038/37379. [DOI] [PubMed] [Google Scholar]
- Spanswick D, Smith MA, Mirshamsi S, Routh VH, Ashford ML. Insulin activates ATP-sensitive K+ channels in hypothalamic neurons of lean, but not obese rats. Nat Neurosci. 2000;3:757–758. doi: 10.1038/77660. [DOI] [PubMed] [Google Scholar]
- Wang J, Liu R, Hawkins M, Barzilai N, Rossetti L. A nutrient-sensing pathway regulates leptin gene expression in muscle and fat. Nature. 1998;393:684–688. doi: 10.1038/31474. [DOI] [PubMed] [Google Scholar]
- White DW, Wang DW, Chua SC, Jr, Morgenstern JP, Leibel RL, Baumann H, Tartaglia LA. Constitutive and impaired signaling of leptin receptors containing the Gln→Pro extracellular domain fatty mutation. Proc Natl Acad Sci U S A. 1997;94:10657–10662. doi: 10.1073/pnas.94.20.10657. [DOI] [PMC free article] [PubMed] [Google Scholar]
- Williams KW, Smith BN. Leptin inhibits neurons in the rat dorsal motor nucleus of the vagus nerve. Abstr Soc Neurosci. 2005;764:10. [Google Scholar]
- Woods AJ, Stock MJ. Leptin activation in hypothalamus. Nature. 1996;381:745. doi: 10.1038/381745a0. [DOI] [PubMed] [Google Scholar]
- Yamashita T, Murakami T, Iida M, Kuwajima M, Shima K. Leptin receptor of Zucker fatty rat performs reduced signal transduction. Diabetes. 1997;46:1077–1080. doi: 10.2337/diab.46.6.1077. [DOI] [PubMed] [Google Scholar]
- Yuan CS, Attele AS, Wu JA, Zhang L, Shi ZQ. Peripheral gastric leptin modulates brain stem neuronal activity in neonates. Am J Physiol. 1999;277:G626–G630. doi: 10.1152/ajpgi.1999.277.3.G626. [DOI] [PubMed] [Google Scholar]
- Zhang Y, Proenca R, Maffei M, Barone M, Leopold L, Friedman JM. Positional cloning of the mouse obese gene and its human homologue. Nature. 1994;372:425–432. doi: 10.1038/372425a0. [DOI] [PubMed] [Google Scholar]