Abstract
We have determined the functional properties of single AMPA receptor (AMPAR) and kainate receptor channels present in CA1 cells in hippocampal slices, to shed light on the relationship between single-channel behaviour and synaptic currents in these cells. To derive basic properties of AMPA and kainate channels activated by their excitatory transmitter, we examined outside-out patches exposed to glutamate. The kainate agonist SYM 2081, was used to confirm the presence of kainate receptors. Channels activated by glutamate or SYM 2081 exhibited conductance levels of 2–20 pS. Properties of single channels depended on the glutamate or AMPA concentration used. We observed a marked increase in mean channel conductance (γ) from γ = 6.9, to 11.2 pS, when glutamate was increased from 10 μm to 10 mm. The kinetic behaviour of AMPAR channels was also influenced by agonist concentration, with an increase in ‘bursty’ events at higher concentrations. In contrast, kainate channels were characterized by brief openings without bursts. Consistent with the view that ‘bursty’ events arose from AMPARs, these openings decreased in the presence of the AMPAR blocker GYKI 53655. Furthermore, our experiments revealed a concentration-dependent increase in the number of conductance states during an individual AMPAR opening; AMPAR channels displayed up to four distinct levels. Our results are consistent with the view that the AMPAR channel conductance depends on the number of transmitter molecules bound in CA1 cells. We consider the implications of these findings for the change in EPSC properties during long-term potentiation (LTP).
The behaviour of AMPA-type glutamate receptor (AMPAR) channels is crucial in determining properties of synaptic transmission at a majority of excitatory synapses in the brain. In addition, there is compelling evidence that a change in AMPAR excitability plays a key role in the expression of certain forms of synaptic plasticity. The best characterized form of plasticity at central synapses is long-term potentiation (LTP) in hippocampal CA1 cells (Bliss & Collingridge, 1993; Bear, 1999; Malenka & Nicoll, 1999). Non-stationary noise analysis of the EPSC in these cells has revealed a detectable increase in the synaptic channel conductance following LTP induction (Benke et al. 1998; Benke et al. 2001). Since AMPARs with different subunit compositions display marked variation in their basic channel properties (Mosbacher et al. 1994; Swanson et al. 1997), the increased channel conductance would be consistent with evidence demonstrating that LTP/LTD (long-term depression) involves activity-dependent control of AMPAR trafficking, and consequent change of AMPAR subtype (Shi et al. 2001; Piccini & Malinow, 2002; Bredt & Nicoll, 2003; Collingridge et al. 2004; Terashima et al. 2004). Further, the change in AMPAR phosphorylation that occurs during LTP (Barria et al. 1997) may also be expected to modulate single-channel conductance and open probability (Derkach et al. 1999; Banke et al. 2000; but see Oh & Derkach, 2005). Thus, while a number of interrelated mechanisms may underlie enhancement of AMPAR responsiveness, it seems clear that functional modification of AMPAR channel properties is crucial to this process.
A great deal is known about subunit expression (Ritter et al. 2002) and macroscopic characteristics of non-NMDA receptors in hippocampal CA1 cells (Jonas & Sakmann, 1992; Spruston et al. 1995; Bureau et al. 1999; Banke et al. 2000; Benke et al. 2001; Shi et al. 2001; Andrasfalvy et al. 2003). However, the single-channel properties of AMPA and kainate receptors have received much less attention. Because of this, it has been difficult to relate functional changes in the synaptic current with single-channel behaviour in these cells. For example, although the synaptic channel conductance has been estimated (Benke et al. 1998; Benke et al. 2001), it is unclear whether the values obtained match the directly observed single-channel openings. This is a significant consideration since such openings could arise from a homogeneous population of receptor channels, or a highly mixed population. The presence of a mixed channel population (Cull-Candy et al. 1988; Swanson et al. 1996) could profoundly influence any estimate of channel conductance, and complicate the interpretation of the increased channel conductance observed during LTP induction. For example, downregulation of a low-conductance channel within a mixed population, would yield an apparent increase in weighted mean channel conductance estimated from non-stationary noise analysis. From previous studies on individual AMPA and kainate receptor channels in other systems, it was expected that non-NMDARs would display fast channel kinetics with small multiple conductance openings between 0.2 and 25 pS, depending on their subunit composition (Cull-Candy & Usowicz, 1987; Jahr & Stevens, 1987; Swanson et al. 1996; Swanson et al. 1997; Banke et al. 2000; Smith & Howe, 2000; Jin et al. 2003; Oh & Derkach, 2005).
While the majority of fast synaptic transmission in the CNS is mediated by AMPARs, kainate receptors can contribute to excitatory postsynaptic currents at certain synapses, and can also participate in modulating synaptic transmission through their presence in the nerve terminal (Frerking & Nicoll, 2000; Lerma et al. 2001). In the present experiments it was also of interest, and necessary, to characterize events arising from kainate receptors, to allow an unequivocal distinction between different non-NMDAR channels.
AMPA and kainate receptors are often composed of heteromeric assemblies of subunits arising from multiple genes. Hippocampal CA1 pyramidal neurones are known to express mRNA for all four AMPAR subunits (Hollmann & Heinemann, 1994; Monyer et al. 1999). Furthermore, both flip and flop subunit variants are represented in CA1 pyramidal cells, although flop isoforms may tend to predominate at the age we have examined (Bahn & Wisden et al. 2000). Potentially, this could give rise to a considerable variety of AMPAR subtypes. However, at this age the two main AMPAR populations in these cells are likely to be composed of GluR1/GluR2 and GluR2/GluR3 subunit assemblies (Wenthold et al. 1996). Further, it has been demonstrated that GluR6 and KA2 kainate receptor subunits are also expressed in these cells; if others are present they occur at very low level (Wisden & Seeburg, 1993b; Bettler et al. 1992; Herb et al. 1992; Bureau et al. 1999). Kainate receptors in CA1 pyramidal cells could therefore function as homomeric GluR6 assemblies, which would be activated by kainate but not AMPA (see Herb et al. 1992) – or as a heteromeric combination of GluR6/KA2, which would respond to both agonists. The fast component of the EPSC in these cells appears to be mediated entirely by AMPARs, with no contribution from postsynaptic kainate receptors (Frerking et al. 1998). Furthermore, previous studies on macroscopic receptor currents have found that glutamate application onto membrane patches of CA1 cells activates predominantly AMPARs (Spruston et al. 1995).
Here we have compared functional properties of single AMPA and kainate receptor channels, and demonstrated that their conductance and kinetic properties are agonist concentration dependent in hippocampal CA1 pyramidal neurones. These findings have implications for the interpretation of changes in EPSC properties associated with LTP induction.
Methods
Solutions, drugs and chemicals
For slicing, we used an ice-cold Ringer solution with the following composition (mm): 125 NaCl, 2.5 KCl, 1 CaCl2 2 MgCl2, 25 NaHCO3, 1.25 NaH2PO4, 25 glucose, 1 kynurenic acid; pH 7.4. The recording solution contained (mm) 125 NaCl, 3 KCl, 1 CaCl2 2 MgCl2, NaHCO3, glucose, 1 μm tetrodotoxin (TTX; Sigma), 10 μm SR95531 (Tocris Cookson, Bristol), 2 μm strychnine (Sigma, Poole, UK), 2 CsCl; pH 7.4. Furthermore, the NMDA receptor antagonists AP5 (50 μm) and 7-chlorokynurenic acid (20 μm) were added to the external recording solution. In some experiments the AMPAR antagonists GYKI 53655 (100 μm), SYM 2206 (100 μm) or NBQX (10–30 μm) were added to the external solution. Furthermore channels were activated by bath application of glutamate, AMPA, kainate or SYM 2081 (all from Tocris Cookson, Bristol, UK) at concentrations indicated. We did not attempt to compensate for changes in osmolarity or ion concentration produced by bath application of agonist solutions. Patch pipettes were filled with an intracellular solution containing (mm): 125 CsCl, 10 Hepes, 10 BAPTA, 10 TEACl, 1 N-(2,6-dimethylphenylcarbamoylmethyl) triethyl ammonium bromide (QX314), 2 Na2ATP, 2 MgATP, 0.3 Na3GTP, and 0.5 CaCl2, adjusted to pH 7.25 with CsOH, giving a final osmolarity of 285 ± 5 mOsmol/l.
Slice preparation and patch-clamp recording procedures
Preparation of hippocampal slices was carried out in accordance with the UK Animals (Scientific Procedures) Act of 1986. After decapitation of 12-day-old-rats (P12), their brains were rapidly removed as previously described (Misra et al. 2000). Horizontal slices (250 μm) were cut using a vibrating microslicer (DTK-1000; Dosaka EM Co., Kyoto, Japan). The slice contained the ventral hippocampus, entorhinal, perirhinal, and temporal cortices. Several slices were then maintained in a holding chamber containing slicing solution saturated with 95% O2−5% CO2, pH 7.4 and kept at room temperature for at least 1 h. For electrophysiological examination, these were transferred to a recording chamber perfused continuously with bubbled external solution, and viewed on an Axioskop-FS microscope (Zeiss, Welwyn Garden City, UK).
Patch-pipettes were pulled from thick-walled borosilicate glass capillaries (GC-150F; Harvard Apparatus Ltd, Edenbridge, UK), coated with Sylgard resin (Dow Corning, USA) and fire polished to a final resistance of 10–12 MΩ when filled with pipette solution. Outside-out patches were excised from visually identified pyramidal neurones in the CA1 layer. Before recordings were initiated, the patch-electrode noise level was checked. A root mean square noise level of <0.3 pA (bandwidth 5 kHz) was considered acceptable.
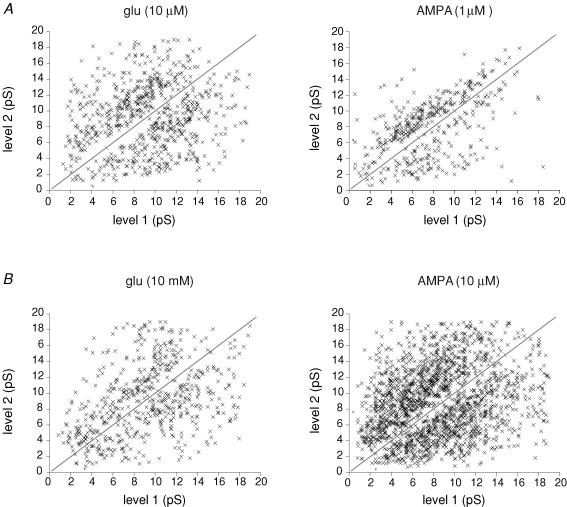
The actual range we obtained was 0.18–0.3 pA; to further minimize the noise for analysis, data were filtered at 1–2 kHz.
Before patches were exposed to bath-applied agonists, control recordings were made. Patches that showed any spontaneous channel activity (about 20% of all patches) were discarded. All channels examined were activated by steady bath application of agonist.
Steady-state single-channel activity was recorded at room temperature using a Axopatch 200A clamp amplifier (Axon Instruments, Union City, CA) and stored on digital audio tape (DC −20 kHz; DTR-1204; BioLogic, Claix, France.
Data acquisition and analysis
For analysis, single-channel currents were replayed from tape, amplified, filtered at 1–2 kHz (four-pole Bessel type) and digitized at 20 kHz using a CED 1401 Interface (Cambridge Electronic design, Cambridge, UK). Each digitized record was analysed using SCAN, an interactive computer program (http://www.ucl.ac.uk/Pharmacology/dc.html) that fits the time-course of each individual event with the step response of the recording system (Colquhoun & Sigworth, 1995). Distributions of amplitudes, and open and shut times were obtained from the time-course-fitted data.
Amplitude histograms were fitted with multiple Gaussian components, until an optimal fit was obtained; depending on the patch, this number varied between three and five. The amplitude histograms were obtained from fitted amplitudes (SCAN) and fitted with a mixture of Gaussians. Only openings longer than 1 ms (∼2.5 × filter rise time) were included. Amplitude histograms were initially fitted with three Gaussians; additional components (5–6) were added, provided the fit showed a marked improvement. If an additional Gaussian did not further improve the fit, they were removed. To compare amplitude distributions at different glutamate concentrations, we calculated the mean of all amplitudes, in all patches exposed to the same concentration.
Distributions of shut times, open times and burst lengths were made using a logarithmic transformation of the abscissa and a square root transformation of the ordinate. The resolution of open and shut times was set to 80–140 μs. In our histograms the frequency tends to fall off within this time window, and events briefer than this were not detected. We did not correct for these missed events, since our analysis was focused mainly on events >1 ms. In those patches where we estimated the fraction of events <100 μs (the most frequently used resolution), this varied betweeen 1% and 22%. Distributions were fitted with probability density functions that were a mixture of two to four exponential components. Bursts of openings were defined as individual openings separated by shut times of duration less than a critical shut time, τcrit. The τcrit values were calculated so that the number of long shut times that were misclassified as within-bursts was equal to the number of short shut times that were misclassified as between-bursts by numerical solution of the equation:
| (1) |
where τfast and τslow are the two shortest exponentials obtained from the shut time distribution. Higher-order activation clusters were not analysed.
Results
Single AMPA and kainate receptor channels in CA1 pyramidal cells
We were interested to determine basic properties of non-NMDAR channels activated by the transmitter (glutamate) over a broad range of concentrations, including those attained in the cleft during the transmission process (1–5 mm; Clements, 1996; Bergles et al. 1999; Barbour, 2001). To activate all non-NMDAR subtypes present we initially applied a high concentration (10 or 20 mm) of glutamate to outside-out patches of CA1 pyramidal cells in thin hippocampal slices (in the presence of AP5 and 7-chlorokynurenic acid, to block NMDARs). However, to verify, separately, that kainate receptors could be detected, patches were also exposed to the selective kainate agonist SYM 2081.
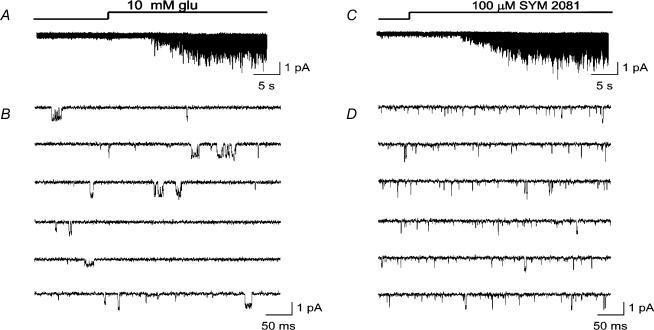
Figure 1 shows representative responses from outside-out patches (at membrane potential, Vm = −100 mV), exposed to 10 mm glutamate (Fig. 1A and B), and 100 μm SYM 2081 (Fig. 1C and D). SYM 2081 is thought be 1500-fold more potent for kainate receptors than AMPAR (Donevan et al. 1998). While no channel activity was detectable in the absence of these agonists, inward currents were clearly activated during drug application. Figure 1B and D illustrates single-channel records (same patches as in A and C), on a faster time scale – to permit individual events to be resolved.
Figure 1. Single-channel currents activated by glutamate and SYM 2081 in outside-out patches from CA1 cells in hippocampal slices.
A and C, onset of response to application of 10 mm glutamate (A) or 100 μm SYM 2081 (C) displayed on a slow time base (calibration 1 pA and 5 s); responses were from two different patches. B and D, single-channel currents (same patches as depicted in A and C) in response to steady application of glutamate (B), or the kainate receptor agonist SYM 2081 (D). Note that events are markedly briefer when activated by SYM 2081, compared with glutamate. Patches were examined at Vm = −100 mV. Bathing solution contained AP5 (50 μm) and 7-chlorokynurenic acid (20 μm) to block NMDA receptors; Data were low-pass filtered at 1 kHz and digitized at 20 kHz.
From visual inspection of the openings, it was immediately apparent that while both agonists produced events of somewhat similar amplitude, SYM activated predominantly brief openings. We therefore reasoned that, because of the high selectivity of SYM, most brief events (including those activated by glutamate), may arise from kainate receptors; conversely, longer openings may be arising mainly from AMPARs. We will consider this working hypothesis in more detail below.
Single-channel currents activated by increasing concentrations of glutamate
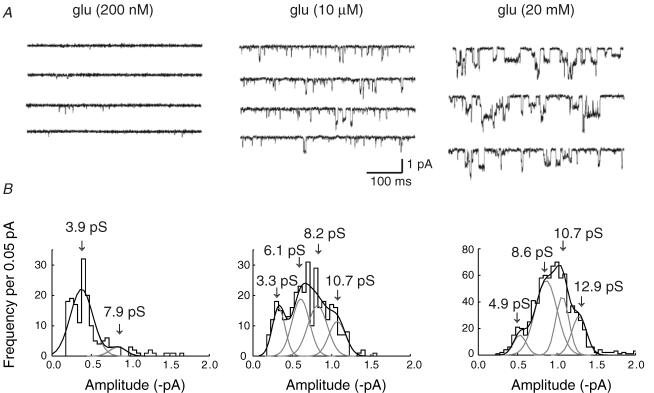
We next tested whether the properties of single channels activated by glutamate were influenced by transmitter concentration (Rosenmund et al. 1998; Smith & Howe, 2000), as this could have implications for the interpretation of a change in channel conductance associated with LTP in CA1 cells (Benke et al. 1998). Figure 2A shows channel activity in response to three different glutamate concentrations (Vm = −100 mV). We obtained a low frequency of brief openings in the presence of 200 nm glutamate (Fig. 2A, left traces). On the other hand, from a cursory examination it is apparent that at higher glutamate concentrations (10 μm or 20 mm), the frequency, mean duration, and mean amplitude of openings, all increased dramatically. Indeed, because of the long duration of events seen at the highest concentration of glutamate (20 mm), many openings displayed exceptionally well-resolved conductance levels (see Fig. 2A, right traces).
Figure 2. Single-channel events displayed a marked increase in conductance and open time with increasing glutamate concentration.
A, single-channel activity recorded in an outside-out patch exposed to increasing concentrations of glutamate: 200 nm, 10 μm and 10 mm. The frequency of events increased with concentration. Note also the apparent marked increase in amplitude and open time. B, corresponding amplitude histograms of single-channel currents activated by 200 nm, 10 μm and 10 mm glutamate (same patch as in A). Amplitude distributions were fitted with two Gaussian components at 200 nm glutamate, and four Gaussians at higher glutamate concentrations. Arrows indicate mean conductance levels obtained from the fitted Gaussians. Only transitions from the closed state (with openings >1 ms), were included in distributions. Vm = −100 mV; data were low-pass filtered at 1 kHz and digitized at 20 kHz.
Figure 2B shows amplitude distributions corresponding to the single-channels depicted in Fig 2A. The abscissa of the amplitude histograms represents the calculated amplitude of individual channel openings, fitted with SCAN (see Methods). As described later (see Fig. 6), many channel openings underwent transitions to several different conductance states before finally closing. Therefore, it was sometimes difficult to decide whether an increase in amplitude (during a channel opening) arose from a transition to a new conductance state, or from a second channel that had simultaneously opened. Hence, to avoid artefacts that might result from the superimposition of channel openings, only those events that arose directly from the closed state, or returned directly to it, were included in amplitude histograms. As a result, the value we obtained may be slightly underestimated because the probability of superimposition of openings is greater when events are longer lasting – as occurs for the higher-conductance openings. On the other hand, it is worth noting that small-amplitude events (<2 pS) will be missed from our analysis, which will give a slight overestimate of mean conductance.
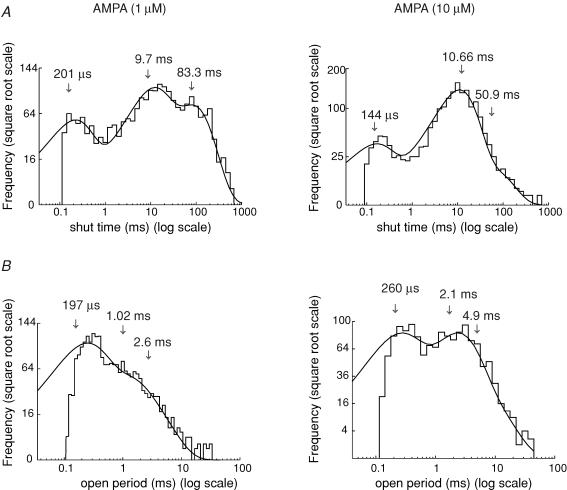
Figure 6. Distribution of shut times and open periods for channels activated by two different AMPA concentrations.
A, shut time distributions for channels activated by 1 and 10 μm AMPA. The distributions were fitted with three exponential components. Arrows indicate the estimated time constants. B, open period distributions for channels activated by 1 and 10 μm AMPA; the distributions were fitted with three exponentials (same patch as depicted in Fig. 5). Note the clear shift to longer open periods with higher AMPA concentrations. Vm = −100 mV.
Amplitude distributions were best fitted with multiple Gaussians. In the presence of 200 nm glutamate, we achieved a reasonable fit with two Gaussian components; on the other hand, the histograms obtained in the presence of 10 μm and 20 mm glutamate, required four Gaussians to provide an adequate fit (in Fig. 2B).
When we examined data from all of the patches that were exposed to the higher concentrations of glutamate (10 μm and 20 mm), it was possible to identify seven main conductance levels (see below). While the number present varied from patch to patch (between four and six), the fitted Gaussians invariably fell into one of these identified levels. This is not unexpected for cells where the population of native receptors may well show heterogeneity.
Our mean single-channel conductance estimates (mean ± s.e.m.) were, in 200 nm glutamate γ = 5.0 ± 0.03 pS (n = 4 patches); in 10 μm glutamate γ = 6.9 ± 0.2 pS (n = 5); and in 20 mm glutamate γ = 11.2 ± 0.2 pS (n = 6). These differences are statistically significant between all three values (Student's t test, P < 0.01). Thus, in all patches studied, we found an approximate doubling in mean single-channel conductance when glutamate concentration was increased from 10 μm to 20 mm.
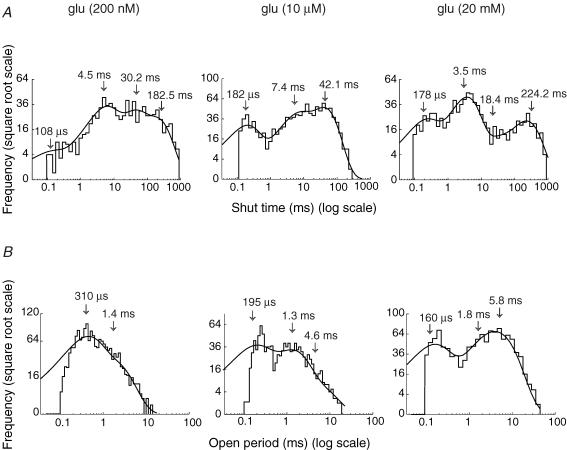
In addition, from examining the single-channel openings, there appeared to be a clear change in their kinetic properties with increasing glutamate concentration (Fig. 3A). We investigated this by constructing histograms of shut times and open periods (defined in Methods). The distributions of shut times, such as those shown in Fig. 3A, were best fitted with three or four exponential components when channels were activated by 200 nm, 10 μm and 20 mm glutamate.
Figure 3. Distribution of shut times and open periods for channels activated by increasing concentrations of glutamate.
A, shut time distributions for channels activated by glutamate at 200 nm, 10 μm and 20 mm. The distributions were fitted with either three or four exponential components. Arrows indicate the estimated time constants obtained from the best fit of the distributions. Note the increase in the relative area of τ1 (the fastest component), with increasing glutamate concentration. B, open period distributions for channels activated by glutamate at 200 nm, 10 μm and 20 mm. These distributions were fitted with either two or three exponential components. Note the increase in the relative proportion of longer-duration events with increasing glutamate concentration. All distributions were obtained from time-course fitting of events (same patch as depicted in Fig. 2). Vm = −100 mV.
The mean time constants for shut times (and their relative areas) were as follows. In 200 nm glutamate, τ1 = 0.34 ± 0.08 ms (8 ± 1%), τ2 = 7.0 ± 0.7 ms (44 ± 3%), τ3 = 30.2 ± 2 ms (10 ± 1%) and τ4 = 182 ± 4 ms (38 ± 2%) (n = 4 patches); in 10 μm glutamate, τ1 = 0.18 ± 0.01 ms (14 ± 2%), τ2 = 8.5 ± 0.9 ms (72 ± 5%) and τ3 = 37.5 ± 2.2 ms (14 ± 3%) (n = 7); and in 20 mm glutamate, τ1 = 0.14 ± 0.01 ms (34 ± 2%), τ2 = 2.7 ± 0.2 (34 ± 3%), τ3 = 28.6 ± 4.9 (19 ± 2%) and τ4 = 345 ± 50 (13 ± 1%) (n = 9).
In contrast with τ1 and τ4, there was no clear evidence that the time constants τ2 and τ3, or their relative areas, were dependent on glutamate concentration. Whereas τ2, τ3 and τ4 are difficult to interpret, as they are influenced by factors such as the number of channels within a patch (which is unknown, and could vary over a wide range), τ1 is thought to reflect the shut time within a burst. This value should not therefore be affected by the number of channels activated. While τ1 itself showed no significant dependence on glutamate concentration, its relative area showed a clear increase. We obtained a statistically significant difference between 10 μm and 20 mm glutamate (Student's t test, P < 0.01). This reflects the fact that at higher glutamate concentrations, channel openings became more ‘bursty’ (see below).
As illustrated in Fig. 3B, an adequate description of the open periods required distributions to be fitted with the sum of two exponential components in the presence of 200 nm glutamate, and three exponentials in the presence of 10 μm and 20 mm glutamate. As the open period measured the total time that a channel was open, the value obtained was independent of the conductance level(s) adopted during the opening. The mean time constants (and relative areas) were estimated to be: in 200 nm glutamate, τ1 = 0.23 ± 0.02 ms (75 ± 2%), and τ2 = 1.32 ± 0.05 ms (25 ± 2%) (n = 4); in 10 μm glutamate, τ1 = 0.29 ± 0.01 (41 ± 2%), τ2 = 1.14 ± 0.04 (38 ± 3%), and τ3 = 3.7 ± 0.2 (21 ± 3%) (n = 7); and in 20 mm glutamate, τ1 = 0.15 ± 0.01 (37 ± 2%), τ2 = 2.1 ± 0.2 (35 ± 4%) and τ3 = 5.8 ± 0.7 (28 ± 5%) (n = 9).
The mean value of the fastest component (τ1) was not significantly affected by glutamate concentration, whereas its relative area was significantly decreased in the presence of higher glutamate concentrations (10 μm or 20 mm) compared with that found in 200 nm glutamate (Student's t test, P < 0.05). Furthermore, in none of the four patches exposed to 200 nm glutamate could we detect the longest open period component (τ3). At 20 mm glutamate the exponentials τ2 and τ3 were larger than in 10 μm glutamate; the difference was statistically significant only for τ2 (Student's t test, P < 0.05). Visually identified superimposed openings were not included in the analysis. Exclusion of such ‘double’ events, which are more frequent at longer open times, will mean that τ3 and its corresponding area will be slightly underestimated at the higher glutamate concentrations. Hence, the real concentration dependence of open times will be greater than observed. As is apparent from Fig. 3B, the overall effect of increasing glutamate concentration, was to shift the open periods to the right.
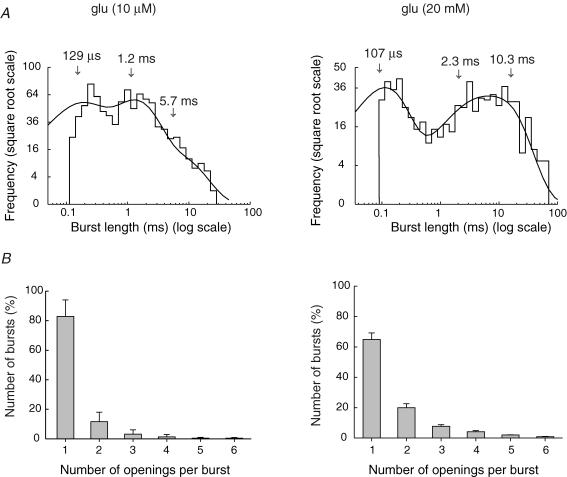
Burst length distributions (Fig. 4A) were generally fitted with the sum of three exponentials. To decide whether or not the brief closings were occurring within a burst, we estimated a critical shut time (τcrit) for each patch (see Methods). The mean values obtained for τcrit were: 0.37 ± 0.03 ms in 10 μm glutamate, and 0.33 ± 0.04 ms in 20 mm glutamate. Because of the relatively small number of bursts (and hence the small area of τ1) in the presence of 200 nm glutamate, we did not attempt to estimate burst length at this concentration. The burst length parameters could, however, be estimated for 10 μm, and 20 mm glutamate. These were: in 10 μm glutamate, τ1 = 0.22 ± 0.02 ms (42 ± 2), τ2 = 1.3 ± 0.07 ms (44 ± 1) and τ3 = 5.5 ± 0.4 ms (14 ± 2) (n = 7); and in 20 mm glutamate, τ1 = 0.24 ± 0.04 ms (40 ± 2), τ2 = 2.9 ± 0.4 ms (31 ± 3) and τ3 = 9.1 ± 0.6 ms (29 ± 4) (n = 9). While τ1 and its relative area were similar at both glutamate concentrations (10 μm and 20 mm), τ2 and τ3 appeared to increase with concentration, and the relative area for τ3 was larger in 20 mm glutamate. The increase in τ3 was statistically significant (Student's t test, P < 0.05).
Figure 4. Distribution of burst lengths and number of openings per burst, in the presence of two different glutamate concentrations.
A, burst length distributions, for channels activated by 10 μm or 20 mm glutamate. Distributions were fitted with three exponential components (arrows indicate time constants). B, distribution of the number of openings in a burst, when channels were activated by 10 μm or 20 mm glutamate. Up to six openings per burst were observed at both glutamate concentrations. This represents a lower limit, as we were unable to confidently resolve closings that were briefer than 100 μs. Note the increase in the percentage of openings that exhibited burst behaviour at the higher glutamate concentration (from <20% in 10 μm glutamate, to >30% in 20 mm glutamate). Vm = −100 mV. Bars indicate s.e.
Figure 4B shows the geometrical distribution of the number of openings per burst at 10 μm (n = 7) and 20 mm glutamate (n = 9). Note that in 10 μm glutamate, <20% of events occurred in bursts (more than a single opening), while in 20 mm glutamate the percentage of events consisting of bursts increased to nearly 40%. The mean number of openings per burst was 1.26 ± 0.03 (mean ± s.e.m., n = 7) in 10 μm glutamate, and 1.61 ± 0.01 (n = 9) in 20 mm glutamate. This observation is consistent with the increase in the relative area of τ1 of the shut time histograms that we observed in 20 mm glutamate.
A summary of the kinetic description for the different agonists is given in Table 1 (open periods), Table 2 (shut times) and Table 3 (burst lengths). It is worth noting that the increase in burst length and open period that we observed with increasing glutamate concentration, would suggest that an alteration in cleft glutamate concentration profile may be capable of influencing EPSC time-course by modifying channel kinetics.
Table 1.
Distribution of open periods for channels activated by glutamate, AMPA, KA and SYM 2081
| τ1 (ms) area (%) | τ2 (ms) area (%) | τ3 (ms) area (%) | n | |
|---|---|---|---|---|
| Glutamate | ||||
| 200 nm | 0.23 ± 0.02 | 1.32 ± 0.05 | — | 4 |
| (75 ± 2) | (25 ± 2) | |||
| 10 μm | 0.29 ± 0.01 | 1.14 ± 0.04 | 3.7 ± 0.2 | 7 |
| (41 ± 2) | (38 ± 3) | (21 ± 3) | ||
| 20 mm | 0.15 ± 0.01 | 2.1 ± 0.2 | 5.8 ± 0.7 | 9 |
| (37 ± 2) | (35 ± 4) | (28 ± 5) | ||
| AMPA | ||||
| 1 μm | 0.2 ± 0.01 | 1.02 ± 0.04 | 2.9 ± 0.1 | 7 |
| (56 ± 2) | (33 ± 1) | (11 ± 1) | ||
| 10 μm | 0.24 ± 0.02 | 2.1 ± 0.1 | 5.8 ± 0.2 | 6 |
| (31 ± 2) | (49 ± 3) | (20 ± 5) | ||
| Kainate (30 μm) | 0.28 ± 0.05 | 1.1 ± 0.1 | — | 4 |
| (49 ± 1) | (51 ± 3) | |||
| SYM 2081 (100 μm) | 0.23 ± 0.01 | 1.20 ± 0.07 | — | 7 |
| (73 ± 2) | (27 ± 2) | |||
Table 2.
Distribution of shut times for channels activated by glutamate, AMPA, KA and SYM 2081
| τ1 (ms) area (%) | τ2 (ms) area (%) | τ3 (ms) area (%) | τ4 (ms) area (%) | |
|---|---|---|---|---|
| Glutamate | ||||
| 200 nm | 0.34 ± 0.08 | 7.0 ± 0.7 | 30.2 ± 2 | 182 ± 4 |
| (8 ± 1) | (44 ± 3) | (10 ± 1) | (38 ± 2) | |
| 10 μm | 0.18 ± 0.01 | 8.5 ± 0.9 | 37.5 ± 2.2 | — |
| (14 ± 2) | (72 ± 5) | (14 ± 3) | ||
| 20 mm | 0.14 ± 0.01 | 2.7 ± 0.2 | 28.6 ± 4.9 | 345 ± 50 |
| (34 ± 2) | (34 ± 3) | (19 ± 2) | (13 ± 1) | |
| AMPA | ||||
| 1 μm | 0.22 ± 0.02 | 9.2 ± 0.3 | 93 ± 13 | — |
| (19 ± 4) | (46 ± 2) | (35 ± 2) | ||
| 10 μm | 0.16 ± 0.07 | 8.5 ± 0.3 | 55.7 ± 7.5 | — |
| (23 ± 1) | (67 ± 1) | (10 ± 1) | ||
| KA (30 μm) | — | 4.6 ± 1.3 | — | — |
| SYM 2081 (100 μm) | 0.13 ± 0.02 | 9.5 ± 1.3 | 133 ± 11 | — |
| (7 ± 2) | (57 ± 9) | (37 ± 7) | ||
Table 3.
Distribution of burst lengths at different glutamate and AMPA concentrations
| τ1 (ms) area (%) | τ2 (ms) area (%) | τ3 (ms) area (%) | Mean number of openings per burst | n | |
|---|---|---|---|---|---|
| Glutamate | |||||
| 10 μm | 0.22 ± 0.02 | 1.30 ± 0.07 | 5.5 ± 0.4 | 1.26 ± 0.03 | 7 |
| (42 ± 2) | (44 ± 1) | (14 ± 2) | |||
| 20 mm | 0.24 ± 0.04 | 2.9 ± 0.4 | 9.1 ± 0.6 | 1.61 ± 0.01 | 9 |
| (40 ± 2) | (31 ± 3) | (29 ± 4) | |||
| AMPA | |||||
| 1 μm | 0.19 ± 0.02 | 1.08 ± 0.06 | 3.94 ± 0.02 | 1.26 ± 0.01 | 7 |
| (51 ± 1) | (36 ± 1) | (13 ± 1) | |||
| 10 μm | 0.22 ± 0.04 | 2.1 ± 0.3 | 9.2 ± 1.6 | 1.29 ± 0.02 | 6 |
| (38 ± 4) | (39 ± 3) | (23 ± 3) | |||
According to our working hypothesis – that brief openings arose mainly from glutamate activation of kainate receptors – it was possible that the component of the open period distribution fitted by τ1 reflected predominantly kainate receptor activations. Indeed, previous studies have suggested that glutamate activates predominantly AMPARs in these cells (see Spruston et al. 1995).
Single-channel currents activated by increasing concentrations of AMPA
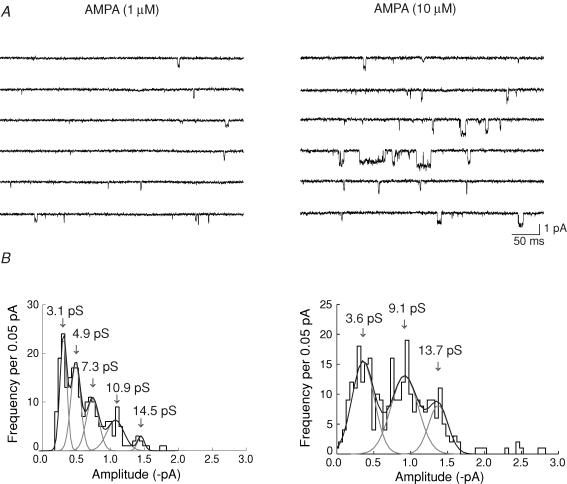
We next considered whether single-channel currents exhibited concentration dependence when activated by other agonists. Again, we examined amplitudes, shut times, open periods and burst behaviour of individual openings activated by 1 μm and 10 μm AMPA. Figure 5 shows recordings obtained from a patch exposed to 1 μm and 10 μm AMPA, and the corresponding amplitude histograms fitted with multiple Gaussians (five in 1 μm, and three in 10 μm AMPA). As we previously observed with glutamate, when data from all patches were examined, it was possible to identify seven main conductance levels (see below).
Figure 5. Single-channel currents activated by two different concentrations of AMPA.
A, single-channel activity recorded in an outside-out patch exposed to 1 and 10 μm AMPA. The frequency of events increased with concentration. Note also the apparent increase in the amplitude and open time of events at the higher AMPA concentration. B, corresponding amplitude histograms of single-channel currents activated by 1 and 10 μm AMPA (same patch as in A); distributions were fitted, respectively, with five and three Gaussian components. Arrows indicate mean conductance levels obtained from the fitted Gaussians. Only transitions from the closed state (with openings >1 ms), were included in the distributions. Vm = −100 mV; data were low-pass filtered at 1 kHz and digitized at 20 kHz.
In this example, we estimated the mean single-channel conductance to be, γ = 6.1 pS in 1 μm AMPA; and γ = 9.3 pS in 10 μm AMPA. Overall, the mean conductance was: γ = 6.3 ± 0.01 pS (n = 7cells) in 1 μm AMPA; and γ = 7.7 ± 0.07 pS (n = 5 cells) in 10 μm AMPA. Although the mean increase in amplitude was not statistically significant across all patches, the effect appeared consistent. It was expected that with higher concentrations of AMPA the increase would have been apparent. However, in all such patches, the intense level of channel activity produced by high AMPA concentrations precluded detailed analysis.
Typical shut time distributions for the different AMPA concentrations are shown in Fig. 6A. The histograms were fitted with three exponential components. The mean time constants (and relative areas) in 1 μm AMPA were, τ1 = 0.22 ± 0.02 (19 ± 4%), τ2 = 9.2 ± 0.3 (46 ± 2%), τ3 = 93 ± 13 ms (35 ± 2%) (n = 7). In 10 μm AMPA the values were, τ1 = 0.16 ± 0.07 (23 ± 1%), τ2 = 8.5 ± 0.3 (67 ± 1%) and τ3 = 55.7 ± 7.5 (10 ± 1%) (n = 6). The shorter shut time components (τ1 and τ2), and their relative areas, were similar at the two concentrations. The slowest component (τ3) and its relative area appeared smaller in 10 μm AMPA. This difference was statistically significant for the relative area of τ3 (Student's t test, P < 0.05). In contrast with our glutamate data, a fourth exponential was not detected in any of the patches exposed to AMPA.
At both AMPA concentrations, the open period histograms (Fig. 6B) could be satisfactorily fitted with three exponentials in all patches. The mean time constants (and relative areas) obtained with 1 μm AMPA were, τ1 = 0.2 ± 0.01 (56 ± 2%), τ2 = 1.02 ± 0.04 (33 ± 1%), τ3 = 2.9 ± 0.1 ms (11 ± 1%) (n = 7). In 10 μm AMPA the values were, τ1 = 0.24 ± 0.02 (31 ± 2%), τ2 = 2.1 ± 0.1 (49 ± 3%) and τ3 = 5.8 ± 0.2 (20 ± 5%) (n = 6). While the fastest component (τ1) showed no significant change with concentration, its relative area was significantly smaller at the higher concentration (10 μm AMPA). On the other hand, both τ2 and τ3 were significantly smaller in the lower AMPA concentration (1 μm). The relative area of τ2 was significantly reduced in 1 μm AMPA, whereas the relative area of τ3 showed no significant change.
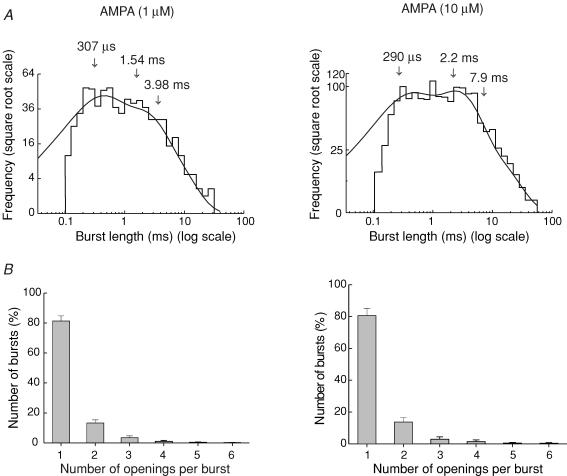
As illustrated in Fig. 7A, at both AMPA concentrations the burst length distributions were best fitted with the sum of three exponential components. The burst length parameters were, in 1 μm AMPA, τ1 = 0.19 ± 0.02 ms (51 ± 1%), τ2 = 1.08 ± 0.06 ms (36 ± 1%) and τ3 = 3.94 ± 0.02 ms (13 ± 1%) (n = 7). In 10 μm AMPA the values were τ1 = 0.22 ± 0.04 (38 ± 4%), τ2 = 2.1 ± 0.3 (39 ± 3%), and τ3 = 9.2 ± 1.6 (23 ± 3%) (n = 6). Whereas the fastest component (τ1) showed no significant concentration dependence, both τ2 and τ3 were significantly increased in 10 μm AMPA. The relative areas of all three time constants showed no significant change. The mean number of openings per burst (1.26 ± 0.01 at 1 μm AMPA and 1.29 ± 0.02 at 10 μm AMPA, Fig. 7B) was similar at these two AMPA concentrations examined.
Figure 7. Distribution of bursts length and number of openings per burst, in the presence of two different AMPA concentrations.
A, burst length distributions for channels activated by 1 and 10 μm AMPA. Distributions were fitted with three exponential components (arrows indicate time constants). B, distribution of the number of openings in a burst, for channels activated by 1 and 10 μm AMPA. Up to six openings per burst were observed at both AMPA concentrations. For both concentrations, the number of events showing burst behaviour (more than one opening per activation) was <20%. Vm = −100 mV.
Thus, in common with glutamate-activated channels, it seems that the burst length and open period of channels in these patches were increased at higher AMPA concentrations. It is also notable that the open periods and burst lengths showed striking similarities for glutamate and AMPA (see Tables 1 and 3). This would be consistent with the view that a majority of channel openings arose from AMPARs.
Single-channel currents activated by kainate and SYM 2081
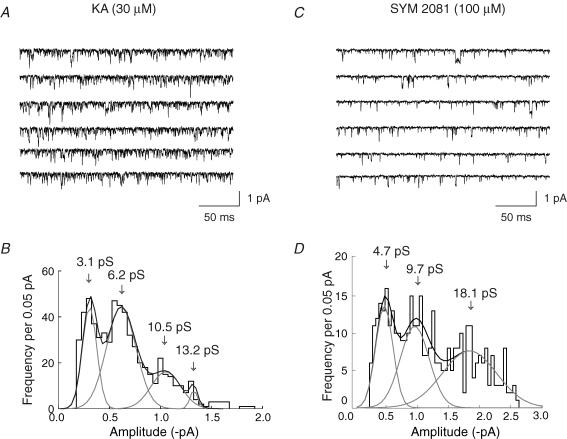
To test further our working hypothesis, that brief events in these patches arose selectively from native kainate receptors in CA1 cells, we examined channels activated by kainate and SYM 2081 (selective kainate agonist) (Fig. 8A and C). In all patches examined, 30 μm kainate activated a high frequency of very brief events. At higher kainate concentrations (100 μm) individual openings could no longer be clearly resolved (data not shown). The kainate-activated openings exhibited conductances of 3–15 pS, falling within the range activated by glutamate and AMPA in these cells. In contrast, while SYM 2081 (10, 50 and 100 μm) also activated a high frequency of brief events, it gave a greater proportion of well-resolved higher-conductance openings (>15 pS) (Figs 8C and 11A).
Figure 8. Single-channel currents activated by the kainate receptor agonists kainate and SYM 2081.
A and C, single-channel activity recorded in outside-out patches exposed to 30 μm kainate (A), or 100 μm SYM 2081 (C). Note the prevalence of very brief events in both sets of recordings. B and D, corresponding amplitude histograms of single-channel currents obtained with 30 μm kainate (B), or 100 μm SYM 2081 (D). Distributions were fitted with four (kainate) and three (SYM 2081) Gaussians, respectively. Arrows indicate the mean conductance levels. There was a clear prevalence of higher-conductance events in the presence of SYM 2081. Only transitions from the closed state (and with openings >1 ms), were included in the distributions. Vm = −100 mV. Data were low-pass filtered at 1 kHz and digitized at 20 kHz.
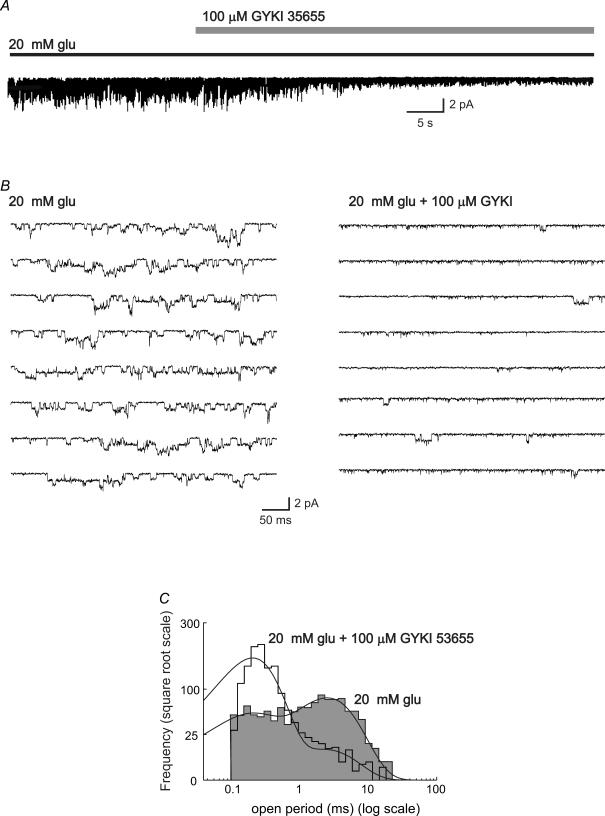
Figure 11. The AMPAR antagonist GYKI 53655 selectively suppressed burst activity of glutamate-activated channels.
A, outside-out patch response to steady-state application of 20 mm glutamate was suppressed by the application of 100 μm GYKI 53655. B, examples of glutamate-activated single-channel currents in the absence (left-hand traces) and presence (right-hand traces) of 100 μm GYKI 53655 (same patch as A, shown on a faster time base). In the presence of GYKI, the larger-amplitude events, and those events with longer open times were replaced by smaller, briefer openings. C, corresponding histograms of open periods activated by 20 mm glutamate in the absence (shaded histogram) and presence (open histogram) of 100 μm GYKI 53655. The distributions were fitted with two exponential components. Whereas the number of transitions was unaffected, the histograms demonstrate a clear shift to briefer events in the presence of GYKI 53655. Vm = −100 mV. Data were low-pass filtered at 1 kHz and digitized at 20 kHz.
The presence of some high-conductance events among the openings activated by 100 μm SYM 2081 was apparent from a comparison of the amplitude histograms (Fig. 8B and D). Only openings with durations >1 ms were included in the distributions. For kainate, the histogram was fitted with four Gaussian components, while for SYM 2081 three components were required. In the example shown (Fig. 8), the mean channel conductance was estimated to be γ = 6.1 pS in 30 μm kainate, compared with γ = 10.9 pS in 100 μm SYM. The mean channel conductance for all patches examined was γ = 6.7 ± 0.8 pS (n = 4) in 30 μm kainate, compared with γ = 11.8 ± 0.6 pS in 100 μm SYM (n = 7).
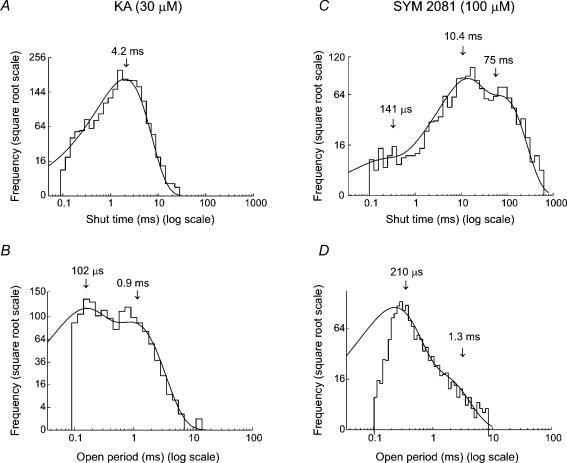
In marked contrast with the other agonists examined, the shut time histograms for all patches exposed to kainate were well fitted with a single exponential with τ = 4.6 ± 1.3 ms (n = 4) (see Fig. 9A). On the other hand, for SYM 2081-activated events (Fig. 9C), the shut time histograms were best fitted with three exponential components, with τ1 = 0.13 ± 0.02 ms (7 ± 2%), τ2 = 9.5 ± 1.3 ms (57 ± 9%) and τ3 = 133 ± 11 ms (37 ± 7%) (n = 7).
Figure 9. Distribution of shut times and open periods for channels activated by kainate and SYM 2081.
A and C, shut time distributions for channels activated by 30 μm kainate (A), or 30 μm SYM 2081 (C). The distributions were fitted with one or three exponential components. Arrows indicate the estimated time constants. The fastest component that was detected in the presence of glutamate or AMPA (see Figs 3 and 6) was small or absent when channels were activated by kainate agonists. B and D, open period distributions for channels activated by 30 μm kainate (B), or 30 μm SYM 2081 (D). The distributions were fitted with two exponentials (same patch as depicted in Fig. 8). Arrows indicate the time constants of the fitted components. Note the clear absence of the slowest component that was detected in the presence of glutamate or AMPA. Vm = −100 mV.
The open period distributions (Fig. 9B and D) were fitted with two exponentials for both agonists. The time constants in 30 μm kainate were estimated to be: τ1 = 0.28 ± 0.05 ms (49 ± 1%) and τ2 = 1.1 ± 0.1 ms (51 ± 3%) (n = 4); and in 100 μm SYM 2081, τ1 = 0.23 ± 0.01 ms (73 ± 2%) and τ2 = 1.2 ± 0.07 ms (27 ± 2%) (n = 7).
The absence of a short shut time component in patches exposed to kainate reflected the absence of resolvable short closings within channel activations, so that channel openings did not display bursts. Although a short shut time component could be detected in channels activated by SYM 2081 (see Fig. 9C), its area (7 ± 2%) was relatively small. We did not therefore attempt to estimate a burst distribution for these patches.
Compared with channels activated by AMPA or glutamate, there was a clear dominance of brief openings and a lack of bursts in the presence of kainate and SYM 2081. Furthermore, the open periods of channels activated by kainate and SYM 2081 displayed some marked similarities, with fewer of the long open periods that characterized AMPA- and glutamate- (10 μm or 20 mm) activated events.
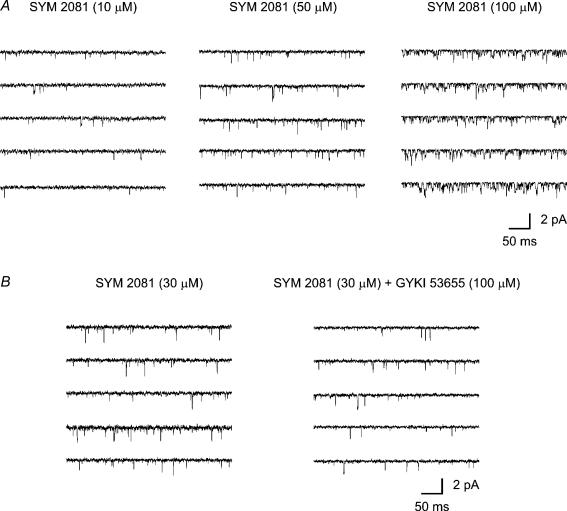
These observations, in particular the activation of brief openings in response to low concentrations of SYM 2018 (10 μm; Fig. 10A), further supported the view that brief events arose mainly from kainate receptors, while the concentration-dependent ‘bursty’ events arose from AMPARs in CA1 cells. To test this hypothesis, we next examined channels activated by SYM 2018 (Fig. 10B) and by glutamate (Fig. 11) in the presence of the highly selective AMPAR antagonist GYKI 53655.
Figure 10. Single-channel currents activated by varying concentrations of SYM 2081, and in the presence of GYKI 53655.
A, single-channel activity recorded in outside-out patches exposed to 10, 50 and 100 μm SYM 2081. Note that channels activated by low (10 μm) and higher concentrations (50 and 100 μm) of SYM 2081 displayed brief openings with conductance levels of 2–20 pS. B, single-channel activity activity before and after application of SYM 2081 to an outside out patch. Note that channels were still activated in the presence of 100 μm GYKI 53655. Vm = −100 mV.
Single-channels in the presence of the AMPAR blocker GYKI 53655
As is apparent in Fig. 10B, following application of GYKI 53655 (100 μm) channels are still activated by 30 μm SYM 2018, consistent with the view that these brief events arose mainly from kainate receptors. However, the application of GYKI 53655 (Fig. 11A) led to a marked decrease in the macroscopic current stimulated by a steady application of 20 mm glutamate. Figure 11B shows examples of the underlying single-channel currents on a faster time base. The reduction in channel activity was characterized by a marked decrease in the long-duration (‘bursty’) openings in the presence of GYKI 53655.
To quantify this observation, we applied a detailed analysis to three patches exposed to glutamate (10 mm) in the absence and presence of GYKI 53655. The properties of the channel openings were dramatically changed in the presence of GYKI. This is illustrated in Fig. 11C, which shows a typical open period distribution in a patch before (shaded histogram) and after (open histogram) GYKI 53655 application. For all patches examined, the majority of glutamate-activated channels measured in the presence of GYKI displayed a reduced contribution from longer-duration events, and an increased proportion of short open periods.
The open period histogram was best fitted with the sum of two exponentials. The mean time constants were, τ1 = 0.19 ± 0.18 ms (94 ± 3%) and τ2 = 2.1 ± 0.6 (6 ± 1%) (n = 3). Surprisingly, the number of transitions during a given period was similar in steady glutamate application, and in the presence of glutamate with GYKI 53655. Furthermore, GYKI 53655 reduced the mean channel conductance from γ = 11.2 ± 1.5 pS (n = 6) in the presence of glutamate (Vm = −100 mV), to γ = 6.9 ± 2.0 pS (n = 3) in glutamate with GYKI. The latter value closely approximates the channel conductance activated by 30 μm kainate (6.7 pS). These observations are consistent with the view that the ‘bursty’ events arose predominantly from AMPARs in CA1 neurones, and that brief openings arose from kainate receptors.
Multiple-conductance events were more prevalent at higher agonist concentrations
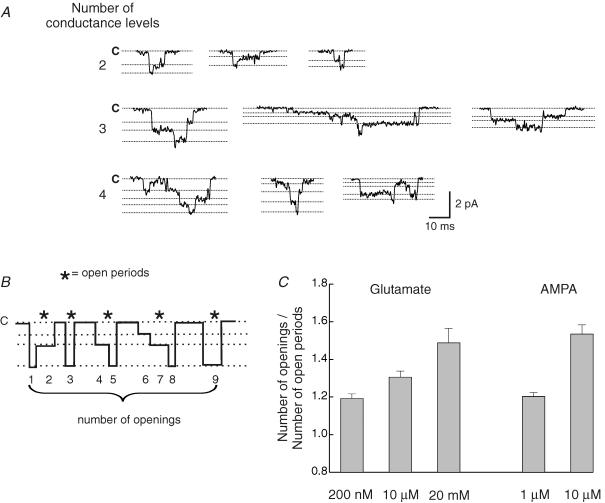
During an individual event, many channel openings adopted several different conductance levels before finally closing. When there is more than one channel in the patch it can be difficult to differentiate the presence of multiple-conductance levels from superimposed openings (Traynelis & Jaramillo, 1998). However, it was of interest to try to obtain an idea of the number of possible conductance levels that could be adopted during an individual opening. Furthermore, it was also of interest to determine whether the number of events displaying multiple conductances increased with higher glutamate concentrations. Figure 12A illustrates examples of individual channel openings (activated by 20 mm glutamate), that have been selected to show the presence of two, three or four different conductance levels. To determine the proportion of events displaying multiple conductance levels we estimated the ratio of the number of openings to the number of open periods (see Fig. 12B for details).
Figure 12. Multiple-conductance levels become more evident at higher agonist concentrations.
A, typical examples of glutamate-activated single-channel currents displaying 2, 3 or 4 discrete conductance levels during an individual opening. The broken lines indicate closed (C) or open levels for each particular example. B, schematic drawing of channel openings displaying multiple-conductance levels, to illustrate the relationship between the number of openings and the number of open periods. The ratio between these parameters, in a particular recording, provides a measure of the mean number of conductance levels present. If the channels open to only a single-conductance state, the ratio will be 1. C, relationship between agonist concentration and the mean number of conductance levels (defined in B). The mean number of conductance states increased significantly with increasing agonist concentrations for both glutamate and AMPA. If more than one channel was open at the same time (which is more likely at higher agonist concentrations), our estimate of the mean number of conductance states may be artificially increased (see Appendix 1). Bars indicate s.e.
We examined this relationship at various concentrations of glutamate and AMPA (Fig. 12C). The mean ratio for the number of conductance levels adopted during an individual opening was 1.19 ± 0.01 in 200 nm glutamate (n = 4), 1.31 ± 0.01 in 10 μm glutamate (n = 10) and 1.49 ± 0.02 in 20 mm glutamate (n = 10). The difference between all three values was significant (Student's t test, P < 0.05). Similarly, a significant increase in this ratio was also observed for openings induced by AMPA. The mean ratio was 1.22 ± 0.02 (n = 7) in 1 μm AMPA, and 1.53 ± 0.05 (n = 6) in 10 μm AMPA (Student's t test, P < 0.01). Thus, at higher concentrations of AMPA and glutamate, we observed a consistent increase in the number of conductance states seen during an individual opening.
To exclude the possibility that an increased prevalence of superimposed openings could account for the observed correlation between increased glutamate (or AMPA) concentration, and the number of openings/number of open periods (Fig. 12C), we estimated the probability that openings in a patch were superimposed (see Appendix). Using this statistical approach we demonstrated that the correlation between agonist concentration and the mean ratio of the number of conductance levels adopted during an individual opening occurred independently of the increased probability of superimposed openings.
Analysis of conductance levels and direct transitions
Analysing the amplitudes of the single-channel currents associated with AMPA and kainate receptors was hampered by the following problems: (1) the conductances were small and openings were brief, limiting our resolution; (2) a variety of different conductances were present in each patch; and (3) there was some patch-to-patch variation. Nevertheless, from the fitted Gaussians we could identify 3–6 (out of 7) different conductance levels in all of the patches exposed to 10 μm or 10 mm glutamate, and 1 μm or 10 μm AMPA.
The conductance values (mean ±s.d.) for each concentration are plotted in Fig. 13A. These values were obtained by identifying a particular conductance level from its fitted Gaussian. The mean for this Gaussian was then averaged across patches. We found no significant difference in the identified conductance values for different concentrations of AMPA and glutamate (Student's t test, P > 0.05).
Figure 13. Plots of direct transitions between two conductance levels during an individual opening at two different concentrations of AMPA and glutamate.
Because the number of direct transitions is low for each concentration different patches were pooled in the plots. In all plots, transitions were seen between all identified conductance levels. Note, in the presence of glutamate the transitions are relatively symmetrical (transitions from lower to higher level: 49.99% in 10 μm glutamate; 51.91% in 10 mm glutamate), whereas asymmetry was detected in the presence of AMPA (transitions from lower to higher level: 59.84% in 1 μm AMPA; 55.46% in 10 μm AMPA).
We were interested to see whether we could separate out subpopulations of channels by using their conductances. To do this, we have tried to determine whether it was possible for a given conductance level to switch to any other level. Therefore as a next step we analysed direct transitions in all openings that showed two different conductance levels. Only openings with direct transitions from or to the shut level were included in our analysis. Figure 13B shows a plot of all direct transition for different concentrations of AMPA and glutamate (all patches pooled). Each point represents an identified transition from conductance level 1 (first level) to conductance level 2. The fact that the data points are relatively unclustered indicates that transitions occur in both directions between all conductance levels. While direct transitions activated by glutamate were symmetrical, with a similar proportion of transitions to higher or lower conductances, the transitions activated by AMPA tend to open via their lower level, and close via their higher level. Although this difference is apparent at 1 μm (Fig. 13B), it became significant only in 10 μm AMPA (Student's t test, P < 0.05).
Discussion
Despite intense interest in the involvement of AMPARs in LTP/LTD in CA1 pyramidal cells, neither AMPA nor kainate receptors have been examined in detail at the single-channel level in these cells. To provide information relevant to synaptic transmission, we analysed the properties of these channels when activated by glutamate, and by selective agonists. Our experiments provide three main findings: (1) distinct AMPA- and kainate-type receptor channels were identified in CA1 cells; (2) AMPARs gave rise to bursts of openings with conductance and kinetic properties that were influenced by glutamate concentration; in contrast kainate receptors did not give rise to bursts; (3) the multiple-conductance states adopted during individual AMPAR openings were more prevalent at high glutamate concentration. Despite the fact that glutamate concentration affects channel conductance, our results support the view that the increased channel conductance following LTP induction (Benke et al. 1998) probably arises from a change in AMPAR channel properties, or receptor subtype (Shi et al. 2001; Bredt & Nicoll, 2003; Collingridge et al. 2004), rather than reflecting a change in cleft glutamate concentration. We will now consider the wider implications of these findings.
Distinct AMPA- and kainate-type receptor channels are present in CA1 cells
Channel properties of a wide variety of AMPA and kainate receptor subtypes have previously been described in recombinant systems (Howe, 1996; Swanson et al. 1996, 1997; Derkach et al. 1999; Banke et al. 2000; Oh & Derkach, 2005), and in identified neurones in slices (Jonas & Sakmann, 1992; Spruston et al. 1995; Banke et al. 2000; Smith & Howe, 2000; Momiyama et al. 2003). For single-channel analysis, we distinguished between kainate and AMPAR channels using the selective kainate receptor agonist SYM 2081, which activated brief openings that did not occur in bursts. These events could also be activated by kainate and glutamate, and displayed properties consistent with the view that they arose from kainate receptors: (1) their fast kinetics resembled those of recombinant kainate receptor channels (Swanson et al. 1996); (2) they appeared to lack concentration-dependent conductance, in agreement with data on kainate channels in cerebellar granule cells (Smith & Howe, 2000); (3) they were resistant to block by GYKI 53655 (AMPAR antagonist). In contrast, AMPARs gave rise to distinct ‘bursty’ openings that could be selectively suppressed by GYKI 53655. These events were noticeable in the presence of glutamate, consistent with previous observations suggesting that glutamate activates a preponderance of AMPARs in CA1 cells (Spruston et al. 1995).
AMPAR bursts of openings display concentration-dependent conductance and kinetics
We have shown that the channel conductance activated by AMPA and glutamate increases with agonist concentration. This finding is in keeping with previous work on a recombinant chimeric AMPAR–kainate receptor (Rosenmund et al. 1998) and on native AMPARs in developing cerebellar granule cells (Smith & Howe, 2000). In patches from CA1 pyramidal cells, we obtained a mean conductance of γ = 7.7 pS when channels were activated by 10 μm AMPA. This matches well the value (7.9 pS) obtained previously using analysis of stationary noise induced by 30 μm AMPA in patches (Jonas & Sakmann, 1992).
During transmission in the hippocampus and cerebellar cortex, the glutamate transient within the cleft is thought to follow a biphasic decay (Silver et al. 1996; Diamond & Jahr, 1997, 2000; DiGregorio et al. 2002), attaining an average peak concentration of roughly 3 mm. This is suggested to decay rapidly (τ = 100 μs) to a more slowly decaying component of 0.5 mm (Bergles et al. 1999; Mainen et al. 1999). Interestingly non-stationary noise analysis of responses to fast application of 1 mm glutamate in CA1 dendritic patches, gave a mean AMPAR channel conductance of γ = 10.2 pS (Spruston et al. 1995). This estimate exceeds slightly the value obtained by Jonas & Sakmann (1992), in keeping with our present observations that channel conductance of AMPARs in CA1 cells is concentration dependent. Furthermore, this estimate matches well our mean value obtained from single-channel analysis. It is of note that we observed roughly a doubling of mean channel conductance from 5 pS in 200 nm glutamate to ∼11 pS in 10 mm glutamate.
We cannot be sure that the extrasynaptic channels that we have examined in the somatic membrane of CA1 cells represent a homogeneous population, or that their properties will be identical to those of the synaptic receptors. Furthermore, it could be argued that the higher-conductance events we observed somehow arose from the presence of a separate population of channels activated only at high glutamate concentration. This seems unlikely for several reasons. First, such a channel would have an unusually high EC50. Second, the change in Gaussian distribution that we observe does not fit well with this idea: the accompanying reduction in the lower-conductance openings would be unexpected unless they desensitize. Third, and most compelling, we see transitions between the low- and high-conductance levels in all patches examined. This implies such events arise from the same receptor channel.
Kainate receptors do not give rise to bursts of openings
Our experiments strongly suggest that the kainate receptors in CA1 cells are composed of GluR6 and KA2 subunits as previously suggested (Wisden & Seeburg, 1993a). Thus, our estimated kainate channel conductance, γ = 6.7 pS, matches well to our previous estimate of γ = 7.1 pS obtained from recombinant kainate receptor assemblies containing GluR6/KA2 subunits (Swanson et al. 1996). Our conductance estimate for kainate receptor channels activated by 30 μm kainate, exceed the value of 3.6 pS obtained using analysis of fluctuations induced by 300 μm kainate (Jonas & Sakmann, 1992). The fast kinetics that we observed for kainate-activated openings, may well cause attenuation of conductance estimates obtained from noise analysis. Although the resolution of both methods is similar, events that were too brief to reach full amplitude could be readily identified, and therefore excluded from the single-channel analysis.
The open periods obtained with kainate or SYM 2081 in CA1 cells displayed time constants that were in the same range as described for recombinant receptors containing GluR6/KA2 subunits (Swanson et al. 1996). The higher conductance value obtained for events activated by 100 μm SYM 2081 (γ = 11.8 pS), might suggest that this concentration of SYM 2081 activates both kainate and AMPARs (Donevan et al. 1998) in these cells, to give a conductance estimate weighted towards the higher levels.
The AMPAR antagonist GYKI 53655 reduced the amplitude and mean open time of glutamate-activated channels, while leaving their frequency of opening virtually unchanged. This supports the view that ‘bursty’ events arose from AMPARs. However, the fact that the frequency was unaltered may reveal information about the action of GYKI 53655. Three possible explanations could account for our observations: (1) the remaining channel openings may arise from kainate receptors; (2) GYKI 53655 may cause ‘flickery block’ of AMPAR channels; or (3) brief low-conductance activations may be counted more efficiently during relatively low channel activity in the presence of GYKI 53655.
Multiple-conductance events at higher agonist concentrations
Single-channel recordings presented in this paper have shown that during an individual channel opening, up to four different conductance states can occur. Previously it has been proposed that the current mediated by the opening of a single AMPA receptor channel is correlated to the number of glutamate molecules bound to the receptor. With two molecules bound, the channel opened to a small conductance; with three molecules bound, a medium conductance was activated; and with four bound molecules (fully liganded) a high conductance was activated (Rosenmund et al. 1998). That in our recordings some channel openings have four different conductance states might result from the fact that these native channels are heteromeric assemblies composed of different subunits showing non-symmetric conductances. It is of note that AMPAR channels in granule cells also give rise to four discrete conductance levels.
Figure 14 show one possible composition, correlating with the conductance states from the opening shown in Fig. 12A. This is a modification of the scheme originally proposed by Rosenmund et al. (1998). In this model we have assumed that the different types of subunits may be correlated with distinct conductance steps. However, it is clear from previous work (Rosenmund et al. 1998) that homomeric receptors can give rise to conductance steps all of which are different.
Figure 14. Model of an AMPAR channel protein that could give rise to four conductance states.
AMPAR channels are tetrameric assemblies composed of four individual subunits. Following the idea that each subunit binds an agonist molecule, leading to an increased conductance level (Rosenmund et al. 1998), we tried to account for a recording of the type shown in the upper part of the figure. For an opening that exhibits four different conductance states, we assume at least four binding conformations are required, and that different subunits correlate with different conductance levels. It is generally assumed that the binding of at least two agonist molecules is required to give rise to a channel opening (Jonas et al. 1993). The lower part of the figure depicts a receptor composed of a pair of dimers (such as, two GluR1s and two GluR2s), in four different binding conformations. This would appear to allow for up to six binding conformations.
As previously noted (Traynelis & Jaramillo, 1998), it can be difficult to decide if any given current level (other than the minimal one) arises from one, or more than one, open channels. This is a general problem when analysing single-channel recordings from patches containing more than one channel. While great care has been taken to minimize inclusion of any ambiguous events in our analysis, we cannot entirely exclude the possibility of some contamination.
Channel conductance and LTP
Benke et al. (1998) estimated the mean conductance value of synaptic AMPAR channels underlying EPSCs at CA1 pyramidal cell synapses to be γ≈ 8 pS. Given the constraints that affect fluctuation analysis of synaptic currents (including limited resolution due to whole-cell noise, and less efficient space clamp than can be achieved in isolated patches; Traynelis et al. 1993; Traynelis & Jaramillo, 1998), which would be liable to produce an underestimate of the synaptic channel conductance, the value compares well with the mean conductance we obtained from directly measured single channels (∼11 pS) at high glutamate concentration. While it was possible to observe occasional higher-conductance openings (of up to 15 pS), the mean channel conductance we observed was less than that reported for synaptic AMPARs following LTP induction (γ≈ 14 pS; Benke et al. (1998). Our results would therefore seem consistent with the interpretation that a basic change in the properties of synaptic AMPAR channels, or a change in AMPAR subtype, occurs following LTP induction. Since there is evidence that AMPARs are not saturated during synaptic transmission, this increased conductance could be interpreted as an increase in the agonist affinity of the AMPAR.
It is worth considering two other possible explanations for a change in synaptic channel conductance, on which our results may shed some light. First, non-stationary noise analysis of the EPSC would detect an apparent increase in channel conductance if LTP induction caused downregulation of a subpopulation of low-conductance AMPAR channels from among a mixed receptor population. This might occur, for example, if femtosiemens channels (Cull-Candy et al. 1988; Howe, 1996; Swanson et al. 1996) were present in CA1 cells. If the somatic and synaptic AMPAR channels are similar in CA1 cells, then our observations would render this explanation unlikely, since we observed a relatively homogeneous population of AMPAR channels, albeit with a concentration dependence to their channel conductance and kinetic properties. Although low-conductance AMPAR channels were not identified in CA1 cell patches, we detected a small noise increase during ‘shut time periods’ in response to glutamate in some patches (unpublished observations). Compared to background noise level this increase was not significant. However, we cannot exclude the existence of such channels in these cells. Indeed, without direct single-channel recording from the postsynaptic membrane the possibility of selective shutdown of femtosiemens channels cannot be entirely ruled out in LTP.
Second, a change in channel conductance might be detected if AMPAR channel conductance is concentration dependent, and if LTP induced a sufficient change in the peak concentration of glutamate within the cleft. Interestingly, even at the very high glutamate concentrations we have examined (up to 20 mm), we did not detect a mean conductance that matched the value obtained following LTP induction (Benke et al. 1998). This strongly suggests that the increased channel conductance following LTP induction more likely reflects a change in the AMPAR subtype, or in AMPAR properties, rather than increased glutamate release and consequent concentration-dependent change in channel properties.
Finally, if the EPSC decay at these synapses is shaped in part by the kinetic properties of the AMPAR channels, one might expect a reasonable agreement between the burst length of the AMPAR channel activated by glutamate, and the decay time constant of the EPSC. Previous estimates of τEPSC in CA1 pyramidal cells are in the range 4–8 ms (Hestrin et al. 1990; Spruston et al. 1995; Benke et al. 1998; Jonas, 2000). This corresponds well to the slowest component in our burst length distributions which ranged between ∼5 and 9 ms (depending on glutamate concentration). Interestingly, if an increase in the concentration of glutamate within the cleft did occur during LTP, our observations suggest there may be a detectable change in EPSC kinetics. As far as we are aware, no such change has been reported.
Acknowledgments
This work was supported by a Wellcome Trust Programme Grant and a Royal Society-Wolfson Research Award to S.G.C.-C. We thank Mark Farrant, Alasdair Gibb, Ian Coombs and June Liu for helpful discussions and comments on the manuscript.
Appendix
Assuming there are N identical not distinguishable channels within the patch, all having the same open probability popen.
Ei = Ei(t): i channels are open at the time t.
p(Ei) = probability that i channels are open at the time t.
Assuming a binomial distribution of the probability that i channels are open is given by
| (A1) |
pclosed is the value obtained from experiments giving the probability that at a certain time t all channels are closed → (1 −pclosed) gives the probability that one or more channels are open at time t.
| (A2) |
 |
(A3) |
For N → ∞ and popen → 0 the binomial distribution becomes a Poisson distribution. Under our experimental conditions the number of channels is sufficiently high, and their open probability sufficiently small, for the distribution to be Poisson.
| (A4) |
The probability that exactly one channel is open at time t is therefore given by:
| (A5) |
Now, having the probabilities P(E0) and P(E1), the probability that at time t more than one channel is open p(Ei, i > 1) is given by:
| (A6) |
And the probability that during an individual opening more than one channels are open is given by:
| (A7) |
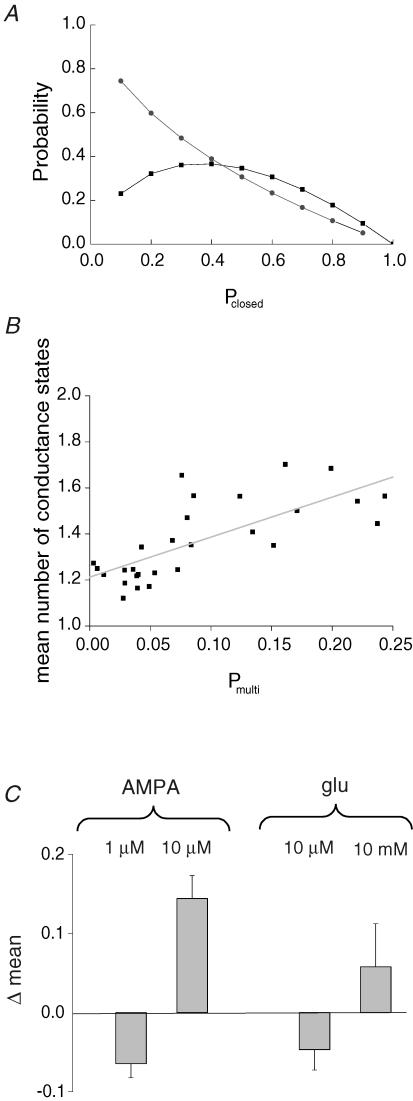
Figure 15A illustrates the theoretical relationship between pclosed and the probability p(E1) that exactly one channel is open (eqn (A5)) at a certain time t, and the probability pmulti that during an individual opening more than one channel is open (eqn (A7)).
Figure 15. The prevalence of multiple-conductance levels at high agonist concentration is independent of the increased probability of channel superimpositions.
A, theoretical relationship between Pclosed and (i) the probability P(E1) that exactly one channel is open at a certain time t (▪); and (ii) the probability Pmulti that during an individual opening more than one channel is open (•). The experimental values for Pclosed vary over a wide range from 0.59 to 0.95; the corresponding Pmulti varies from 0.025 to 0.24. B, the correlation between Pmulti and the mean number of conductance states for each patch analysed. As expected, with higher Pmulti the mean number of conductance states also shows a slight increase. To quantify if there is a statistically significant difference in the correlation between the mean number of conductance states and Pmulti for different AMPA and glutamate concentrations, we calculated for every patch the difference between the mean number of conductance states and the distinct value of the correlation curve (given by the linear fit in B). The result is shown in C. For both AMPA and glutamate there is a statistically significant difference between the concentrations compared. Our data demonstrate that regardless of Pmulti, the mean number of conductance states increase with agonist concentration. Bars indicate s.e.
As a next step we calculated, for each patch, the probability that an individual opening arose from more than one channel. As shown in Fig. 15B there was a linear correlation between the probability pmulti and the mean number of conductance states in the patches analysed. However, pmulti varied over a wide range for recordings obtained under similar conditions, depending on the number of channels in each patch, which can vary between 2 and 200 channels μm−2 (Jonas & Sakmann, 1992). Therefore we calculated the difference between the mean number of conductance states and the linear regression line for a given pmulti. As shown in Fig. 15C, at higher concentrations of AMPA and glutamate the mean number of conductance states was significantly higher than the calculated mean for all patches at a given pmulti,, whereas at low concentrations of glutamate and AMPA, the mean number of conductance states was lower than the calculated mean. Consequently, our data indicate an increase in the number of conductance states present, independent of the fact that at high agonist concentrations there is an increased probability that more than one channel will be open at the same time.
References
- Andrasfalvy BK, Smith MA, Borchardt T, Sprengel R, Magee JC. Impaired regulation of synaptic strength in hippocampal neurons from GluR1-deficient mice. J Physiol. 2003;552:35–45. doi: 10.1113/jphysiol.2003.045575. [DOI] [PMC free article] [PubMed] [Google Scholar]
- Bahn S, Wisden W. A map of non-NMDA receptor subunit expression in the vertebrate brain derived from in situ hybridization histochemistry. In: Monaghan DT, Wenthold RJ, editors. The Ionotropic Glutamate Receptors. Totowa, NJ, USA: Humana Press Inc.; 1997. pp. 149–187. [Google Scholar]
- Banke TG, Bowie D, Lee H, Huganir RL, Schousboe A, Traynelis SF. Control of GluR1 AMPA receptor function by cAMP-dependent protein kinase. J Neurosci. 2000;20:89–102. doi: 10.1523/JNEUROSCI.20-01-00089.2000. [DOI] [PMC free article] [PubMed] [Google Scholar]
- Barbour B. An evaluation of synapse independence. J Neurosci. 2001;21:7969–7984. doi: 10.1523/JNEUROSCI.21-20-07969.2001. [DOI] [PMC free article] [PubMed] [Google Scholar]
- Barria A, Derkach V, Soderling T. Identification of the Ca2+/calmodulin-dependent protein kinase II regulatory phosphorylation site in the alpha-amino-3-hydroxyl-5-methyl-4-isoxazole-propionate-type glutamate receptor. J Biol Chem. 1997;272:32727–32730. doi: 10.1074/jbc.272.52.32727. [DOI] [PubMed] [Google Scholar]
- Bear MF. Homosynaptic long-term depression: a mechanism for memory? Proc Natl Acad Sci U S A. 1999;96:9457–9458. doi: 10.1073/pnas.96.17.9457. [DOI] [PMC free article] [PubMed] [Google Scholar]
- Benke TA, Luthi A, Isaac JT, Collingridge GL. Modulation of AMPA receptor unitary conductance by synaptic activity. Nature. 1998;393:793–797. doi: 10.1038/31709. [DOI] [PubMed] [Google Scholar]
- Benke TA, Luthi A, Palmer MJ, Wikstrom MA, Anderson WW, Isaac JT, Collingridge GL. Mathematical modelling of non-stationary fluctuation analysis for studying channel properties of synaptic AMPA receptors. J Physiol. 2001;537:407–420. doi: 10.1111/j.1469-7793.2001.00407.x. [DOI] [PMC free article] [PubMed] [Google Scholar]
- Bergles DE, Diamond JS, Jahr CE. Clearance of glutamate inside the synapse and beyond. Curr Opin Neurobiol. 1999;9:293–298. doi: 10.1016/s0959-4388(99)80043-9. [DOI] [PubMed] [Google Scholar]
- Bettler B, Egebjerg J, Sharma G, Pecht G, Hermans-Borgmeyer I, Moll C, Stevens CF, Heinemann S. Cloning of a putative glutamate receptor: a low affinity kainate-binding subunit. Neuron. 1992;8:257–265. doi: 10.1016/0896-6273(92)90292-l. [DOI] [PubMed] [Google Scholar]
- Bliss TV, Collingridge GL. A synaptic model of memory: long-term potentiation in the hippocampus. Nature. 1993;361:31–39. doi: 10.1038/361031a0. [DOI] [PubMed] [Google Scholar]
- Bredt DS, Nicoll RA. AMPA receptor trafficking at excitatory synapses. Neuron. 2003;40:361–379. doi: 10.1016/s0896-6273(03)00640-8. [DOI] [PubMed] [Google Scholar]
- Bureau I, Bischoff S, Heinemann SF, Mulle C. Kainate receptor-mediated responses in the CA1 field of wild-type and GluR6-deficient mice. J Neurosci. 1999;19:653–663. doi: 10.1523/JNEUROSCI.19-02-00653.1999. [DOI] [PMC free article] [PubMed] [Google Scholar]
- Clements JD. Transmitter timecourse in the synaptic cleft: its role in central synaptic function. Trends Neurosci. 1996;19:163–171. doi: 10.1016/s0166-2236(96)10024-2. [DOI] [PubMed] [Google Scholar]
- Collingridge GL, Isaac JT, Wang YT. Receptor trafficking and synaptic plasticity. Nat Rev Neurosci. 2004;5:952–962. doi: 10.1038/nrn1556. [DOI] [PubMed] [Google Scholar]
- Colquhoun D, Sigworth FJ. Fitting and statistical analysis of single-channel records. In: Sakmann B, Neher E, editors. Single-channel recording. New York: Plenum; 1995. pp. 483–587. [Google Scholar]
- Cull-Candy SG, Howe JR, Ogden DC. Noise and single channels activated by excitatory amino acids in rat cerebellar granule neurones. J Physiol. 1988;400:189–222. doi: 10.1113/jphysiol.1988.sp017117. [DOI] [PMC free article] [PubMed] [Google Scholar]
- Cull-Candy SG, Usowicz MM. Multiple-conductance channels activated by excitatory amino acids in cerebellar neurons. Nature. 1987;325:525–528. doi: 10.1038/325525a0. [DOI] [PubMed] [Google Scholar]
- Derkach V, Barria A, Soderling TR. Ca2+/calmodulin kinase II enhances channel conductance of alpha-amino-3- hydroxy-5-methyl-4-isoxazolepropionate type glutamate receptors. Proc Natl Acad Sci U S A. 1999;96:3269–3274. doi: 10.1073/pnas.96.6.3269. [DOI] [PMC free article] [PubMed] [Google Scholar]
- Diamond JS, Jahr CE. Transporters buffer synaptically released glutamate on a submillisecond time scale. J Neurosci. 1997;17:4672–4687. doi: 10.1523/JNEUROSCI.17-12-04672.1997. [DOI] [PMC free article] [PubMed] [Google Scholar]
- Diamond JS, Jahr CE. Synaptically released glutamate does not overwhelm transporters on hippocampal astrocytes during high-frequency stimulation. J Neurophysiol. 2000;83:2835–2843. doi: 10.1152/jn.2000.83.5.2835. [DOI] [PubMed] [Google Scholar]
- DiGregorio DA, Nusser Z, Silver RA. Spillover of glutamate onto synaptic AMPA receptors enhances fast transmission at a cerebellar synapse. Neuron. 2002;35:521–533. doi: 10.1016/s0896-6273(02)00787-0. [DOI] [PubMed] [Google Scholar]
- Donevan SD, Beg A, Gunther JM, Twyman RE. The methylglutamate, SYM 2081, is a potent and highly selective agonist at kainate receptors. J Pharmacol Exp Ther. 1998;285:539–545. [PubMed] [Google Scholar]
- Frerking M, Malenka RC, Nicoll RA. Synaptic activation of kainate receptors on hippocampal interneurons. Nat Neurosci. 1998;1:479–486. doi: 10.1038/2194. [DOI] [PubMed] [Google Scholar]
- Frerking M, Nicoll RA. Synaptic kainate receptors. Curr Opin Neurobiol. 2000;10:342–351. doi: 10.1016/s0959-4388(00)00094-5. [DOI] [PubMed] [Google Scholar]
- Herb A, Burnashev N, Werner P, Sakmann B, Wisden W, Seeburg PH. The KA-2 subunit of excitatory amino acid receptors shows widespread expression in brain and forms ion channels with distantly related subunits. Neuron. 1992;8:775–785. doi: 10.1016/0896-6273(92)90098-x. [DOI] [PubMed] [Google Scholar]
- Hestrin S, Nicoll RA, Perkel DJ, Sah P. Analysis of excitatory synaptic action in pyramidal cells using whole-cell recording from rat hippocampal slices. J Physiol. 1990;422:203–225. doi: 10.1113/jphysiol.1990.sp017980. [DOI] [PMC free article] [PubMed] [Google Scholar]
- Hollmann M, Heinemann S. Cloned glutamate receptors. Annu Rev Neurosci. 1994;17:31–108. doi: 10.1146/annurev.ne.17.030194.000335. [DOI] [PubMed] [Google Scholar]
- Howe JR. Homomeric and heteromeric ion channels formed from the kainate-type subunits GluR6 and KA2 have very small, but different, unitary conductances. J Neurophysiol. 1996;76:510–519. doi: 10.1152/jn.1996.76.1.510. [DOI] [PubMed] [Google Scholar]
- Jahr CE, Stevens CF. Glutamate activates multiple single channel conductances in hippocampal neurons. Nature. 1987;325:522–525. doi: 10.1038/325522a0. [DOI] [PubMed] [Google Scholar]
- Jin R, Banke TG, Mayer ML, Traynelis SF, Gouaux E. Structural basis for partial agonist action at ionotropic glutamate receptors. Nat Neurosci. 2003;6:803–810. doi: 10.1038/nn1091. [DOI] [PubMed] [Google Scholar]
- Jonas P. The time course of signaling at central glutamatergic synapses. News Physiol Sci. 2000;15:83–89. doi: 10.1152/physiologyonline.2000.15.2.83. [DOI] [PubMed] [Google Scholar]
- Jonas P, Major G, Sakmann B. Quantal components of unitary EPSCs at the mossy fibre synapse on CA3 pyramidal cells of rat hippocampus. J Physiol. 1993;472:615–663. doi: 10.1113/jphysiol.1993.sp019965. [DOI] [PMC free article] [PubMed] [Google Scholar]
- Jonas P, Sakmann B. Glutamate receptor channels in isolated patches from CA1 and CA3 pyramidal cells of rat hippocampal slices. J Physiol. 1992;455:143–171. doi: 10.1113/jphysiol.1992.sp019294. [DOI] [PMC free article] [PubMed] [Google Scholar]
- Lerma J, Paternain AV, Rodriguez-Moreno A, Lopez-Garcia JC. Molecular physiology of kainate receptors. Physiol Rev. 2001;81:971–998. doi: 10.1152/physrev.2001.81.3.971. [DOI] [PubMed] [Google Scholar]
- Mainen ZF, Malinow R, Svoboda K. Synaptic calcium transients in single spines indicate that NMDA receptors are not saturated. Nature. 1999;399:151–155. doi: 10.1038/20187. [DOI] [PubMed] [Google Scholar]
- Malenka RC, Nicoll RA. Long-term potentiation – a decade of progress? Science. 1999;285:1870–1874. doi: 10.1126/science.285.5435.1870. [DOI] [PubMed] [Google Scholar]
- Misra C, Brickley SG, Farrant M, Cull-Candy SG. Identification of subunits contributing to synaptic and extrasynaptic NMDA receptors in Golgi cells of the rat cerebellum. J Physiol. 2000;524:147–162. doi: 10.1111/j.1469-7793.2000.00147.x. [DOI] [PMC free article] [PubMed] [Google Scholar]
- Momiyama A, Silver RA, Hausser M, Notomi T, Wu Y, Shigemoto R, Cull-Candy SG. The density of AMPA receptors activated by a transmitter quantum at the climbing fibre–Purkinje cell synapse in immature rats. J Physiol. 2003;549:75–92. doi: 10.1113/jphysiol.2002.033472. [DOI] [PMC free article] [PubMed] [Google Scholar]
- Monyer H, Jonas P, Rossier J. Molecular determinants controlling functional properties of AMPARs and NMDARs in the mammalian CNS. In: Jonas P, Monyer H, editors. Ionotropic Glutamate Receptors in the CNS, Handbook of Experimental Pharmacology. Vol. 141. Berlin: Springer; 1999. pp. 309–339. [Google Scholar]
- Mosbacher J, Schoepfer R, Monyer H, Burnashev N, Seeburg PH, Ruppersberg JP. A molecular determinant for submillisecond desensitization in glutamate receptors. Science. 1994;266:1059–1062. doi: 10.1126/science.7973663. [DOI] [PubMed] [Google Scholar]
- Oh MC, Derkach VA. Dominant role of the GluR2 subunit in the regulation of AMPA receptors by CaMKII. Nat Neurosci Nat Neurosci. 2005;8:853–854. doi: 10.1038/nn1476. [DOI] [PubMed] [Google Scholar]
- Piccini A, Malinow R. Critical postsynaptic density 95/disc large/zonula occludens–1 interactions by glutamate receptor 1 (GluR1) and GluR2 required at different subcellular sites. J Neurosci. 2002;22:5387–5392. doi: 10.1523/JNEUROSCI.22-13-05387.2002. [DOI] [PMC free article] [PubMed] [Google Scholar]
- Ritter LM, Vazquez DM, Meador-Woodruff JH. Ontogeny of ionotropic glutamate receptor subunit expression in the rat hippocampus. Brain Res Dev Brain Res. 2002;139:227–236. doi: 10.1016/s0165-3806(02)00572-2. [DOI] [PubMed] [Google Scholar]
- Rosenmund C, Stern-Bach Y, Stevens CF. The tetrameric structure of a glutamate receptor channel. Science. 1998;280:1596–1599. doi: 10.1126/science.280.5369.1596. [DOI] [PubMed] [Google Scholar]
- Shi S, Hayashi Y, Esteban JA, Malinow R. Subunit-specific rules governing AMPA receptor trafficking to synapses in hippocampal pyramidal neurons. Cell. 2001;105:331–343. doi: 10.1016/s0092-8674(01)00321-x. [DOI] [PubMed] [Google Scholar]
- Silver RA, Colquhoun D, Cull-Candy SG, Edmonds B. Deactivation and desensitization of non-NMDA receptors in patches and the time course of EPSCs in rat cerebellar granule cells. J Physiol. 1996;493(1):167–173. doi: 10.1113/jphysiol.1996.sp021372. [DOI] [PMC free article] [PubMed] [Google Scholar]
- Smith TC, Howe JR. Concentration-dependent substate behavior of native AMPA receptors. Nat Neurosci. 2000;3:992–997. doi: 10.1038/79931. [DOI] [PubMed] [Google Scholar]
- Spruston N, Jonas P, Sakmann B. Dendritic glutamate receptor channels in rat hippocampal CA3 and CA1 pyramidal neurons. J Physiol. 1995;482:325–352. doi: 10.1113/jphysiol.1995.sp020521. [DOI] [PMC free article] [PubMed] [Google Scholar]
- Swanson GT, Feldmeyer D, Kaneda M, Cull-Candy SG. Effect of RNA editing and subunit co-assembly single channel properties of recombinant kainate receptors. J Physiol. 1996;492(1):129–142. doi: 10.1113/jphysiol.1996.sp021295. [DOI] [PMC free article] [PubMed] [Google Scholar]
- Swanson GT, Kamboj SK, Cull-Candy SG. Single channel properties of recombinant AMPA receptors depend on RNA editing, splice variation, and subunit composition. J Neurosci. 1997;17:58–69. doi: 10.1523/JNEUROSCI.17-01-00058.1997. [DOI] [PMC free article] [PubMed] [Google Scholar]
- Terashima A, Cotton L, Dev KK, Meyer G, Zaman S, Duprat F, Henley JM, Collingridge GL, Isaac JT. Regulation of synaptic strength and AMPA receptor subunit composition by PICK1. J Neurosci. 2004;24:5381–5390. doi: 10.1523/JNEUROSCI.4378-03.2004. [DOI] [PMC free article] [PubMed] [Google Scholar]
- Traynelis SF, Jaramillo F. Getting the most out of noise in the central nervous system. Trends Neurosci. 1998;21:137–145. doi: 10.1016/s0166-2236(98)01238-7. [DOI] [PubMed] [Google Scholar]
- Traynelis SF, Silver RA, Cull-Candy SG. Estimated conductance of glutamate receptor channels activated during EPSCs at the cerebellar mossy fiber-granule cell synapse. Neuron. 1993;11:279–289. doi: 10.1016/0896-6273(93)90184-s. [DOI] [PubMed] [Google Scholar]
- Wenthold RJ, Petralia RS, Blahos J, II, Niedzielski AS. Evidence for multiple AMPA receptor complexes in hippocampal CA1/CA2 neurons. J Neurosci. 1996;16:1982–1989. doi: 10.1523/JNEUROSCI.16-06-01982.1996. [DOI] [PMC free article] [PubMed] [Google Scholar]
- Wisden W, Seeburg PH. Mammalian ionotropic glutamate receptors. Curr Opin Neurobiol. 1993a;3:291–298. doi: 10.1016/0959-4388(93)90120-n. [DOI] [PubMed] [Google Scholar]
- Wisden W, Seeburg PH. A complex mosaic of high-affinity kainate receptors in rat brain. J Neurosci. 1993b;13:3582–3598. doi: 10.1523/JNEUROSCI.13-08-03582.1993. [DOI] [PMC free article] [PubMed] [Google Scholar]


