Abstract
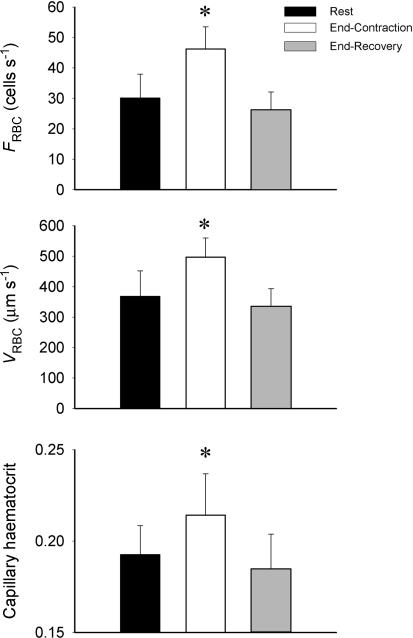
In skeletal muscle capillaries, red blood cell (RBC) flux (FRBC), velocity (VRBC) and haematocrit (HctCAP) are key determinants of microvascular O2 exchange. However, the mechanisms leading to the changes in FRBC, VRBC and HctCAP during muscle contractions and recovery thereafter are not fully understood. To address this issue we used intravital microscopy to investigate the temporal profile of the rat spinotrapezius muscle (n = 5) capillary haemodynamics during recovery from 3 min of twitch muscle contractions (1 Hz, 4–6 V). Specifically, we hypothesized that (1) during early recovery FRBC and VRBC would decrease rapidly and FRBC would display a biphasic response (consistent with a muscle pump effect on capillary haemodynamics), and (2) there would be a dynamic relationship between changes (Δ) in VRBC and HctCAP. The values at rest (R) and end-recovery (ER) were significantly lower (P < 0.05) than at end-contraction (EC) for FRBC (in cells s−1, R = 30.1 ± 7.8, EC = 46.2 ± 7.3 and ER = 26.0 ± 6.1), VRBC (in μm s−1, R = 368 ± 83, EC = 497 ± 62 and ER = 334 ± 59) and HctCAP (R = 0.193 ± 0.016, EC = 0.214 ± 0.023 and ER = 0.185 ± 0.019). The first data point where a significant decrease in FRBC, HctCAP and VRBC occurred was at 5, 5 and 20 s post-contraction, respectively. The decrease in FRBC approximated a monoexponential response (half-time of ∼26 s). The relationship between ΔVRBC and ΔHctCAP was not significant (P > 0.05). Based on the early decrease in FRBC(within 5 s), overall dynamic profile of FRBC and the ∼20 s ‘delay’ to the decrease in VRBC we conclude that the muscle pump does not appear to contribute substantially to the steady-state capillary haemodynamics in the contracting rat spinotrapezius muscle. Moreover, our findings suggest that alterations in VRBC do not obligate proportional changes in HctCAP within individual capillaries following muscle contractions.
Several mechanisms have been proposed to explain the skeletal muscle hyperaemia during exercise including the muscle pump, nitric oxide and endothelium-derived hyperpolarizing factor (for review see Clifford & Hellsten, 2004; Tschakovsky & Sheriff, 2004). Currently, the role of the muscle pump in the exercise hyperaemia remains controversial (Sheriff, 2005; Clifford et al. 2005).
The key microcirculatory variables that influence O2 exchange are red blood cell flux (FRBC), velocity (VRBC) and capillary haematocrit (HctCAP). In the microcirculation, the biphasic increase in FRBC following the onset of contractions is associated with a rapid increase in VRBC (within 2 s) to values similar to, or greater than, the steady state (Kindig et al. 2002). These results suggested a prominent role of the muscle pump or some very rapid vasodilatory process on skeletal muscle capillary haemodynamics (i.e. FRBC, VRBC and HctCAP). However, the mechanisms controlling FRBC, VRBC and HctCAP during recovery from exercise remain elusive. Qualitatively similar to the onset of exercise, the recovery dynamics of estimated capillary blood flow (equivalent to FRBC) displayed an initial fast decrease (half-time, t0.5, ∼6.5 s) followed by a slower response (t0.5∼21 s) (Ferreira et al. 2005a). However, these estimated responses relied on only one variable (∼FRBC) and a set of assumptions that limit their interpretation (Ferreira et al. 2005a,b). In this context, insights into the potential effect of the muscle pump on skeletal muscle capillary haemodynamics (steady state and recovery) could be gained by determining, concurrently, the time course of FRBC, VRBC and HctCAP after cessation of contractions.
During the steady state of muscle contractions there is an ∼25–30% increase in HctCAP (Klitzman & Duling, 1979; Kindig et al. 2002) that is thought to stem from arteriolar vasodilatation (Desjardins & Duling, 1990) and increases in VRBC (Duling et al. 1982; Desjardins & Duling, 1987, 1990). These suggestions are based on observations made during steady-state contractions (Klitzman & Duling, 1979) or during pharmacologically induced vasodilatation (Desjardins & Duling, 1990). If the increase in HctCAP with contractions is a consequence of an elevated VRBC, we would expect a positive (linear or non-linear) relationship between ΔVRBC and ΔHctCAP. Moreover, this relationship would be maintained during the steady state and recovery from contractions when physiologically induced changes in both HctCAP and VRBC occur.
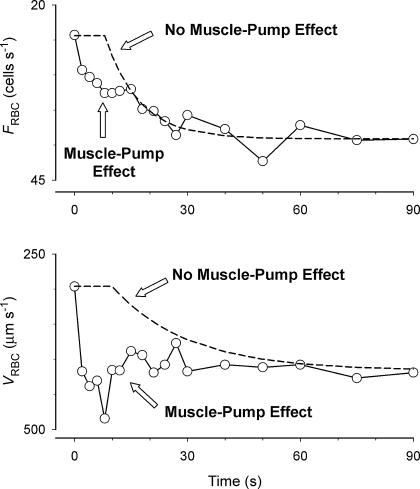
In the present study we examined, for the first time, the temporal profile of skeletal muscle capillary haemodynamics (FRBC, VRBC and HctCAP) following the cessation of muscle contractions to elucidate the potential role of the muscle pump on capillary hyperaemia and the effects of changes in VRBC on HctCAP during muscle contractions. Assuming that there is a time delay to the decrease in arteriolar diameter following the cessation of muscle contractions (Gorczynski & Duling, 1978; Bearden et al. 2004) and that the muscle pump imparts mechanical energy affecting VRBC and FRBC with a rapid on–off time course, we hypothesize that the muscle pump effect on capillary hyperaemia would be manifested by a rapid decrease in VRBC and a biphasic response of FRBC (fast decrease followed by slower dynamics), which is analogous (but directionally opposite) to the onset of exercise (see Fig. 1 and Kindig et al. 2002). Regarding the factor(s) determining the increase in HctCAP with contractions, we hypothesized that following the cessation of muscle contractions there would be a dynamic relationship between changes in VRBC and HctCAP, suggesting a mechanistic association between these variables as previously proposed (Duling et al. 1982).
Methods
Animals
Experiments were performed in seven female Sprague-Dawley rats (279 ± 6 g). The focal plane could not be maintained over the entire 3 min of recovery from muscle contractions in two animals therefore capillary haemodynamics data were collected in five animals. Upon completion of the experimental procedures the animals were killed with an overdose of pentobarbital sodium. The study was approved by the Institutional Animal Care and Use Committee at Kansas State University.
Muscle preparation
The procedures used in the current study were described in detail by Kindig et al. (2002). Briefly, animals were anaesthetized (pentobarbital sodium 40 mg kg−1 i.p. to effect) and their right carotid artery cannulated for measurement of blood pressure and heart rate (Digi-Medical BPA model 200, Louisville, KY, USA). The rat was placed on a circulation-heated (38°C) Lucite platform and the left spinotrapezius muscle was exteriorized, sutured at five equidistant positions to a thin wire horseshoe and superfused continuously with a Krebs-Henseleit bicarbonate-buffered solution equilibrated with 5% CO2−95% N2. The remaining exposed tissue was kept moist and covered with Saran wrap (Dow, Indianapolis, IN, USA). Importantly, this surgical procedure preserves the spinotrapezius microvascular blood flow compared to the intact muscle (Bailey et al. 2000). A microvascular field typically containing 6–10 capillaries was selected and muscle sarcomere length set at ∼2.7 μm, as confirmed by on-screen measurements. Thereafter, twitch muscle contractions were induced (1 Hz, 4–6 V, 2 ms pulse duration) for 3 min and the same microvascular field was followed for 3 min after cessation of muscle contractions. This stimulation protocol has been shown to result in an increase in blood flow of ∼2–3 times the resting value (Behnke et al. 2001) and has the advantage of not inducing fatigue, as determined by maintenance of initial tension development for up to 10 min (D. C. Poole, T. I. Musch & S. A. Hahn, unpublished observations).
Image aquisition and analysis
Images were obtained by bright-field microscopy (Eclipse E600-FN, Nikon; ×40 objective; numerical aperture, 0.8) and recorded at 30 frames per second on super-VHS cassettes (BR-S822 U, JVC, Elmwood Park, NJ, USA) for off-line analysis. The super-VHS tapes were played back and the recorded microvascular fields (270 μm × 210 μm) viewed on a high-resolution monitor (Trinitron PVM-1954Q, Sony, Ichinoniya, Japan). Final magnification was ×1184, as verified by calibration with a stage micrometer.
For each microvascular field we identified capillaries in which haemodynamic measurements could be made during the time periods of interest (see below) over the 3 min of recovery and randomly selected five capillaries per muscle (on one muscle the focal plane limited measurements to four capillaries). Based on this criterion capillaries not supporting RBC flow at rest were not excluded from the study a priori; however, reflecting the fact that the vast majority of capillaries are flowing at rest all capillaries examined supported RBC flow prior to the onset of muscle contractions and continued to do so during and following cessation of contractions (see Results). At the end of muscle contractions capillary diameter (DiaCAP) was measured at three sites along the capillary length for those capillaries in which haemodynamics were assessed. Red blood cell velocity (VRBC) and capillary haematocrit (HctCAP) were assessed over several frames within a 1 s time window (30 frames). Measurements were made twice within 30 s prior to the onset of contractions (rest, R), within ∼16 frames (Kindig et al. 2002) after the microvascular field resumed its focus subsequent to the last contraction (end-contraction, EC) and at 5, 10, 15, 20, 25, 30, 40, 50, 60, 90, 120 and 180 s (end-recovery, ER). Based on preliminary measurements we determined that this sampling strategy would be sufficient to address the primary hypotheses of our study (L. F. Ferreira, D. J. Padilla & D. C. Poole, unpublished observations). VRBC was determined by following the RBC path length over a period of time (determined from total number of frames). The number of RBCs within a capillary was determined by tracing individual RBCs over an average capillary length of approximately 120 μm. VRBC and number of RBCs were usually measured within the same frames; however, on some occasions this was not possible and measurements of VRBC and RBC spacing were then performed on the closest possible frames. Capillary haematocrit was then calculated as HctCAP= (NRBC× VolRBC)/[π× (DiaCAP/2)2× capillary length], where NRBC is number of RBCs and VolRBC is RBC volume. Red blood cell flux was calculated as FRBC=[HctCAP×π× (DiaCAP/2)2×VRBC]/VolRBC. For these calculations we assumed that capillaries were circular in cross-section and VolRBC= 61 μm3 (Altman & Dittmer, 1974). The methods used in this study to calculate HctCAP and FRBC have been validated theoretically (Cokelet, 1974) and empirically (Sarelius & Duling, 1982). To determine the percentage of capillaries supporting RBC flow we observed the microvascular field at R (during 15 s prior to the onset of contractions), EC and ER. Capillaries not containing RBCs or with stagnant RBCs during the 15 s of rest prior to contractions, 15 frames after the last contraction (see above) and within a 1 s window (30 frames) at EC were considered as not supporting RBC flow. The number of capillaries supporting RBC flow was multiplied by 100 and divided by the total number of capillaries within the microvascular field (i.e. percentage of capillaries supporting RBC flow).
Data analysis
The normalcy of the data was tested by the Kolmogorov-Smirnov test. The comparison of means was performed with one-way repeated-measures ANOVA and post hoc analyses were conducted with the Holm-Sidak test (SigmaStat 3.0, Systat Software, Richmond, CA, USA). Changes in VRBC and HctCAP induced by muscle contractions were determined in each capillary by subtracting the resting values from post-contraction data (1–180 s). The relationship between variables was examined with linear regression (SigmaPlot 7.01, Systat Software). For all tests significance was accepted when P≤ 0.05. The coefficient of variation for VRBC was determined for R, EC and ER as CV = (s.d. × 100)/mean. All data are presented as mean ± s.e.m.
Results
Systemic cardiovascular variables did not change significantly from EC to ER (mean arterial pressure, 104 ± 8 versus 105 ± 9 mmHg; heart rate, 284 ± 19 versus 282 ± 20 beats min−1, respectively; P > 0.05 for both). Mean capillary diameter was 5.7 ± 0.1 μm.
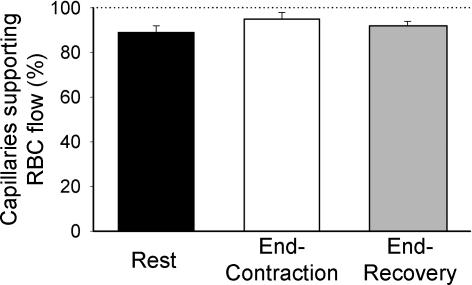
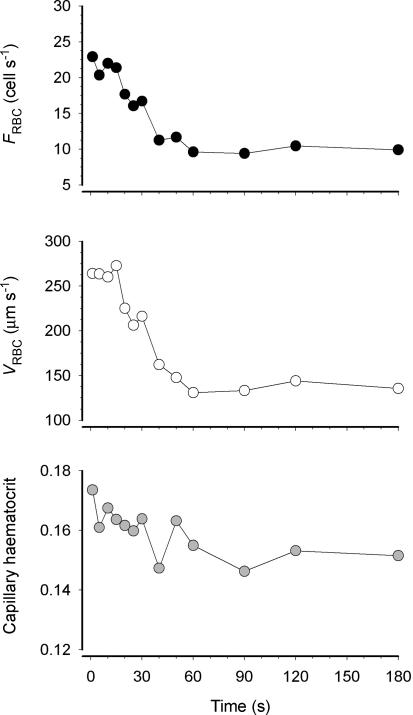
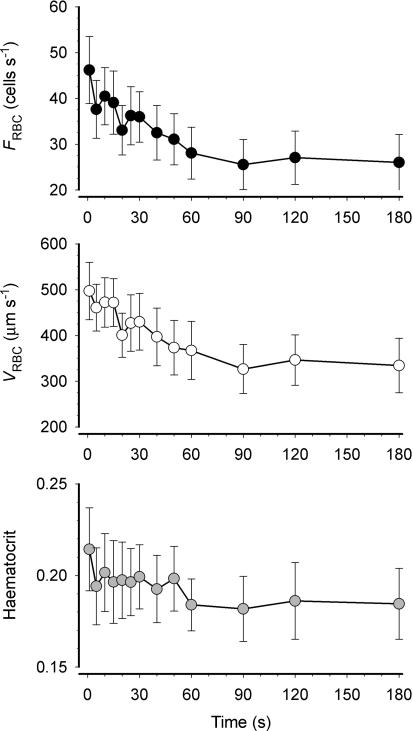
We observed that the vast majority of capillaries supported RBC flow at R, EC and ER (Fig. 2). VRBC, FRBC and HctCAP increased significantly with contractions (P≤ 0.05) and recovered to resting values at 180 s post-contraction (Fig. 3). The increase in FRBC (∼50%) with contractions was greater than that of VRBC (∼35%), which accounts mathematically for the increase in HctCAP (Fig. 3). The Kolmogorov-Smirnov test showed a normal distribution of VRBC at R, ER and EC. The temporal profile of VRBC, FRBC and HctCAP during recovery from contractions for a representative muscle (5 capillaries) is shown in Fig. 4. It is compelling that there is little (FRBC) or no (VRBC) decrease in these variables for 20 s following cessation of contractions. Figure 5 depicts the mean data for FRBC, VRBC and HctCAP of five microvascular fields (24 capillaries) measured over 3 min of recovery from contractions. FRBC decreased significantly at 5 s compared to EC and subsequently displayed a progressive decrease. VRBC did not change significantly up to 15–20 s and decreased significantly thereafter reaching a steady state ∼90 s post-contraction. The values for HctCAP were significantly lower at 5 s compared to EC (i.e. 1 s, Fig. 5, bottom panel) and showed no further decrease until 60 s into recovery; however, the difference between 50 and 60 s was of borderline significance (P = 0.056).
Figure 2.
Percentage of capillaries supporting red blood cell (RBC) flow at rest, end-contraction and end-recovery. Note that most capillaries contain moving RBCs at rest, during muscle contractions and after 3 min of recovery. Thus, ‘capillary recruitment’ does not appear to be an important mechanism by which the muscle pump increases skeletal muscle blood flow during contractions.
Figure 3.
Capillary red blood cell velocity (VRBC), flux (FRBC) and haematocrit in 5 microvascular fields (24 capillaries). *Significantly (P < 0.05) different from Rest and End-Recovery.
Figure 4.
Temporal profile of red blood cell velocity (VRBC), flux (FRBC) and capillary haematocrit (HctCAP) for a representative animal (mean of 5 capillaries).
Figure 5.
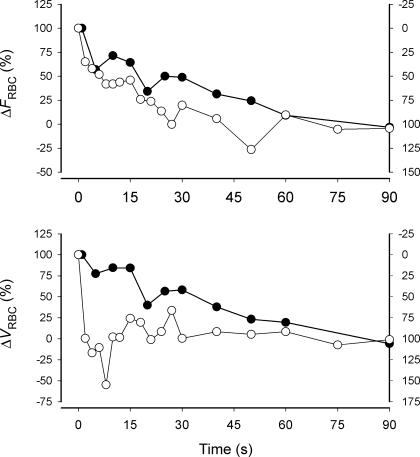
Temporal profile of red blood cell flux (FRBC), velocity (VRBC) and capillary haematocrit (HctCAP) during recovery from contractions for 5 muscles (total of 24 capillaries). FRBC was decreased at 5 s compared to end-contraction (P < 0.05 versus 1 s) and the half-time of recovery of mean FRBC was ∼26 s. VRBC remained relatively constant up to 15 s after cessation of muscle contractions (P > 0.05 versus 1 s) and decreased thereafter achieving a steady state at ∼90 s (half-time ∼30 s). HctCAP at 5 s was significantly lower than end-contraction (1 s); however, HctCAP did not appear to decrease further until 50–60 s after the last contraction.
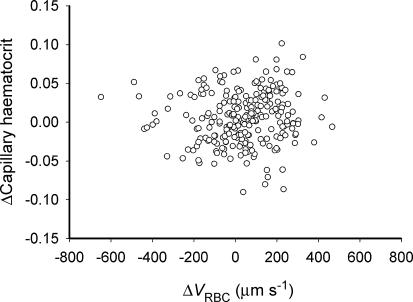
There was little dynamic association between ΔHctCAP and ΔVRBC (P > 0.05, Fig. 6), which suggests that changes in VRBC had no simple or proportional effect on the alterations of HctCAP that occurred following muscle contractions. Notably, there was a marked heterogeneity of changes in HctCAP from R to EC where ΔHctCAP varied from −21% to 49% of the pre-contraction value. Similarly, there was a heterogeneous distribution of VRBC and the degree of heterogeneity, assessed by the coefficient of variation, was not significantly different (P > 0.05) when comparing R (40.0 ± 2.0%), EC (43.4 ± 5.2%) and ER (49.6 ± 6.7%).
Figure 6.
Relationship between changes (Δ) in capillary haematocrit (HctCAP) and red blood cell velocity (VRBC) during recovery from muscle contraction over each measured interval (from 1 to 180 s; n = 4) for each capillary studied. Some capillaries displayed a sustained (i.e. until 180 s post-contraction) decrease in VRBC and HctCAP below pre-contraction values while others showed only a temporary decrease compared to the pre-contraction state.
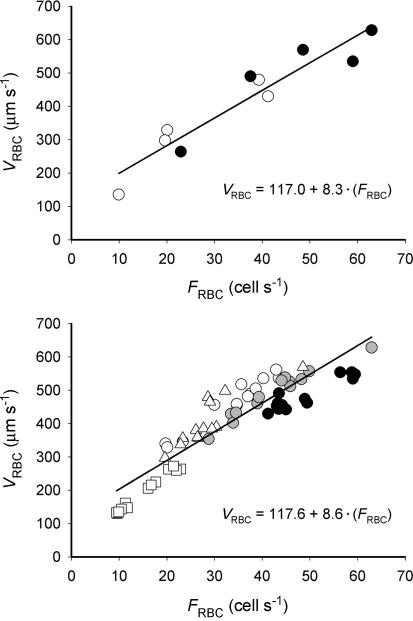
To further examine the association between microcirculatory variables we determined the relationship between means of VRBC and FRBC. This analysis demonstrated a significant (P≤ 0.05) relationship with similar slopes and intercepts when analysing the steady state (EC and ER, Fig. 7, top panel) and dynamic recovery from EC to ER (Fig. 7, bottom panel).
Figure 7.
Mean capillary red blood cell velocity (VRBC) and flux (FRBC) during recovery from muscle contractions (from 1 to 180 s). Upper panel shows the steady-state relationship (•, end-contraction; ○, end-recovery) for each animal. Lower panel depicts the dynamic association between VRBC and FRBC from end-contraction to end-recovery. Symbols represent each individual muscle studied. For both panels the continuous line denotes the linear regression.
Discussion
Two principal novel findings arise from the present study. First, we observed that FRBC decreased by ∼25% of the overall response within 5 s of the last muscle contraction with a temporal profile that approximated a monoexponential response whilst VRBC showed a ‘delay’ of ∼20 s before a significant decrease was observed. Thus, our concurrent analysis of FRBC and VRBC argues against a substantial muscle pump effect on capillary haemodynamics at the steady state and early recovery of muscle contractions (see Figs 1 and 8). Secondly, dynamic changes in HctCAP within individual capillaries during contractions were dissociated from changes in VRBC measured at the steady state and during recovery from exercise.
Figure 1.
Schematic hypothesized representation of capillary red blood cell flux (FRBC) and velocity (VRBC) during recovery from muscle contractions in the presence (circles) or absence (dashed lines) of a muscle pump effect on capillary hyperaemia. Open circles: ‘mirror image’ of data from Kindig et al. (2002) for capillary haemodynamics following the onset of exercise. Note that the y-axis was modified to be visually equivalent to the profiles expected during recovery from contractions. Dashed lines: theoretical representation assuming a delay before the onset of changes in arteriolar diameter (Gorczynski & Duling, 1978; Bearden et al. 2004).
Figure 8.
Changes (Δ) in FRBC and VRBC after the onset (○; right y-axis) and end of muscle contractions (•; left y-axis). The data are normalized for the amplitude of the response at 90 s (percentage change) and the right y-axes are modified to produce a ‘mirror image’ of the onset of contractions (Kindig et al. 2002) as for Fig. 1.
Muscle contractions and (lack of) ‘capillary recruitment’
The opinion is widely held that many skeletal muscle capillaries do not support RBC flux at rest and are recruited (i.e. support RBC flux) during contractions. If true, one could hypothesize that the muscle pump facilitates the increase in ‘capillary recruitment’ and this phenomenon would help explain the increased muscle O2 diffusing capacity seen during exercise (see ‘Capillary gas exchange’). However, there is compelling experimental evidence in intact conscious animals (Hudlicka et al. 1982; Kayar & Banchero, 1985) and a variety of individual muscles examined by intravital microscopy (Poole et al. 1997; Kindig & Poole, 1998, 2001; Kindig et al. 1999, 2002) that the overwhelming majority of capillaries do support RBC flux (i.e. flow) at rest. Consistent with these studies, we observed that ∼90% of capillaries supported RBC flow at rest with no significant change during the steady state of contractions and at the end of recovery (Fig. 2) refuting the idea that the muscle pump could facilitate flow in stagnant capillaries (i.e. capillary recruitment). Moreover, the absence of ‘capillary recruitment’ raises the probability that the bulk of the increased capillary O2 diffusing capacity in exercising muscle comes from a combination of: (i) a better utilization of capillary surface area along the length of individual capillaries, in part due to exercise-induced elevation of tube haematocrit (and thus RBC-to-capillary surface contact) and also increasing the capillary length over which O2 is exchanged, and (ii) intramyocyte effects that act to increase intracellular diffusivity as myoglobin becomes progressively more O2 desaturated (Honig et al. 1997).
Temporal profile of recovery of capillary haemodynamics
The overall time course of FRBC measured directly in skeletal muscle capillaries (Fig. 5) is in close agreement with two previous investigations of the dynamics of recovery of muscle microvascular blood flow after cessation of exercise (Lash, 1994; Ferreira et al. 2005a). The recovery of FRBC approximated an exponential profile with a t0.5 of ∼26 s (Fig. 5). Based on the relationship between t0.5 of recovery of blood flow and contraction frequency (Fig. 4 in Lash, 1994), we estimate that the t0.5 of recovery of blood flow to resting levels in feed arteries of spinotrapezius muscle after 1 Hz contractions (as used here) was ∼28 s (Lash, 1994). For exercising humans the dynamics of vastus lateralis muscle microvascular blood flow (estimated) during recovery from cycling exercise at 1 Hz (60 r.p.m.) had a t0.5 of ∼25 s (Ferreira et al. 2005a). Thus, the recovery of rat spinotrapezius muscle hyperaemia measured in capillaries appears to have a similar time course to that measured in ‘larger’ vessels (Lash, 1994) and human muscles (Ferreira et al. 2005a). The recovery dynamics of FRBC were 140% slower (i.e. t0.5 off/on ∼2.4; Fig. 8) than the kinetics of FRBC following the onset of muscle contractions (t0.5∼11 s; Kindig et al. 2002). These data confirm the on–off asymmetry of O2 delivery kinetics (Barstow et al. 1990; Yoshida & Whipp, 1994; McDonough et al. 2001), which implies that different mechanisms may be involved in the blood flow response following the onset and recovery from exercise.
The mechanisms controlling skeletal muscle hyperaemia during contractions and subsequent recovery have yet to be fully discriminated (Clifford & Hellsten, 2004; Tschakovsky & Sheriff, 2004). While there appears to be solid evidence for the participation of nitric oxide (Hirai et al. 1994; Shoemaker et al. 1997), prostaglandins (Shoemaker et al. 1996) and adenosine (Kille & Klabunde, 1984) in this process, the flow-enhancing effect of the muscle pump is more controversial (Laughlin, 1987; Lutjemeier et al. 2005; Valic et al. 2005; Sheriff, 2005; Clifford et al. 2005). The recovery from exercise has been used to tease out the potential effect of the muscle pump on the steady state of hyperaemia (Van Leeuwen et al. 1992; Lutjemeier et al. 2005; Ferreira et al. 2005a). In our study, the similar overall dynamics of FRBC and VRBC during recovery from contractions might support the hypothesis that the muscle pump contributes to the steady state of capillary haemodynamics. However, assuming that there is a time delay (∼10 s) to the onset of recovery of arteriolar diameter towards its pre-contraction state (Gorczynski & Duling, 1978; Bearden et al. 2004) we reasoned that, analogous to the onset of muscle contractions (Fig. 1 and Kindig et al. 2002), a rapid decrease in VRBC and FRBC plus a biphasic profile of FRBC (i.e. dynamics of VRBC faster than that of FRBC) would be considered evidence for the muscle pump effect on blood flow during the steady state of exercise. Thus, the ∼15 s latency to the decrease in VRBC and the close to monoexponential profile of FRBC with only a small decrease at 5 s (Fig. 5) argue against a major role for the muscle pump effect on the spinotrapezius muscle capillary hyperaemia during the steady state of contractions. At first glance these results appear to disagree with data suggesting the presence of the muscle pump during exercise in humans (Van Leeuwen et al. 1992; Lutjemeier et al. 2005), running dogs (Sheriff et al. 1993) and rats (Sheriff, 2003), and in the spinotrapezius muscle (Kindig et al. 2002). However, it is important to consider differences in exercise protocols and integrate results from previous studies to help explain our findings.
The effect of the muscle pump has been demonstrated during the steady state of upright exercise (Shiotani et al. 2002; Lutjemeier et al. 2005), while it is assumed that during supine exercise (or with limbs above the level of the heart; Tschakovsky et al. 1996) and electrically stimulated contractions the muscle pump effect is either less pronounced or non-existent (Laughlin, 1987; Shiotani et al. 2002; Tschakovsky & Sheriff, 2004). The spinotrapezius muscle preparation used in our study approximates more closely isotonic small muscle mass exercise of light-to-moderate intensity (i.e. no change in MAP; Lutjemeier et al. 2005) in the supine position with the limbs at or above the level of the heart (Shoemaker et al. 1996). Under these conditions, as for upright exercise or limbs below the level of the heart, the kinetics of blood flow following the onset of contractions still displayed an early rapid increase (e.g. Shoemaker et al. 1996; Kindig et al. 2002) that is thought to be determined predominantly, but not exclusively (Hamann et al. 2003; Tschakovsky et al. 2004; VanTeeffelen & Segal, 2005), by the muscle pump (Sheriff et al. 1993; Sheriff, 2003). Consistent with this notion, the very rapid increase in VRBC (1–2 s) and FRBC (within one contraction), with a 15–18 s delay to the increase in HctCAP following the onset of contractions provides strong evidence for the presence of a muscle pump effect in the spinotrapezius muscle (for a detailed discussion see Kindig et al. 2002). However, it is relevant to consider that the muscle pump effect is not seen when contractions are performed with the muscle in a vasodilated state (Dobson & Gladden, 2003; Hamann et al. 2003). Therefore, reconciling the skeletal muscle capillary haemodynamics following the onset (Kindig et al. 2002) and recovery from exercise (present study), we propose that the blood flow-enhancing effect of the muscle pump is present early during muscle contractions and progressively disappears as contractions are repeated and vasodilatation proceeds (Gorczynski & Duling, 1978; Dobson & Gladden, 2003; Hamann et al. 2003) such that the muscle pump does not contribute to sustaining the steady state of capillary hyperaemia in the spinotrapezius muscle (present data). In this setting, the muscle pump contributes to the rapid kinetics of FRBC (and VRBC) following the onset of exercise while the absence of the muscle pump after cessation of contractions permits a slow recovery of FRBC such that there is a surplus of O2 delivery during both transitional phases of exercise thereby elevating/maintaining microvascular O2 pressures (PO2) and therefore O2 availability across the exercise transients (Behnke et al. 2001; McDonough et al. 2001).
Capillary gas exchange
The variables examined in this study (FRBC, VRBC and HctCAP) are key components of the gas exchange properties of the microcirculation (Federspiel & Popel, 1986; Tsai & Intaglietta, 1989). FRBC provides an excellent representation of convective O2 delivery (Berg & Sarelius, 1996) having a crucial role in determining the microvascular PO2, which is the pressure head driving O2 movement from blood to muscle. VRBC will determine the RBC transit time in muscle capillaries and in the presence of fast VRBC there is an increased likelihood of RBCs with transit times that are short enough to compromise gas exchange (Sarelius, 1986; Piiper & Scheid, 1999). On the other hand, slow VRBC in the microcirculation may be associated with arteriolar O2 loss (or venular oxygenation) (Swain & Pittman, 1989; Pittman, 2000) that will result in a diminished mean capillary PO2. Therefore, assuming that capillary and arteriolar VRBC are related variables the ∼15 s where capillary VRBC remained elevated after cessation of contractions (Figs 4 and 5) may favourably affect gas exchange by maintaining an increased mean capillary PO2, although the possibility for short transit times counterbalancing this effect cannot be ignored.
The low diffusivity of O2 in plasma determines that the principal pathway for myocyte O2 delivery is in close proximity to the RBC. In this context, blood–myocyte O2 transfer is thought to be dependent upon the number of RBCs within the capillaries adjacent to the myocytes. Consistent with this notion, HctCAP (or RBC number per capillary length) is an important determinant of the O2 diffusing capacity (DO2 from Fick's law of diffusion) and therefore O2 transport (Federspiel & Popel, 1986; Tsai & Intaglietta, 1989). The decrease in HctCAP within 5 s post-contractions, consequent to a faster initial decrease in FRBC than VRBC, may contribute to a lower DO2 early into recovery. Although the changes in HctCAP appear to be small they become relevant when considering the heterogeneity of changes in HctCAP within the microvascular field (e.g. Fig. 6). It is worth noting that the DO2 of capillaries with high haematocrits (or small decrease in HctCAP after contractions) may not compensate for the decreased DO2 of capillaries with low haematocrits (or large changes in HctCAP post-contraction). Therefore, it is crucial to understand what factors determine HctCAP and the possible causes of HctCAP heterogeneity within muscles.
Relationship between microvascular variables (FRBC, VRBC and HctCAP)
The mechanisms determining a HctCAP that is lower than systemic values have not been fully elucidated. There are studies demonstrating the partial roles of (1) the network Fahraeus effect (i.e. at bifurcations the increase in haematocrit of high-flow branches is smaller than the decrease in HctCAP of low-flow branches) (Pries et al. 1986), and (2) the presence of the glycocalyx on the capillary endothelial surface creating a stationary or relatively slow-moving RBC-free layer (Desjardins & Duling, 1990) that has been termed the capillary Fahraeus effect (VRBC faster than plasma velocity).
The network Fahraeus effect can be altered according to VRBC heterogeneity, where less heterogeneity would lead to higher HctCAP (Frisbee, 1998). At bifurcations RBCs tend to enter high-flow branches increasing the HctCAP. However, the decrease in HctCAP of low-flow branches is not compensated by the increased HctCAP of capillaries with fast velocities leading to a lower microvascular than systemic haematocrit (Fahraeus network effect; Pries et al. 1986). Thus, lower VRBC heterogeneity would be accompanied by less difference between high- and low-flow branches causing an overall increase in HctCAP. Some studies have shown a decrease in VRBC heterogeneity with muscle contractions (Tyml & Cheng, 1995) while others suggest no change (Damon & Duling, 1985) or an increase (Kindig et al. 2002). In the present study we observed no significant change in the CV (used as an index of heterogeneity) for VRBC when comparing R, EC and ER while HctCAP at EC was ∼15% greater than at R and ER (up to 49% for individual capillaries). Collectively these observations disagree with suggestions that the network Fahraeus effect is an important determinant of the increase in HctCAP induced by muscle contractions (Frisbee, 1998).
It has been proposed that the thickness of the slow-moving RBC-free layer can be affected by VRBC, with a decrease in thickness resulting from increases in VRBC (i.e. shear rate) (Duling et al. 1982; Pries et al. 1997). This implies that there is an association between ΔVRBC and ΔHctCAP; however, in the present investigation such a relationship was not found (Fig. 6). Therefore, the mechanisms determining changes in HctCAP with muscle contraction remain to be elucidated. In this context, we must consider whether HctCAP is an independent or a dependent variable that changes as a consequence of alterations in other variables (possibly FRBC and VRBC).
A remarkable feature of capillary haemodynamics is the close-to-linear relationship between VRBC and FRBC (Fig. 7; Kindig et al. 1998, 1999; Kindig & Poole, 2001; Russell et al. 2003). Analysing the mathematical description of HctCAP where
(see definition of variables above), it becomes apparent that for constant VolRBC and DiaCAP, HctCAP is proportional to the FRBC/VRBC ratio. The relationship between VRBC and FRBC has an intercept different from zero, meaning that upon alterations in FRBC and VRBC the ratio of FRBC-to-VRBC, and therefore HctCAP, does not remain constant. As mentioned above, early into exercise the increase in VRBC is faster than the dynamics of FRBC such that the relationship between VRBC and FRBC is temporarily disrupted (i.e. increase in VRBC and FRBC with no change in HctCAP in the first ∼20 s of contractions), which may reflect the transient muscle pump effect on capillary haemodynamics. Interestingly, the relationship between VRBC and FRBC in resting muscles is similar in health and disease. Specifically, conditions that perturb muscle microvascular control such as type I diabetes (Kindig et al. 1998), heart failure (Kindig et al. 1999) and ageing (Russell et al. 2003) do not appear to alter HctCAP substantially. Thence, changes in HctCAP with muscle contractions (Fig. 3) appear to be a consequence of disproportionate alterations in the control of FRBC and VRBC. We observed a similar relationship between VRBC and FRBC across steady-state conditions (EC, ER; Fig. 7, upper panel), which resembles those from previous studies (Kindig et al. 1998, 1999; Russell et al. 2003), and recovery from muscle contractions (Fig. 7, lower panel). Therefore, changes in HctCAP during the steady state and recovery from exercise may occur as a consequence of mechanisms affecting VRBC and FRBC (e.g. shear stress and vasodilatation) rather than HctCAPper se.
Methodological aspects
Kindig et al. (2002) presented a detailed discussion of the methodological considerations relevant for extrapolation of our results to the microcirculation of conscious spontaneously exercising animals and muscles other than the spinotrapezius. Briefly, these relate to the effects of anaesthesia, muscle recruitment during electrical stimulation and the anatomical characteristics of the spinotrapezius muscle. In our study, anaesthesia could have blunted a sympathetic vasoconstriction and prolonged the recovery of cardiovascular responses after cessation of muscle contractions. However, the stimulation protocol employed in the current study does not have a direct effect on sympathetic nerves (Honig, 1979) and elicits contractions with metabolic rates similar to exercise of moderate intensity where there is negligible sympathetic activation (Saito et al. 1993). Moreover, the t0.5 of FRBC was similar to that seen in conscious humans (Ferreira et al. 2005a). Thus, anaesthesia had little or no effects on our results.
Despite differences in muscle recruitment patterns of spontaneous versus electrically induced contractions, the temporal profile of muscle hyperaemia represented by FRBC following the onset (Kindig et al. 2002) and recovery from contractions (present study) is similar to that reported for moderate exercise in humans (Shoemaker et al. 1996; Lutjemeier et al. 2005). Although differences may exist when compared to estimated responses (Ferreira et al. 2005a), these are not thought to result from the muscle recruitment pattern itself (see above). Finally, the temporal profile of capillary haemodynamics following the onset of exercise (Kindig et al. 2002), which indicates the presence of the muscle pump, suggests that the spinotrapezius muscle is useful for examining the effects of the muscle pump or vasodilatation/vasoconstriction of very rapid onset on capillary hyperaemia.
Conclusion
In summary, the present investigation demonstrates that the decrease in red blood cell velocity becomes evident only 20 s after the end of contractions while red blood cell flux and capillary haematocrit decrease within 5 s of cessation of muscle contractions, but only a small percentage of the final response. Based on the close-to-monoexponential response of recovery of red blood cell flux and the ‘delay’ to the decrease in red blood cell velocity we consider that the muscle pump does not contribute substantially to the steady state of capillary hyperaemia in the spinotrapezius muscle. The slower dynamics of red blood cell flux during recovery (t0.5∼ 26 s) compared to the onset of contractions (t0.5∼ 11 s) confirms theoretical (Barstow et al. 1990) and empirical data (McDonough et al. 2001; Ferreira et al. 2005a) indicating on–off asymmetry for the kinetics of O2 delivery in the microcirculation. With regard to the mechanisms determining capillary haematocrit, our findings suggest that changes in capillary haematocrit during muscle contractions may not be mechanistically linked to changes in red blood cell velocity.
Acknowledgments
We would like to thank K. Sue Hageman for invaluable technical assistance and Drs Thomas Barstow, Brad Behnke and Paul McDonough for insightful conversations. L. F. Ferreira was supported by a Fellowship from the Ministry of Education/Capes, Brazil. This investigation was supported, in part, by grants from the NIH (HL-69739, HL-67619, HL-50306 and AG-19228) and a grant-in-aid from AHA, Heartland Affiliate, to D. C. Poole.
References
- Altman PL, Dittmer DS. Biology Data Book. Bethesda, MD: Federation of American Societies for Experimental Biology; 1974. [Google Scholar]
- Bailey JK, Kindig CA, Behnke BJ, Musch TI, Schmid-Schoenbein GW, Poole DC. Spinotrapezius muscle microcirculatory function: effects of surgical exteriorization. Am J Physiol. 2000;279:H3131–H3137. doi: 10.1152/ajpheart.2000.279.6.H3131. [DOI] [PubMed] [Google Scholar]
- Barstow TJ, Lamarra N, Whipp BJ. Modulation of muscle and pulmonary O2 uptakes by circulatory dynamics during exercise. J Appl Physiol. 1990;68:979–989. doi: 10.1152/jappl.1990.68.3.979. [DOI] [PubMed] [Google Scholar]
- Bearden SE, Payne GW, Chisty A, Segal SS. Arteriolar network architecture and vasomotor function with ageing in mouse gluteus maximus muscle. J Physiol. 2004;561:535–545. doi: 10.1113/jphysiol.2004.068262. [DOI] [PMC free article] [PubMed] [Google Scholar]
- Behnke BJ, Kindig CA, Musch TI, Koga S, Poole DC. Dynamics of microvascular oxygen pressure across the rest-exercise transition in rat skeletal muscle. Respir Physiol. 2001;126:53–63. doi: 10.1016/s0034-5687(01)00195-5. [DOI] [PubMed] [Google Scholar]
- Berg BR, Sarelius IH. Erythrocyte flux in capillary networks during maturation: implications for oxygen delivery. Am J Physiol. 1996;271:H2263–H2273. doi: 10.1152/ajpheart.1996.271.6.H2263. [DOI] [PubMed] [Google Scholar]
- Clifford PS, Hamann JJ, Valic Z, Buckwalter JB. Counterpoint: The muscle pump is not an important determinant of muscle blood flow during exercise. J Appl Physiol. 2005;99:372–374. [PubMed] [Google Scholar]
- Clifford PS, Hellsten Y. Vasodilatory mechanisms in contracting skeletal muscle. J Appl Physiol. 2004;97:393–403. doi: 10.1152/japplphysiol.00179.2004. [DOI] [PubMed] [Google Scholar]
- Cokelet GR. Experimental determination of the average hematocrit of blood flowing in a vessel. Microvasc Res. 1974;7:382–384. doi: 10.1016/0026-2862(74)90026-0. [DOI] [PubMed] [Google Scholar]
- Damon DH, Duling BR. Evidence that capillary perfusion heterogeneity is not controlled in striated muscle. Am J Physiol. 1985;249:H386–H392. doi: 10.1152/ajpheart.1985.249.2.H386. [DOI] [PubMed] [Google Scholar]
- Desjardins C, Duling BR. Microvessel hematocrit: measurement and implications for capillary oxygen transport. Am J Physiol. 1987;252:H494–H503. doi: 10.1152/ajpheart.1987.252.3.H494. [DOI] [PubMed] [Google Scholar]
- Desjardins C, Duling BR. Heparinase treatment suggests a role for the endothelial cell glycocalyx in regulation of capillary hematocrit. Am J Physiol. 1990;258:H647–H654. doi: 10.1152/ajpheart.1990.258.3.H647. [DOI] [PubMed] [Google Scholar]
- Dobson JL, Gladden LB. Effect of rhythmic tetanic skeletal muscle contractions on peak muscle perfusion. J Appl Physiol. 2003;94:11–19. doi: 10.1152/japplphysiol.00339.2002. [DOI] [PubMed] [Google Scholar]
- Duling BR, Sarelius IH, Jackson WF. A comparison of microvascular estimates of capillary blood flow with direct measurements of total striated muscle flow. Int J Microcirc Clin Exp. 1982;1:409–424. [PubMed] [Google Scholar]
- Federspiel WJ, Popel AS. A theoretical analysis of the effect of the particulate nature of blood on oxygen release in capillaries. Microvasc Res. 1986;32:164–189. doi: 10.1016/0026-2862(86)90052-x. [DOI] [PMC free article] [PubMed] [Google Scholar]
- Ferreira LF, Harper AH, Townsend DK, Lutjemeier BJ, Barstow TJ. Kinetics of estimated muscle capillary blood flow during recovery from exercise. Exp Physiol. 2005a;90:715–726. doi: 10.1113/expphysiol.2005.030189. [DOI] [PubMed] [Google Scholar]
- Ferreira LF, Townsend DK, Lutjemeier BJ, Barstow TJ. Muscle capillary blood flow kinetics estimated from pulmonary O2 uptake and near-infrared spectroscopy. J Appl Physiol. 2005b;98:1820–1828. doi: 10.1152/japplphysiol.00907.2004. [DOI] [PubMed] [Google Scholar]
- Frisbee JC. Striated muscle microvascular hematocrit: the increase from rest to contraction. Microvasc Res. 1998;55:184–186. doi: 10.1006/mvre.1998.2070. [DOI] [PubMed] [Google Scholar]
- Gorczynski RJ, Duling BR. Role of oxygen in arteriolar functional vasodilation in hamster striated muscle. Am J Physiol. 1978;235:H505–H515. doi: 10.1152/ajpheart.1978.235.5.H505. [DOI] [PubMed] [Google Scholar]
- Hamann JJ, Valic Z, Buckwalter JB, Clifford PS. Muscle pump does not enhance blood flow in exercising skeletal muscle. J Appl Physiol. 2003;94:6–10. doi: 10.1152/japplphysiol.00337.2002. [DOI] [PubMed] [Google Scholar]
- Hirai T, Visneski MD, Kearns KJ, Zelis R, Musch TI. Effects of NO synthase inhibition on the muscular blood flow response to treadmill exercise in rats. J Appl Physiol. 1994;77:1288–1293. doi: 10.1152/jappl.1994.77.3.1288. [DOI] [PubMed] [Google Scholar]
- Honig CR. Contributions of nerves and metabolites to exercise vasodilation: a unifying hypothesis. Am J Physiol. 1979;236:H705–H719. doi: 10.1152/ajpheart.1979.236.5.H705. [DOI] [PubMed] [Google Scholar]
- Honig CR, Gayeski TE, Groebe K. Myoglobin and oxygen gradients. In: Crystal RG, West JB, Barnes PJ, editors. The Lung: Scientific Foundations. 2. Philadelphia: Lippincott–Raven Publishers; 1997. pp. 1925–1933. [Google Scholar]
- Hudlicka O, Zweifach BW, Tyler KR. Capillary recruitment and flow velocity in skeletal muscle after contractions. Microvasc Res. 1982;23:201–213. doi: 10.1016/0026-2862(82)90065-6. [DOI] [PubMed] [Google Scholar]
- Kayar SR, Banchero N. Sequential perfusion of skeletal muscle capillaries. Microvasc Res. 1985;30:298–305. doi: 10.1016/0026-2862(85)90061-5. [DOI] [PubMed] [Google Scholar]
- Kille JM, Klabunde RE. Adenosine as a mediator of postcontraction hyperemia in dog gracilis muscle. Am J Physiol. 1984;246:H274–H282. doi: 10.1152/ajpheart.1984.246.2.H274. [DOI] [PubMed] [Google Scholar]
- Kindig CA, Musch TI, Basaraba RJ, Poole DC. Impaired capillary hemodynamics in skeletal muscle of rats in chronic heart failure. J Appl Physiol. 1999;87:652–660. doi: 10.1152/jappl.1999.87.2.652. [DOI] [PubMed] [Google Scholar]
- Kindig CA, Poole DC. A comparison of the microcirculation in the rat spinotrapezius and diaphragm muscles. Microvasc Res. 1998;55:249–259. doi: 10.1006/mvre.1998.2075. [DOI] [PubMed] [Google Scholar]
- Kindig CA, Poole DC. Sarcomere length-induced alterations of capillary hemodynamics in rat spinotrapezius muscle: vasoactive vs passive control. Microvasc Res. 2001;61:64–74. doi: 10.1006/mvre.2000.2284. [DOI] [PubMed] [Google Scholar]
- Kindig CA, Richardson TE, Poole DC. Skeletal muscle capillary hemodynamics from rest to contractions: implications for oxygen transfer. J Appl Physiol. 2002;92:2513–2520. doi: 10.1152/japplphysiol.01222.2001. [DOI] [PubMed] [Google Scholar]
- Kindig CA, Sexton WL, Fedde MR, Poole DC. Skeletal muscle microcirculatory structure and hemodynamics in diabetes. Respir Physiol. 1998;111:163–175. doi: 10.1016/s0034-5687(97)00122-9. [DOI] [PubMed] [Google Scholar]
- Klitzman B, Duling BR. Microvascular hematocrit and red cell flow in resting and contracting striated muscle. Am J Physiol. 1979;237:H481–H490. doi: 10.1152/ajpheart.1979.237.4.H481. [DOI] [PubMed] [Google Scholar]
- Lash JM. Contribution of arterial feed vessels to skeletal muscle functional hyperemia. J Appl Physiol. 1994;76:1512–1519. doi: 10.1152/jappl.1994.76.4.1512. [DOI] [PubMed] [Google Scholar]
- Laughlin MH. Skeletal muscle blood flow capacity: role of muscle pump in exercise hyperemia. Am J Physiol. 1987;253:H993–H1004. doi: 10.1152/ajpheart.1987.253.5.H993. [DOI] [PubMed] [Google Scholar]
- Lutjemeier BJ, Miura A, Scheuermann BW, Koga S, Townsend DK, Barstow TJ. Muscle contraction–blood flow interactions during upright knee extension exercise in humans. J Appl Physiol. 2005;98:1575–1583. doi: 10.1152/japplphysiol.00219.2004. [DOI] [PubMed] [Google Scholar]
- McDonough P, Behnke BJ, Kindig CA, Poole DC. Rat muscle microvascular PO2 kinetics during the exercise off-transient. Exp Physiol. 2001;86:349–356. doi: 10.1113/eph8602192. [DOI] [PubMed] [Google Scholar]
- Piiper J, Scheid P. Modeling oxygen availability to exercising muscle. Respir Physiol. 1999;118:95–101. doi: 10.1016/s0034-5687(99)00082-1. [DOI] [PubMed] [Google Scholar]
- Pittman RN. Oxygen supply to contracting skeletal muscle at the microcirculatory level: diffusion vs. convection. Acta Physiol Scand. 2000;168:593–602. doi: 10.1046/j.1365-201x.2000.00710.x. [DOI] [PubMed] [Google Scholar]
- Poole DC, Musch TI, Kindig CA. In vivo microvascular structural and functional consequences of muscle length changes. Am J Physiol. 1997;272:H2107–H2114. doi: 10.1152/ajpheart.1997.272.5.H2107. [DOI] [PubMed] [Google Scholar]
- Pries AR, Ley K, Gaehtgens P. Generalization of the Fahraeus principle for microvessel networks. Am J Physiol. 1986;251:H1324–H1332. doi: 10.1152/ajpheart.1986.251.6.H1324. [DOI] [PubMed] [Google Scholar]
- Pries AR, Secomb TW, Jacobs H, Sperandio M, Osterloh K, Gaehtgens P. Microvascular blood flow resistance: role of endothelial surface layer. Am J Physiol. 1997;273:H2272–H2279. doi: 10.1152/ajpheart.1997.273.5.H2272. [DOI] [PubMed] [Google Scholar]
- Russell JA, Kindig CA, Behnke BJ, Poole DC, Musch TI. Effects of aging on capillary geometry and hemodynamics in rat spinotrapezius muscle. Am J Physiol. 2003;285:H251–H258. doi: 10.1152/ajpheart.01086.2002. [DOI] [PubMed] [Google Scholar]
- Saito M, Tsukanaka A, Yanagihara D, Mano T. Muscle sympathetic nerve responses to graded leg cycling. J Appl Physiol. 1993;75:663–667. doi: 10.1152/jappl.1993.75.2.663. [DOI] [PubMed] [Google Scholar]
- Sarelius IH. Cell flow path influences transit time through striated muscle capillaries. Am J Physiol. 1986;250:H899–H907. doi: 10.1152/ajpheart.1986.250.6.H899. [DOI] [PubMed] [Google Scholar]
- Sarelius IH, Duling BR. Direct measurement of microvessel hematocrit, red cell flux, velocity, and transit time. Am J Physiol. 1982;243:H1018–H1026. doi: 10.1152/ajpheart.1982.243.6.H1018. [DOI] [PubMed] [Google Scholar]
- Sheriff D. Point: The muscle pump raises muscle blood flow during locomotion. J Appl Physiol. 2005;99:371–372. doi: 10.1152/japplphysiol.00381.2005. [DOI] [PubMed] [Google Scholar]
- Sheriff DD. Muscle pump function during locomotion: mechanical coupling of stride frequency and muscle blood flow. Am J Physiol. 2003;284:H2185–H2191. doi: 10.1152/ajpheart.01133.2002. [DOI] [PubMed] [Google Scholar]
- Sheriff DD, Rowell LB, Scher AM. Is rapid rise in vascular conductance at onset of dynamic exercise due to muscle pump? Am J Physiol. 1993;265:H1227–H1234. doi: 10.1152/ajpheart.1993.265.4.H1227. [DOI] [PubMed] [Google Scholar]
- Shiotani I, Sato H, Sato H, Yokoyama H, Ohnishi Y, Hishida E, Kinjo K, Nakatani D, Kuzuya T, Hori M. Muscle pump-dependent self-perfusion mechanism in legs in normal subjects and patients with heart failure. J Appl Physiol. 2002;92:1647–1654. doi: 10.1152/japplphysiol.01096.2000. [DOI] [PubMed] [Google Scholar]
- Shoemaker JK, Halliwill JR, Hughson RL, Joyner MJ. Contributions of acetylcholine and nitric oxide to forearm blood flow at exercise onset and recovery. Am J Physiol. 1997;273:H2388–H2395. doi: 10.1152/ajpheart.1997.273.5.H2388. [DOI] [PubMed] [Google Scholar]
- Shoemaker JK, Naylor HL, Pozeg ZI, Hughson RL. Failure of prostaglandins to modulate the time course of blood flow during dynamic forearm exercise in humans. J Appl Physiol. 1996;81:1516–1521. doi: 10.1152/jappl.1996.81.4.1516. [DOI] [PubMed] [Google Scholar]
- Swain DP, Pittman RN. Oxygen exchange in the microcirculation of hamster retractor muscle. Am J Physiol. 1989;256:H247–H255. doi: 10.1152/ajpheart.1989.256.1.H247. [DOI] [PubMed] [Google Scholar]
- Tsai AG, Intaglietta M. Local tissue oxygenation during constant red blood cell flux: a discrete source analysis of velocity and hematocrit changes. Microvasc Res. 1989;37:308–322. doi: 10.1016/0026-2862(89)90049-6. [DOI] [PubMed] [Google Scholar]
- Tschakovsky ME, Rogers AM, Pyke KE, Saunders NR, Glenn N, Lee SJ, Weissgerber T, Dwyer EM. Immediate exercise hyperemia in humans is contraction intensity dependent: evidence for rapid vasodilation. J Appl Physiol. 2004;96:639–644. doi: 10.1152/japplphysiol.00769.2003. [DOI] [PubMed] [Google Scholar]
- Tschakovsky ME, Sheriff DD. Immediate exercise hyperemia: contributions of the muscle pump vs. rapid vasodilation. J Appl Physiol. 2004;97:739–747. doi: 10.1152/japplphysiol.00185.2004. [DOI] [PubMed] [Google Scholar]
- Tschakovsky ME, Shoemaker JK, Hughson RL. Vasodilation and muscle pump contribution to immediate exercise hyperemia. Am J Physiol. 1996;271:H1697–H1701. doi: 10.1152/ajpheart.1996.271.4.H1697. [DOI] [PubMed] [Google Scholar]
- Tyml K, Cheng L. Heterogeneity of red blood cell velocity in skeletal muscle decreases with increased flow. Microcirculation. 1995;2:181–193. doi: 10.3109/10739689509146766. [DOI] [PubMed] [Google Scholar]
- Valic Z, Buckwalter JB, Clifford PS. Muscle blood flow response to contraction: influence of venous pressure. J Appl Physiol. 2005;98:72–76. doi: 10.1152/japplphysiol.00151.2004. [DOI] [PubMed] [Google Scholar]
- Van Leeuwen BE, Barendsen GJ, Lubbers J, de Pater L. Calf blood flow and posture: Doppler ultrasound measurements during and after exercise. J Appl Physiol. 1992;72:1675–1680. doi: 10.1152/jappl.1992.72.5.1675. [DOI] [PubMed] [Google Scholar]
- VanTeeffelen JW, Segal SS. Rapid dilation of arterioles with single contraction of hamster skeletal muscle. Am J Physiol. 2005;290:H119–H127. doi: 10.1152/ajpheart.00197.2005. [DOI] [PubMed] [Google Scholar]
- Yoshida T, Whipp BJ. Dynamic asymmetries of cardiac output transients in response to muscular exercise in man. J Physiol. 1994;480:355–359. doi: 10.1113/jphysiol.1994.sp020365. [DOI] [PMC free article] [PubMed] [Google Scholar]


