

Abstract
Glucagon is one of the major hormonal regulators of glucose metabolism, counteracting the hepatic effects of insulin when the concentration of glucose in the bloodstream falls below a certain level. Glucagon also regulates bile flow, hepatocellular volume and membrane potential of hepatocytes. It is clear that changes in cell volume and membrane potential cannot occur without significant ion fluxes across the plasma membrane. The effects of glucagon on membrane currents in hepatocytes, however, are not well understood. Here we show, by patch-clamping of rat hepatocytes, that glucagon activates two types of currents: a small inwardly rectifying Ca2+ current with characteristics similar to those of the store-operated Ca2+ current and a larger outwardly rectifying Cl− current similar to that activated by cell swelling. We show that the mechanism of glucagon action on membrane conductance involves phospholipase C and adenylyl cyclase. Contribution of the adenylyl cyclase-dependent pathway to activation of the currents depended on Epac (exchange protein directly activated by cAMP), but not on protein kinase A. The activation of Ca2+ and Cl− channels is likely to play a key role in the mechanisms by which glucagon regulates hepatocyte metabolism and volume.
Stimulation of hepatic glucose output when the concentration of glucose in the blood is low is one of the main physiological roles of glucagon. It is well established that, acting through G-protein-coupled receptors on the hepatocyte plasma membrane, glucagon activates glycogenolysis and gluconeogenesis, while inhibiting glycolysis and glycogenesis, thus providing a mechanism to counteract the effects of insulin (for review see Jiang & Zhang, 2003). In addition to its role in regulating hepatic glucose output, glucagon is known to enhance bile flow and increase the bicarbonate concentration in bile in humans and other animal species (Alvaro et al. 1995; Tanaka et al. 2003) and to regulate hepatocellular volume (Lang et al. 1998). These processes are likely to involve significant glucagon-induced ion movements across the plasma membrane (Graf & Haussinger, 1996). Early electrophysiological studies suggested that glucagon causes membrane hyperpolarization in rat hepatocytes (Graf & Petersen, 1978; Friedmann & Dambach, 1980). However, knowledge of effects of glucagon on ion fluxes across the hepatocyte plasma membrane is limited.
It is universally accepted that the primary pathway of glucagon action involves the activation of Gαs, leading to activation of adenylyl cyclase, an increase in intracellular levels of cAMP, and activation of protein kinase A (PKA; Jiang & Zhang, 2003). The contribution of a second pathway which involves activation of Gq and phospholipase C (PLC), resulting in accumulation of inositol 1,4,5-trisphosphate (IP3) and increased cytoplasmic Ca2+ concentration ([Ca2+]i), remains contentious (Morand et al. 1988; Mine et al. 1993; Burcelin et al. 1996). Several studies have shown that glucagon can have effects independent of increases of the intracellular concentration of cAMP and that these effects are likely to be mediated by elevations in [Ca2+]i (Birnbaum & Fain, 1977; Heyworth & Houslay, 1983; Heyworth et al. 1983). While the observation that glucagon stimulates production of IP3 in rat hepatocytes supports this notion, the levels of IP3 produced by stimulation of hepatocytes with glucagon are significantly lower than those produced by stimulation with vasopressin (Wakelam et al. 1986). The results of some studies have suggested that glucagon might increase [Ca2+]i through a cAMP-dependent mechanism (Combettes et al. 1986; Kass et al. 1994) and that Ca2+ is essential for regulation of glycogenolysis by cAMP (Kraus-Friedmann & Feng, 1996). Thus, while there is reasonable evidence to indicate that glucagon increases IP3 and [Ca2+]i in hepatocytes, and that Ca2+ is required for some of the actions of glucagon, the ‘Ca2+ pathway’ in the mechanism of glucagon action is not well understood.
In the present work we investigate the effects of glucagon on membrane conductance of rat hepatocytes using the patch-clamping technique in whole-cell and perforated-patch configurations. It was found that in rat hepatocytes glucagon activates Ca2+ current with characteristics similar to those of the store-operated Ca2+ current (ISOC) activated by ATP and vasopressin in these cells (Rychkov et al. 2005) and Cl− current similar to that activated by cell swelling (Moore et al. 2002). The results show that the mechanism of the glucagon response involves adenylyl cyclase and phospholipase C. Interestingly, the adenyl cyclase and cAMP-dependent pathway did not involve PKA, the main target for cAMP, but involved Epac (exchange protein directly activated by cAMP; de Rooij et al. 1998). This is the first demonstration that glucagon activates Ca2+ and Cl− currents in rat hepatocytes.
Methods
Cells
For the preparation of isolated primary hepatocytes, fed male hooded Wistar rats were anaesthetized with an intraperitoneal injection of Nembutal (pentobarbitone, 60 mg kg−1 body mass) and surgically prepared for liver perfusion. After cannulation of the portal vein, the liver was perfused in situ for 15 min in the presence of collagenase, and hepatocytes isolated as previously described (Berry et al. 1991). After Nembutal injection the animals did not recover consciousness, and were killed by cannulation of the liver. Isolated hepatocytes were resuspended in Dulbecco's modified Eagle's medium (DMEM) (Invitrogen Australia, Mt Waverley, VIC, Australia) supplemented with penicillin (100 units ml−1), streptomycin (100 μg ml−1), 10 mm Hepes (pH 7.4), 1% BSA (Sigma, St Louis, MO, USA), 100 nm insulin (Sigma) and 1 μm dexamethasone (Sigma) and plated on glass coverslips at 37°C in 5% (v/v) CO2 in air for 4 h. Culture medium was replaced after 4 h with DMEM supplemented with penicillin (100 units ml−1), streptomycin (100 μg ml−1), 10% (v/v) fetal bovine serum (FBS; Trace, Melbourne, Australia), 2 mml-glutamine (Sigma) and 0.1 mm non-essential amino acid solution (Invitrogen Australia), and cells were incubated further for 24–48 h before patch clamping.
Rats used in the present study were housed in a 12 h daylight climate-controlled environment; nevertheless, during summer time (December–March in the southern hemisphere) hepatocytes from most preparations generally were less amenable for patch-clamping studies. The reasons for the observed seasonal variation were not investigated, and the results presented here were obtained during the cooler months of the year.
Electrophysiology
Whole-cell patch clamping was performed at room temperature using a computer-based patch-clamp amplifier (EPC-9, HEKA Electronics, Lambrecth Germany) and PULSE software (HEKA Electronics). The control bath solution contained (mm): NaCl, 140; CsCl, 4; CaCl2, 10; MgCl2, 2; glucose, 10; and Hepes, 10; adjusted to pH 7.4 with NaOH. Solutions containing lower Ca2+ concentration were prepared by replacing CaCl2 in the control solution with MgCl2 on an equimolar basis. Bath solution with low Na+ was prepared by replacing 140 mm of NaCl in the control solution with 140 mm NMDG chloride. Bath solution with low Cl− was prepared by replacing 140 mm NaCl with 140 mm sodium glutamate. Isotonic bath solution for studies of volume-regulated Cl− channels was prepared by replacing 50 mm NaCl in control solution with 100 mm sucrose, while in the hypotonic solution sucrose was omitted. In experiments investigating Ba2+ conductance in rat hepatocytes, 130 mm NaCl and 10 mm CaCl2 in the control bath solution were substituted by 100 mm BaCl2. The pipette solution used in whole-cell experiments contained (mm): CsCl, 15; caesium glutamate, 135; CaCl2, 0.5; MgATP, 6; EGTA, 1; and Hepes, 10; adjusted to pH 7.2 with NaOH. In some experiments, 10 mm EGTA was used in the above pipette solution with no Ca2+ added. The pipette solution used in perforated-patch experiments contained (mm): CsCl, 15; caesium glutamate, 140; CaCl2, 1; MgCl2, 1; Hepes, 10; and 100 μg ml−1 amphotericin B (solubilized form, Sigma); adjusted to pH 7.2 with NaOH. A stock solution of amphotericin B (50 mg ml−1) was prepared in DMSO every week and stored at 4°C. An aliquot of stock solution was added to the pipette solution to give a final amphotericin B concentration of 100 μg ml−1. Pipette solution with amphotericin B was sonicated for 20 s, and used within 2 h. Patch pipettes were pulled from borosilicate glass and fire polished; pipette resistance ranged between 3 and 4 MΩ. Series resistance in whole-cell configuration did not exceed 20 MΩ and was 50–70% compensated. In perforated-patch experiments the recording started when the series resistance dropped below 20 MΩ. In order to monitor changes in the amplitude of the membrane currents, voltage ramps between −138 and +102 mV were applied every 2 s. Acquired currents were filtered at 2.7 kHz and sampled at 10 kHz. Liquid junction potential for the solutions used varied between −16 and −20 mV (estimated by JPCalc; Barry, 1994), and the correction of −18 mV was applied to all voltages shown. The holding potential was −18 mV throughout. Cell capacitance of hepatocytes used in this study varied between 35 and 90 pF and was compensated for automatically by the EPC-9 amplifier. The results are expressed as the means ± s.e.m.
Chemicals
Unless specified, all compounds were supplied by Sigma (St Louis, MO, USA). Stock solution of glucagon was prepared in 5% acetic acid and freshly diluted in bath solution as required. H-89 (N-[2-(p-bromocinnamylamino)ethyl]-5-isoquinolinesulphona-mide dihydrochloride), NPPB (5-nitro-2-(3-phenyl-propylamino)benzoic acid (RBI, Natick, MA, USA), Rp-cAMPS (RP-adenosine-3′,5′-cyclic monophospho-thioate), des-His1-[Glu9]glucagon amide, U73122 (1-(6-((17β-3-methoxyestra-1,3,5(10)-trien-17-yl)amino)hexyl)-1H-pyrrole-2,5-dione) and U73343 (1-(6-((17β-3-methoxyestra-1,3,5(10)-trien-17-yl)amino)hexyl)-2,5-pyrrolidinedione) were all diluted in DMSO and then prepared for use in bath solution so that the final concentration of DMSO did not exceed 0.1%. Stock solutions of cAMP, 8-pCPT-2′-O-Me-cAMP (8-(4-chloro-phenylthio)-2′-O-methyladenosine-3′,5′-cyclic mono-phosphate), and 6-Bnz-cAMP (N6-benzoyla-denosine-3′,5′-cyclic monophosphate; BIOLOG Life Science Institute, Bremen, Germany) were prepared in H2O and the required amounts were added to the appropriate pipette solution prior to use.
Data analysis
To extract the maximal amplitude of the inward current after full development in response to glucagon (Imax) and the time to half-maximal activation of the current (τ50), the amplitude of the inward current at −118 mV was plotted against time and fitted by the following equation:
| (1) |
where Imin is the amplitude of the baseline current before addition of glucagon and k is the slope factor. Slope factor k is used as a measure of the rate of the current development (smaller k means a steeper curve and a higher rate).
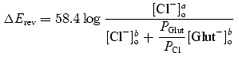
The Goldman–Hodgkin–Katz equation of the form:
 |
(2) |
has been used to calculate the permeability of glutamate relative to Cl− (PGlut/PCl); where ΔErev was the shift of the reversal potential when 168 mm of Cl− in the external solution ([Cl−]ao) was replaced with 140 mm of glutamate ([Glut−]bo), and [Cl−]bo was the remaining Cl− concentration.
Results
Glucagon activates an outwardly rectifying current in rat hepatocytes
All the experiments presented in this work were performed in whole-cell and then repeated in perforated-patch configuration to ensure that the intracellular perfusion in whole-cell mode did not interfere with the mechanisms of glucagon response. In the perforated-patch configuration, the background conductance present before the addition of glucagon did not change throughout the experiment, whereas in whole-cell configuration the background conductance was smaller and decreased with time. Nevertheless, qualitatively, the results obtained by both techniques were the same.
Glucagon applied to the bath (1–250 nm) activated an outwardly rectifying membrane current in rat hepatocytes. Results for perforated-patch and whole-cell configurations are shown in Fig. 1A and B. The development of the current started after a 20–40 s delay, and fit of eqn (1) to the experimental data in Fig. 1A and B showed that time to the half-maximal activation for both the outward and the inward current was significantly shorter (P < 0.05) in the perforated-patch (110 ± 4 and 130 ± 4 s, respectively; n = 5) compared to the whole-cell experiments (187 ± 6 and 220 ± 7 s, respectively; n = 15). The inward current developed more slowly than the outward, and this difference was clearer when I–V plots obtained at different time points of the glucagon response were compared (Fig. 1C). These results suggested that the current activated by glucagon was carried by at least two different types of ion channels. To ensure that the effect of glucagon on membrane conductance was due to specific receptor binding, a selective antagonist of the glucagon receptor, des-His1-[Glu9]glucagon amide, was used (Post et al. 1993). When added alone to rat hepatocytes, the antagonist did not activate any measurable membrane conductance (Fig. 1D), while pretreatment of hepatocytes with the antagonist prevented activation of any current by glucagon (Fig. 1E).
Figure 1. Effect of glucagon on membrane conductance in rat hepatocytes.

A and B show the time course of the development of the inward and outward current in response to glucagon (10 nm) in perforated-patch (A, n = 5) and whole-cell experiments (B, n = 15). Current amplitudes were taken from the responses to the voltage ramps at −118 and +82 mV for the inward and the outward current, respectively, normalized to the cell capacitance and plotted against time. Application of glucagon is indicated by a horizontal bar. C, examples of the I–V plots obtained in response to voltage ramps between −138 and +102 mV before application of glucagon (trace 1, see A), at the beginning of the glucagon response (trace 2), and when the currents are fully developed (trace 3). D, lack of effect of the glucagon receptor antagonist des-His1[Glu9]-glucagon amide (50 nm) on membrane conductance (n = 8). E, inhibition of the glucagon response (50 nm) by des-His1[Glu9]-glucagon amide (50 nm; •; representative cell, n = 5). For comparison, a response to glucagon (50 nm) is shown in a representative cell from the same preparation (○).
After full activation by glucagon, the amplitude of the currents declined with time to the baseline levels (5–15 min), irrespective of whether or not glucagon was present in the bath (not shown). A second application of glucagon, even after a 20 min wash, failed to activate any current in most cells. In a small minority of cells (∼5%) where current was activated a second time, it was significantly smaller than the one activated by the first application of glucagon. Similar results were obtained in perforated-patch mode, which eliminates possible wash-out of the intracellular components as an explanation for the failure of the second application of glucagon to activate the current, and suggests desensitization of the glucagon receptor.
Ca2+ and Cl− channels are activated by glucagon
Ion substitution was used to investigate the nature of channels underlying the response to glucagon. Since the internal solution contained Cs+ in place of all K+, the outward current could be carried either by Cs+ passing out through non-selective cation channels or by Cl− moving in through anion channels. Reduction of the Cl− concentration in the external solution from 168 to 28 mm resulted in a drastic reduction of the outward current and a shift of the reversal potential to more positive values (Fig. 2A), suggesting that most of the outward conductance activated by glucagon was due to the inward movement of Cl−. Replacement of 140 mm NaCl in the control bath solution with 140 mm sodium glutamate resulted in an average shift in the current reversal potential of 34 ± 3 mV (n = 4), which corresponds to permeability of glutamate relative to Cl− (PGlut/PCl) of ∼0.11 (eqn (2)). A non-selective anion channel blocker, NPPB (50 μm), completely blocked outward current activated by glucagon (not shown), which confirms the notion that this current is carried through Cl− channels.
Figure 2. Effects of ion substitution on glucagon-activated conductance.

A, effect of Cl− replacement in the external solution with an equimolar amount of glutamate on the outward current shown in a representative cell (n = 5). B, effect of replacement of Na+ in the external solution with NMDG+ on inward current shown in a representative cell (n = 4). NMDG+ was perfused both before and after development of the glucagon response.
Since the pipette solution contained 16 mm Cl−, some part of the inward current activated by glucagon was carried by Cl− moving out of the cell. The contribution of cations to the inward current was determined by substitution of Na+ or Ca2+ in the bath solution. Replacement of Na+ in the external solution with NMDG+ had little effect on the inward current activated by glucagon (Fig. 2B). Although there was some reduction in inward current amplitude when Na+ was replaced by the larger cation, the absolute magnitude of that reduction was the same before and after application of glucagon, suggesting that glucagon does not activate Na+ channels or non-selective cation channels (Fig. 2B).
Replacement of Ca2+ in the external solution with an equimolar amount of Mg2+ resulted in a decline of both inward and outward currents (Fig. 3A). Upon readmission of Ca2+, there was rapid increase in the inward current amplitude of about 1 pA pF−1 (Fig. 3A, indicated by arrow), while outward current increased gradually. These results suggested that there is a Ca2+ component in the inward current, and that activation of Cl− current required the presence of Ca2+. This Ca2+ component of the inward current could be clearly identified when Cl− conductance activated by glucagon declined to a baseline level. Removal of Ca2+ at this point resulted in a decrease of the inward current by ∼1 pA pF−1, while the outward current remained mainly unchanged (Fig. 3B).
Figure 3. Effects of removal of extracellular Ca2+ and addition of La3+ on the currents activated by glucagon.

A and B show the effect of removal of Ca2+ from the external solution on both the inward and outward currents at early (A) and late stages (B) of the glucagon response shown in a representative cell (n = 5). CaCl2 was replaced with MgCl2. Arrow shows the point when Ca2+ was added back to the bath. C, inhibition of the glucagon response by La3+ shown in a representative cell (n = 8).
Application of 1 μm La3+ in the bath also led to inhibition of both the inward and the outward current (Fig. 3C). More detailed analysis of the time course of the La3+ block showed that the onset of the effect on the inward current was almost instantaneous, and that the inward current amplitude diminished in two phases: fast and slow (Fig. 4A). In contrast, block of the outward current occurred with a 5–10 s delay and followed a single exponential function. These results provide further evidence that glucagon activates two types of channels, namely Ca2+ and Cl−, and suggest that the inward current induced by glucagon is largely due to activation of Ca2+ channels, while activation of the Cl− channels is Ca2+ dependent. The presence of a glucagon-activated Ca2+ current is also consistent with the observation that 10% of all cells that responded developed only the inward current after addition of glucagon (not shown). In these cells, the outward current either did not change or declined.
Figure 4. Separation of the currents inhibited by La3+.

A, time course of La3+ block (results similar to those in Fig. 3C are shown using an expanded time scale). Marks 1, 2 and 3 correspond to time points before application of La3+, just after application of La3+ when only inward current is blocked, and after the complete development of the block, respectively. B, the I–V plots of the currents recorded before addition of La3+ (trace 1), at 10 s (trace 2) and at 90 s (trace 3) after La3+ addition (cf. corresponding numbers in A). Inset shows currents around the reversal potential. C, the I–V plot of the current blocked by La3+ within first 5–10 s (obtained by subtraction of trace 2 from trace 1 shown in B). D, the same current as in C, but recorded in response to a voltage step to −138 mV. E, the I–V plot of the current inhibited by La3+ between 10 and 120 s of application (obtained by subtraction of trace 3 from trace 2 shown in B).
Since inhibition of the outward current by La3+ was 10–15 s later in onset than the block of the inward current, it was possible to obtain relatively ‘pure’ currents by subtracting I–V plots obtained at different times during La3+ application (Fig. 4A and B). The I–V plot for the current that was very rapidly blocked by La3+ could be obtained by subtracting the current trace recorded 10 s after La3+ application (when most of the inward current was already blocked whilst the outward current was still relatively unchanged; Fig. 4A, second mark; Fig. 4B, trace 2) from the trace that was recorded before La3+ application (Fig. 4A, first mark; Fig. 4B, trace 1). Current that was very rapidly blocked by La3+ had an inwardly rectifying I–V plot and no clear reversal potential up to +100 mV (Fig. 4C). Under the conditions of the experiment such a current can only be attributed to Ca2+. This Ca2+ current also showed fast inactivation during voltage steps to potentials more negative than −80 mV (Fig. 4D).
The second component of the current that was blocked by La3+ was obtained by subtracting I–V plots recorded 2 min after La3+ application (Fig. 4A, third mark; Fig. 4B, trace 3) from that recorded after 10 s (Fig. 4A, second mark; Fig. 4B, trace 2). It had an outwardly rectifying I–V plot and a reversal potential of −43 ± 3 mV (n = 4; Fig. 4E). This reversal potential corresponds to a Cl−-selective channel with PGlut/PCl of ∼0.11.
The Ca2+ current activated by glucagon was characterized further by using Ba2+ as Ca2+ substitute. Barium permeates all types of Ca2+ channels to a different extent (Yue & Marban, 1990); however, it induces specific changes in conductance of SOCs in rat hepatoma cell line (H4IIE) cells Rychkov et al. 2001) and Ca2+ release-activated Ca2+ (CRAC) channels rat basophilic laukaemia cells in (RBL) and mast cells (Hoth, 1995). Application of the solution containing 100 mm Ba2+ to a cell with a fully developed glucagon response resulted in almost instantaneous increase of the inward current amplitude followed by its decline (Fig. 5A). Upon Ba2+ removal, the inward current decreased further before slowly recovering. The outward current in the presence of Ba2+ declined after some delay and did not recover after removal of Ba2+ (Fig. 5A). It has been shown previously that depletion of Ca2+ stores in rat hepatocytes using IP3, thapsigargin or vasopressin activates ISOC with characteristics similar to that of Ca2+ release-activated Ca2+ current (ICRAC) of RBL and mast cells (Rychkov et al. 2005). When Ba2+ was applied to hepatocytes with ISOC activated by intracellular perfusion with IP3 (Fig. 5B) or by application of 1 μm thapsigargin to the bath (Fig. 5C), the change in inward current amplitude was similar to that of the inward current activated by glucagon. If applied before the depletion of the stores (Fig. 5C) or before glucagon (not shown, n = 7), 100 mm Ba2+ decreased background currents. These results provide further evidence that the Ca2+ current activated by glucagon is the same as ISOC activated by IP3- or thapsigargin-induced release of Ca2+ from stores. They also show that the depletion of Ca2+ stores and activation of Ca2+ entry per se is insufficient to activate Cl− current in rat hepatocytes.
Figure 5. Activation of Ba2+-permeable channels in rat hepatocytes by glucagon and depletion of intracellular Ca2+ stores.

A, effect of replacement of the control external solution with solution containing 100 mm Ba2+ on the currents activated by glucagon (representative cell, n = 6). B, effect of 100 mm Ba2+ on store-operated Ca2+ current activated by intracellular perfusion with 20 μm IP3 (representative cell, n = 9). C, effect of 100 mm Ba2+on store-operated Ca2+ current activated by 1 μm thapsigargin (representative cell, n = 3). Note absence of the effect when Ba2+ was applied before thapsigargin.
Chloride conductance activated by glucagon was sensitive to the osmolarity of the external medium. Addition of 100 mm sucrose to the control bath solution completely inhibited Cl− current activated by glucagon
(Fig. 6A). Currents activated by glucagon and recorded in response to voltage steps showed inactivation at potentials above 80 mV (Fig. 6B), while background currents showed no such inactivation (Fig. 6C). Chloride current similar to that activated by glucagon could be activated by cell swelling (Fig. 7). This is shown in Fig. 7A, where reduction of the osmolarity by removing 100 mm sucrose from isotonic bath solution (denoted as ‘hypo’ in the figure) resulted in development of large outwardly rectifying conductance. Restoration of osmolarity to normal inhibited this conductance within several minutes (Fig. 7A, ‘control’). As with glucagon-activated current, swelling-activated current recorded in response to voltage steps showed inactivation at potentials above 80 mV (Fig. 7B). The reversal potential of the I–V plot was −40 ± 2 mV (n = 3) in the control solution, which shifted to more positive potentials by 35 ± 2 mV (n = 3) when 140 mm NaCl in the external solution was replaced with 140 mm sodium glutamate (Fig. 7C). Removal of Ca2+ from the external solution had no effect on the development of the swelling-activated Cl− current, and did not alter the amplitude after the current had fully developed (not shown).
Figure 6. Cl− conductance activated by glucagon is inhibited by hepatocyte shrinkage.

A, effect of addition of 100 mm sucrose to the external solution on the Cl− currents activated by glucagon. B and C show membrane currents recorded in response to voltage steps ranging between −98 and +82 mV in 20 mV increments in isotonic and hypertonic solutions, respectively. Results shown in a representative cell (n = 4).
Figure 7. Hepatocyte swelling activates Cl− current similar to that activated by glucagon.

A, time course of Cl− current development in hypotonic solution and inhibition upon return to control bath solution. Initially, cell was perfused with isotonic solution in which 50 mm NaCl was replaced with 100 mm sucrose, which subsequently was changed to hypotonic solution lacking 100 mm sucrose (see Methods; representative cell, n = 4). B, membrane currents activated by swelling recorded in control solution in response to voltage steps ranging between −98 and +82 mV in 20 mV increments. C, I–V plots of the membrane currents activated by swelling in control solution and in solution in which 140 mm NaCl was replaced with 140 mm sodium glutamate.
Activation of membrane currents by glucagon depends on PLC
Activation of Ca2+ entry in non-excitable cells is usually associated with activation of PLC by G-protein-coupled receptors or tyrosine kinase-coupled receptors (Berridge, 1993). While glucagon has been shown to activate PLC, PLC is not considered the main target for glucagon in liver (Wakelam et al. 1986; Jiang & Zhang, 2003). An inhibitor of PLC, U73122 (Bleasdale et al. 1990), added at 4 μm in the bath for 2 min, completely abolished the response of rat hepatocytes to glucagon (Fig. 8A), inhibiting development of both Ca2+ and Cl− currents. The inactive analogue, U73343, applied in the bath for up to 30 min at a concentration of 10 μm, had no effect on the glucagon response (Fig. 8B). U73122 also completely inhibited Cl− current when applied to the bath after full development of that current in response to glucagon (Fig. 8C). Since U73122 could potentially have direct effects on ion channels, we investigated its effects on the types of channels that are most likely to represent those activated by glucagon. Neither the Cl− current activated by cell swelling nor the ISOC activated by depletion of the Ca2+ stores by intracellular perfusion with IP3 was affected by 4 μm U73122 applied to the bath (Fig. 8D and E).
Figure 8. Effect of the PLC inhibitor U73122 on the glucagon response.

A, U73122 (4 μm) prevents development of the glucagon response (50 nm; n = 4). B, U73343, which is an inactive analogue of U73122, had no effect on the glucagon response. C, U73122 (4 μm) inhibits Cl− current activated by glucagon (representative cell, n = 4). D, U73122 (4 μm) has no effect on Cl− current activated by cell swelling (representative cell, n = 3). E, U73122 (4 μm) has no effect on Ca2+ current activated by intracellular perfusion with 20 μm IP3 (representative cell, n = 3).
Another commonly used inhibitor of PLC, edelfosine (Horowitz et al. 2005), was also tested. However, addition of 10 μm edelfosine to the bath solution caused a rapid increase in non-specific leakage in hepatocytes within 5 min of incubation (n = 20), indicating that it is not possible to use edelfosine in patch-clamping studies of rat hepatocytes.
Activation of the Cl− current does not depend on PKA, but requires cAMP
Activation of adenylyl cyclase followed by PKA-dependent phosphorylation is considered the main pathway for glucagon regulation of liver function (Jiang & Zhang, 2003). To investigate the role of PKA in the development of membrane currents activated by glucagon, a competitive inhibitor of the activation of PKA, Rp-cAMPS (Alvaro et al. 1995), was applied at saturating concentrations through a patch pipette. This had no effect on membrane conductance of rat hepatocytes, and it did not inhibit the ability of glucagon to activate either Cl− or Ca2+ currents (Fig. 9A). Similarly, another inhibitor of PKA, H-89 (Alvaro et al. 1995), also applied at a saturating concentration, had no effect on the development of the response to glucagon (Fig. 9B). These results suggest that the pathways involving PKA are not involved in the mechanism of activation of either Ca2+ or Cl− conductance by glucagon.
Figure 9. Inhibition of PKA-dependent pathway has no effect on glucagon-activated conductance.

A, effect of Rp-cAMPS (500 μm in the pipette solution) on glucagon response (50 nm; n = 3). B, effect of PKA inhibitor, H-89 (10 μm), on glucagon response (50 nm; n = 3). Cells were incubated for 20 min with H-89 before application of glucagon.
The results presented in Fig. 9 did not exclude the possibility that cAMP might still be involved in the glucagon response through a PKA-independent mechanism. Pre-incubation of hepatocytes with adenylyl cyclase inhibitor SQ22536 (0.5 mm in the bath for 5 min; Fabbri et al. 1991) inhibited the amplitude of Cl− current developed in response to glucagon by ∼80% (Fig. 10A). This suggested that activation of adenylyl cyclase by the glucagon receptor and subsequent increase in intracellular cAMP level may be responsible for activation of the Cl− conductance. Inclusion of 100 μm cAMP in the pipette solution resulted in gradual increase of the Cl− conductance after achieving the whole-cell configuration (Fig. 10B). Properties of the Cl− current activated by cAMP (selectivity and rectification) were similar to those of the Cl− current activated by glucagon or cell swelling (not shown). To elucidate the pathway of cAMP modulation of the volume-regulated Cl− conductance, we used cAMP analogues that specifically activate either PKA or Epac (de Rooij et al. 1998). An analogue of cAMP selectively activating PKA, 6-Bnz-cAMP (200 μm in the pipette solution), had no effect on the Cl− conductance, while a specific activator of Epac, 8-pCPT-2′-O-Me-cAMP (200 μm in the pipette solution), activated a Cl− conductance of similar amplitude and the same properties as that activated by cAMP (Fig. 10B). Presence of the strong Ca2+ buffer in the pipette solution (10 mm EGTA) significantly attenuated activation of Cl− conductance by cAMP (Fig. 10C).
Figure 10. cAMP activates Cl− conductance in hepatocytes by activating Epac.

A, inhibition of the glucagon response by the inhibitor of adenylyl cyclase SQ22536 (n = 4). SQ22536 (0.5 mm) was applied to the bath solution for at least 5 min prior to addition of glucagon. B, effects of cAMP (100 μm in the pipette solution) and its analogues 8-pCPT-2′-O-Me-cAMP (200 μm in the pipette solution) and 6-Bnz-cAMP (200 μm in the pipette solution) on the outward conductance of rat hepatocytes. C, dependence of the cAMP-activated Cl− conductance on intracellular Ca2+. Calcium concentration was either weakly buffered to ∼120 nm by 1 mm EGTA, or strongly buffered to ∼10 nm by 10 mm EGTA.
Discussion
In this work, we present the first detailed studies of the effects of glucagon on membrane conductance of primary rat hepatocytes. The main result is that glucagon initiates the activation of a Ca2+ current with characteristics similar to those of the Ca2+ current activated by depletion of Ca2+ stores, and a Cl− current similar to that activated by cell swelling. These two glucagon-activated channels are likely to play a significant role in the glucagon-mediated effects in liver, particularly in the regulation of transcellular ion movements and the regulation of cell volume. Since hepatocytes express Ca2+-dependent K+ channels (Duszynski et al. 1995), activation of Ca2+ entry is likely to increase K+ efflux and cause membrane hyperpolarization. The activation by glucagon of both a Cl− and a K+ conductance of comparable size would lead to a significant efflux of both Cl− and K+, causing cell shrinkage. Both membrane hyperpolarization and shrinkage in the presence of glucagon have been previously shown in rat hepatocytes (Gaussin et al. 1992; Lang et al. 1998). Activation of Cl− channels may also be essential for the glucagon-induced bile flow and enrichment of bile fluid with bicarbonate (Alvaro et al. 1995), providing the escape route for Cl− accumulated in hepatocytes due to activation of the Cl−–HClO3− exchanger.
Identity of Ca2+ channels
The only type of Ca2+-selective channel identified so far in primary rat hepatocytes by patch-clamping is the store-operated Ca2+ channel (Rychkov et al. 2005). Although comprehensive characterization of the Ca2+ current activated by glucagon in rat hepatocytes is problematic because it is masked by a much larger Cl− current, features of this current uncovered in the present study were similar to those of ISOC previously described in rat hepatocytes and H4IIE liver cells (Litjens et al. 2004; Rychkov et al. 2005). The store-operated Ca2+ current activated in hepatocytes by vasopressin, ATP, intracellular IP3 and thapsigargin (Rychkov et al. 2005) and the Ca2+ current activated by glucagon reported here have identical inwardly rectifying I–V plots, are blocked by the same concentrations of La3+, both have an average amplitude of about 1 pA pF−1, and, more importantly, both have the same kinetics of fast inactivation at negative potentials. Moreover, a transient increase of the inward current, observed when 100 mm Ba2+ was applied to the bath when Ca2+ current had already been activated, exhibited an amplitude and time course similar to those of the inward current activated by depletion of intracellular Ca2+ stores by either IP3 or thapsigargin. Such changes in conductance in the presence of Ba2+ have previously been shown for ICRAC in mast cells, RBL cells and Jurkat cells (Hoth, 1995), and for ISOC in H4IIE liver cells (Rychkov et al. 2001).
Although all discernable properties of Ca2+ current activated by glucagon point to the conclusion that it is ISOC, the evidence that glucagon depletes Ca2+ stores in rat hepatocytes is scarce (Combettes et al. 1986), so the store dependence of this current is yet to be established.
Nevertheless, it is well known that glucagon potentiates Ca2+ inflow to hepatocytes induced by low concentrations of Ca2+-mobilizing hormones (e.g. vasopressin and phenylephrine) or thapsigargin in hepatocytes, and affects Ca2+ distribution inside the cell (Morgan et al. 1983, 1984; Combettes et al. 1986; Somogyi et al. 1992; Bygrave & Benedetti, 1993; Fernando et al. 1998). Furthermore, glucagon has been shown to produce small amounts of IP3 in hepatocytes (Wakelam et al. 1986) and to deplete Ca2+ stores in baby hamster kidney cells (BHK) expressing ectopic glucagon receptors (Hansen et al. 1998).
Identity of Cl− channels
Two types of Cl− currents have previously been characterized in rat hepatoma cell line (HTC) liver cells, widely used as model cell line for primary hepatocytes. These are Cl− currents activated by cell swelling, which show inactivation at potentials above +80 mV (Bodily et al. 1997; Feranchak et al. 2000), and Cl− currents activated by G-proteins, phosphoinositide-3 kinase and Ca2+, which show clear activation at positive potentials (Kilic & Fitz, 2002). In the present study, Cl− channels activated by glucagon showed inactivation at potentials above +80 mV similar to that found in Cl− channels activated by cell swelling. Chloride current could also be suppressed by increasing osmolarity of the external solution. Both the Cl− current activated by glucagon and the Cl− current activated by cell swelling had similar outward rectification and the same selectivity for Cl− over glutamate. Both currents could also be inhibited by NPPB (Meng & Weinman, 1996). Taking all the above together, it is safe to conclude that glucagon activates the same Cl− channels that are activated by hepatocellular swelling.
Signalling pathways involved in the response to glucagon
In addition to the generation of cAMP induced by the coupling of glucagon receptors to adenylyl cyclase, it is likely that glucagon increases hepatocyte IP3. Thus stimulation by glucagon results in accumulation of small amounts of IP3 in hepatocyte plasma membrane preparations, suggesting that it activates PLC (Wakelam et al. 1986). Since the concentrations of IP3 produced by glucagon are significantly smaller than those produced by the ‘classical’ Ca2+-mobilizing hormone vasopressin, it has been difficult to ascertain the role of a PLC-dependent mechanism in physiological effects of glucagon. It became even more doubtful after some studies reported that Ca2+-mobilizing properties of glucagon are mediated by cAMP and not IP3 (Kass et al. 1994). Although heterologous expression of glucagon receptor in BHK cells showed unequivocally that glucagon does activate PLC and release Ca2+ from intracellular Ca2+ stores by producing IP3 (Hansen et al. 1998), the contribution of this signalling pathway to the physiological effects of glucagon in hepatocytes remained unresolved, since receptors over-expressed in a heterologous system might not behave in the same way as in their native environment.
The results of the present investigation suggest that activation of PLC by glucagon is a key element in the signalling pathway that leads to activation of Ca2+ and Cl− channels in hepatocytes. It is conceivable that a Ca2+ current that has properties similar to those of an ISOC would be activated by IP3 produced by PLC; however, it is possible that another mechanism which includes regulation of channel activity by PLC substrate PIP2 is involved (Suh & Hille, 2005). Inability of the PLC inhibitor U73122 to block either swelling-activated Cl− current or ISOC, which are similar to those activated by glucagon, argues against direct regulation of these channels by PIP2. Nevertheless, although the results of the present investigation do implicate PLC in the glucagon response and suggest that it activates a current similar to ISOC, the precise mechanism of PLC involvement in the activation of the current is yet to be established.
Since depletion of Ca2+ stores by IP3- or PLC-coupled hormones, such as ATP and vasopressin, only activates ISOC but not the Cl− current (Rychkov et al. 2005; also see Fig. 5), it is clear that activation of PLC per se does not necessarily lead to activation of Cl− current in rat hepatocytes, and it is likely that other enzymes are involved. It is also clear that increase of intracellular Ca2+ concentration is insufficient to activate this Cl− current, since only glucagon activates it, but not intracellular IP3, vasopressin, ATP or thapsigargin, which activate Ca2+ current of similar amplitudes. Nevertheless, several lines of evidence suggest that there is an essential Ca2+-dependent step in activation of Cl− current. It is inhibited when Ca2+ is replaced with either Mg2+ or Ba2+, or when the Ca2+ current is inhibited by La3+. In all cases, decrease in the Ca2+ current precedes the decline in the Cl− current and, whilst the Ca2+ current is restored by reintroducing Ca2+ or washing out La3+, Cl− current is never restored to its initial size. Thus it can be concluded that Ca2+ plays the role of an important cofactor in the mechanism of Cl− current activation by glucagon, but it does not activate the channel itself. Independence of this Cl− channel of Ca2+ is obvious when it is activated by cell swelling. While the Cl− current in this case is similar to that activated by glucagon, the mechanism of activation is different, and removal of extracellular Ca2+ has no effect.
Since neither activation of PLC nor increase in [Ca2+]i alone was able to activate Cl− currents, it was logical to suggest that a cAMP-mediated signalling pathway might be involved in the mechanism of activation of the Cl− conductance by glucagon. Indeed, it has been shown previously that in rat hepatocytes cAMP modulates volume-regulated Cl− current similar to that activated by glucagon here (Meng & Weinman, 1996). Inhibition of the glucagon-activated Cl− current by the inhibitor of adenylyl cyclase SQ22536 supported the notion that cAMP is involved in the mechanism of glucagon response, which was further strengthened by the fact that cAMP alone, applied through the patch pipette, activated Cl− conductance similar to that activated by glucagon. The size of the Cl− current activated by cAMP was significantly smaller if intracellular Ca2+ was strongly buffered to ∼10 nm by 10 mm EGTA in the pipette, which suggests that at least some of the Ca2+ dependence of the Cl− current activated by glucagon is due to Ca2+ dependence of the cAMP-dependent pathway.
Protein kinase A, which is considered the main target for cAMP, did not seem to have any role in glucagon response, since inhibitors of PKA, H-89 and Rp-cAMPS, had no effect on the glucagon-activated currents, and a specific activator of PKA, 6-Bnz-cAMP, unlike cAMP, did not cause any change in membrane conductance of rat hepatocytes. Another analogue of cAMP, 8-pCPT-2′-O-Me-cAMP, that specifically activates Epac (de Rooij et al. 1998), fully mimicked the effect of cAMP on the Cl− conductance, providing first evidence that activation of Epac by cAMP may be involved in the membrane response to glucagon.
In conclusion, these results provide explanation for the previously known effects of glucagon on hepatocellular volume and bile flow, and show for the first time that both signal transduction pathways associated with the glucagon receptor (the adenylyl cyclase-dependent pathway and the PLC-dependent pathway) are involved in the mechanism by which glucagon activates Ca2+ and Cl− channels in rat hepatocytes.
Acknowledgments
We would like to thank Rachael Hughes for excellent technical assistance. The Australian Research Council and National Health and Medical Research Council, Australia supported this work.
References
- Alvaro D, Della Guardia P, Bini A, Gigliozzi A, Furfaro S, La Rosa T, Piat C, Capocaccia L. Effect of glucagon on intracellular pH regulation in isolated rat hepatocyte couplets. J Clin Invest. 1995;96:665–675. doi: 10.1172/JCI118109. [DOI] [PMC free article] [PubMed] [Google Scholar]
- Barry PH. JPCalc, a software package for calculating liquid junction potential corrections in patch-clamp, intracellular, epithelial and bilayer measurements and for correcting junction potential measurements. J Neurosci Meth. 1994;51:107–116. doi: 10.1016/0165-0270(94)90031-0. [DOI] [PubMed] [Google Scholar]
- Berridge MJ. Inositol trisphosphate and calcium signalling. Nature. 1993;361:315–325. doi: 10.1038/361315a0. [DOI] [PubMed] [Google Scholar]
- Berry MN, Edwards AM, Barritt GJ. High-yield preparation of isolated hepatocytes from rat liver. In: Burdon R H, van Knippenberg PH, editors. Laboratory Techniques in Biochemistry and Molecular Biology. Vol. 21. Amsterdam: Elsevier; 1991. pp. 15–81. [Google Scholar]
- Birnbaum MJ, Fain JN. Activation of protein kinase and glycogen phosphorylase in isolated rat liver cells by glucagon and catecholamines. J Biol Chem. 1977;252:528–535. [PubMed] [Google Scholar]
- Bleasdale JE, Thakur NR, Gremban RS, Bundy GL, Fitzpatrick FA, Smith RJ, Bunting S. Selective inhibition of receptor-coupled phospholipase C-dependent processes in human platelets and polymorphonuclear neutrophils. J Pharmacol Exp Ther. 1990;255:756–768. [PubMed] [Google Scholar]
- Bodily K, Wang Y, Roman R, Sostman A, Fitz JG. Characterization of a swelling-activated anion conductance in homozygous typing cell hepatoma cells. Hepatology. 1997;25:403–410. doi: 10.1002/hep.510250224. [DOI] [PubMed] [Google Scholar]
- Burcelin R, Katz EB, Charron MJ. Molecular and cellular aspects of the glucagon receptor: role in diabetes and metabolism. Diabetes Metabolism. 1996;22:373–396. [PubMed] [Google Scholar]
- Bygrave FL, Benedetti A. Calcium: its modulation in liver by cross-talk between the actions of glucagon and calcium-mobilizing agonists. Biochem J. 1993;296:1–14. doi: 10.1042/bj2960001. [DOI] [PMC free article] [PubMed] [Google Scholar]
- Combettes L, Berthon B, Binet A, Claret M. Glucagon and vasopressin interactions on Ca2+ movements in isolated hepatocytes. Biochem J. 1986;237:675–683. doi: 10.1042/bj2370675. [DOI] [PMC free article] [PubMed] [Google Scholar]
- de Rooij J, Zwartkruis FJ, Verheijen MH, Cool RH, Nijman SM, Wittinghofer A, Bos JL. Epac is a Rap1 guanine-nucleotide-exchange factor directly activated by cyclic AMP. Nature. 1998;396:474–477. doi: 10.1038/24884. [DOI] [PubMed] [Google Scholar]
- Duszynski J, Elensky M, Cheung JY, Tillotson DL, LaNoue KF. Hormone-regulated Ca2+ channel in rat hepatocytes revealed by whole cell patch clamp. Cell Calcium. 1995;18:19–29. doi: 10.1016/0143-4160(95)90042-x. [DOI] [PubMed] [Google Scholar]
- Fabbri E, Brighenti L, Ottolenghi C. Inhibition of adenylate cyclase of catfish and rat hepatocyte membranes by 9-(tetrahydro-2-furyl) adenine (SQ 22536) J Enzyme Inhib. 1991;5:87–98. doi: 10.3109/14756369109069062. [DOI] [PubMed] [Google Scholar]
- Feranchak AP, Fitz JG, Roman RM. Volume-sensitive purinergic signaling in human hepatocytes. J Hepatol. 2000;33:174–182. doi: 10.1016/s0168-8278(00)80357-8. [DOI] [PubMed] [Google Scholar]
- Fernando KC, Gregory RB, Barritt GJ. Protein kinase A regulates the disposition of Ca2+ which enters the cytoplasmic space through store-activated Ca2+ channels in rat hepatocytes by diverting inflowing Ca2+ to mitochondria. Biochem J. 1998;330:1179–1187. doi: 10.1042/bj3301179. [DOI] [PMC free article] [PubMed] [Google Scholar]
- Friedmann N, Dambach G. Antagonistic effect of insulin on glucagon-evoked hyperpolarization. A correlation between changes in membrane potential and gluconeogenesis. Biochim Biophys Acta. 1980;596:180–185. doi: 10.1016/0005-2736(80)90352-1. [DOI] [PubMed] [Google Scholar]
- Gaussin V, Baquet A, Hue L. Cell shrinkage follows, rather than mediates, the short-term effects of glucagon on carbohydrate metabolism. Biochem J. 1992;287:17–20. doi: 10.1042/bj2870017. [DOI] [PMC free article] [PubMed] [Google Scholar]
- Graf J, Haussinger D. Ion transport in hepatocytes: mechanisms and correlations to cell volume, hormone actions and metabolism. J Hepatol. 1996;24(Suppl. 1):53–77. [PubMed] [Google Scholar]
- Graf J, Petersen OH. Cell membrane potential and resistance in liver. J Physiol. 1978;284:105–126. doi: 10.1113/jphysiol.1978.sp012530. [DOI] [PMC free article] [PubMed] [Google Scholar]
- Hansen LH, Gromada J, Bouchelouche P, Whitmore T, Jelinek L, Kindsvogel W, Nishimura E. Glucagon-mediated Ca2+ signaling in BHK cells expressing cloned human glucagon receptors. Am J Physiol. 1998;274:C1552–C1562. doi: 10.1152/ajpcell.1998.274.6.C1552. [DOI] [PubMed] [Google Scholar]
- Heyworth CM, Houslay MD. Challenge of hepatocytes by glucagon triggers a rapid modulation of adenylate cyclase activity in isolated membranes. Biochem J. 1983;214:93–98. doi: 10.1042/bj2140093. [DOI] [PMC free article] [PubMed] [Google Scholar]
- Heyworth CM, Wallace AV, Houslay MD. Insulin and glucagon regulate the activation of two distinct membrane-bound cyclic AMP phosphodiesterases in hepatocytes. Biochem J. 1983;214:99–110. doi: 10.1042/bj2140099. [DOI] [PMC free article] [PubMed] [Google Scholar]
- Horowitz LF, Hirdes W, Suh B-C, Hilgemann DW, Mackie K, Hille B. Phospholipase C in living cells: activation, inhibition, Ca2+ requirement, and regulation of M current. J Gen Physiol. 2005;126:243–262. doi: 10.1085/jgp.200509309. [DOI] [PMC free article] [PubMed] [Google Scholar]
- Hoth M. Calcium and barium permeation through calcium release-activated calcium (CRAC) channels. Pflugers Arch. 1995;430:315–322. doi: 10.1007/BF00373905. [DOI] [PubMed] [Google Scholar]
- Jiang G, Zhang BB. Glucagon and regulation of glucose metabolism. Am J Physiol Endocrinol Metab. 2003;284:E671–E678. doi: 10.1152/ajpendo.00492.2002. [DOI] [PubMed] [Google Scholar]
- Kass GE, Gahm A, Llopis J. Cyclic AMP stimulates Ca2+ entry in rat hepatocytes by interacting with the plasma membrane carriers involved in receptor-mediated Ca2+ influx. Cell Signal. 1994;6:493–501. doi: 10.1016/0898-6568(94)90003-5. [DOI] [PubMed] [Google Scholar]
- Kilic G, Fitz JG. Heterotrimeric G-proteins activate Cl− channels through stimulation of a cyclooxygenase-dependent pathway in a model liver cell line. J Biol Chem. 2002;277:11721–11727. doi: 10.1074/jbc.M108631200. [DOI] [PubMed] [Google Scholar]
- Kraus-Friedmann N, Feng L. The role of intracellular Ca2+ in the regulation of gluconeogenesis. Metabolism. 1996;45:389–403. doi: 10.1016/s0026-0495(96)90296-6. [DOI] [PubMed] [Google Scholar]
- Lang F, Busch GL, Ritter M, Volkl H, Waldegger S, Gulbins E, Haussinger D. Functional significance of cell volume regulatory mechanisms. Physiol Rev. 1998;78:247–306. doi: 10.1152/physrev.1998.78.1.247. [DOI] [PubMed] [Google Scholar]
- Litjens T, Harland ML, Roberts ML, Barritt GJ, Rychkov GY. Fast Ca2+-dependent inactivation of the store-operated Ca2+ current (ISOC) in liver cells: a role for calmodulin. J Physiol. 2004;558:85–97. doi: 10.1113/jphysiol.2004.065870. [DOI] [PMC free article] [PubMed] [Google Scholar]
- Meng XJ, Weinman SA. cAMP- and swelling-activated chloride conductance in rat hepatocytes. Am J Physiol. 1996;271:C112–C120. doi: 10.1152/ajpcell.1996.271.1.C112. [DOI] [PubMed] [Google Scholar]
- Mine T, Kojima I, Ogata E. Role of calcium fluxes in the action of glucagon on glucose metabolism in rat hepatocytes. Am J Physiol. 1993;265:G35–G42. doi: 10.1152/ajpgi.1993.265.1.G35. [DOI] [PubMed] [Google Scholar]
- Moore AL, Roe MW, Melnick RF, Lidofsky SD. Calcium mobilization evoked by hepatocellular swelling is linked to activation of phospholipase C γ. J Biol Chem. 2002;277:34030–34035. doi: 10.1074/jbc.M205945200. [DOI] [PubMed] [Google Scholar]
- Morand C, Yacoub C, Remesy C, Demigne C. Characterization of glucagon and catecholamine effects on isolated sheep hepatocytes. Am J Physiol. 1988;255:R539–R546. doi: 10.1152/ajpregu.1988.255.4.R539. [DOI] [PubMed] [Google Scholar]
- Morgan NG, Blackmore PF, Exton JH. Modulation of the α1-adrenergic control of hepatocyte calcium redistribution by increases in cyclic AMP. J Biol Chem. 1983;258:5110–5116. [PubMed] [Google Scholar]
- Morgan NG, Charest R, Blackmore PF, Exton JH. Potentiation of α1-adrenergic responses in rat liver by a cAMP-dependent mechanism. Proc Natl Acad Sci U S A. 1984;81:4208–4212. doi: 10.1073/pnas.81.13.4208. [DOI] [PMC free article] [PubMed] [Google Scholar]
- Post S, Rubinstein P, Tager H. Mechanism of action of Des-His1-[Glu9]glucagon amide, a peptide antagonist of the glucagon receptor system. Proc Natl Acad Sci U S A. 1993;90:1662–1666. doi: 10.1073/pnas.90.5.1662. [DOI] [PMC free article] [PubMed] [Google Scholar]
- Rychkov G, Brereton HM, Harland ML, Barritt GJ. Plasma membrane Ca2+ release-activated Ca2+ channels with a high selectivity for Ca2+ identified by patch-clamp recording in rat liver cells. Hepatology. 2001;33:938–947. doi: 10.1053/jhep.2001.23051. [DOI] [PubMed] [Google Scholar]
- Rychkov GY, Litjens T, Roberts ML, Barritt GJ. ATP and vasopressin activate a single type of store-operated Ca2+ channel, identified by patch-clamp recording, in rat hepatocytes. Cell Calcium. 2005;37:183–191. doi: 10.1016/j.ceca.2004.09.001. [DOI] [PubMed] [Google Scholar]
- Somogyi R, Zhao M, Stucki JW. Modulation of cytosolic-[Ca2+] oscillations in hepatocytes results from cross-talk among second messengers. The synergism between the α1-adrenergic response, glucagon and cyclic AMP, and their antagonism by insulin and diacylglycerol manifest themselves in the control of the cytosolic-[Ca2+] oscillations. Biochem J. 1992;286:869–877. doi: 10.1042/bj2860869. [DOI] [PMC free article] [PubMed] [Google Scholar]
- Suh BC, Hille B. Regulation of ion channels by phosphatidylinositol 4,5-bisphosphate. Curr Opin Neurobiol. 2005;15:370–378. doi: 10.1016/j.conb.2005.05.005. [DOI] [PubMed] [Google Scholar]
- Tanaka A, Shinohara H, Yamaoka Y. Receptor-mediated biphasic alteration of hepatocellular transport from hepatocyte to bile canaliculi as measured by near-infrared spectroscopy: a novel test with glucagon for biliary excretion. Eur Surg Res. 2003;35:464–469. doi: 10.1159/000073384. [DOI] [PubMed] [Google Scholar]
- Wakelam MJ, Murphy GJ, Hruby VJ, Houslay MD. Activation of two signal-transduction systems in hepatocytes by glucagon. Nature. 1986;323:68–71. doi: 10.1038/323068a0. [DOI] [PubMed] [Google Scholar]
- Yue D, Marban E. Permeation in the dihydropyridine-sensitive calcium channel. Multi-ion occupancy but no anomalous mole-fraction effect between Ba2+ and Ca2+ J Gen Physiol. 1990;95:911–939. doi: 10.1085/jgp.95.5.911. [DOI] [PMC free article] [PubMed] [Google Scholar]