

Abstract
Attachment of adipose-derived stem cells (ASC) to biomaterials prior to implantation is a possible strategy for mediating inflammation and wound healing. In this study, the ASC percent coverage was measured on common medical grade biosensor materials subjected to different surface treatments. Cell coverage on silicone elastomer (poly dimethylsiloxane) was below 20% for all surface treatments. Polyimide (Kapton), polyurethane (Pellethane) and tissue culture polystyrene all exhibited >50% coverage for surfaces treated with fibronectin (Fn), fibronectin plus avidin/biotin (dual ligand), and oxygen plasma plus fibronectin treatments (Fn O2). The fibronectin treatment performed as well or better on polyimide, polyurethane, and tissue culture polystyrene compared to the dual ligand and fibronectin oxygen plasma treated surfaces. Cell detachment with increasing shear stresses was <25% for each attachment method on both polyimide and polyurethane. The effects of attachment methods on the basic cell functions of proliferation, metabolism, ATP concentration, and caspase-3 activity were analyzed yielding proliferation profiles that were very similar among all of the materials. No significant differences in metabolism, intracellular ATP, or intracellular caspase-3 activity were observed for any of the attachment methods on either polyimide or polyurethane.
Keywords: Adipose Stem Cells, Preadipocytes, Cell Adhesion, Tissue Engineering, ASC
Introduction
The rejection of biosensors is a problem under current investigation by many groups in the biomaterials community. The attachment of anti-inflammatory cells to the surface of biosensors is a possible way to reduce rejection. This paper focuses on examining pro-adhesive regimes of cells to the surfaces of different biosensor materials.
Research has shown that implants placed in either the subcutaneous lean tissue or the epididymal fat pad in rats have very different healing responses[1]. Implants in subcutaneous tissue exhibit limited angiogenesis surrounding the implant and the formation of an extensive fibrous capsule. In contrast, implants in the epididymal fat pad exhibit greater neovascularization of tissue surrounding the implant and less evidence of a fibrous capsule. Other studies have produced similar results and confirmed this tissue dependent variation in immune response[2]. A separate study has shown that devices implanted subcutaneously in rats and humans induce very different foreign body reactions[3]. When microdialysis probes were implanted in the lean subcutaneous plane in rats, the formation of an extensive fibrous capsule was observed and mass transport was reduced. In contrast, when microdialysis probes were implanted in the adipose rich subcutaneous plane in humans, fibrous capsule formation was less evident, adipose cells were seen directly bordering the implant, and mass transport increased. The qualitatively different responses to the identical implant could either be species related or tissue related or a combination.
We hypothesize that adult adipose-derived stromal cells (ASCs) could be used to ameliorate the wound healing response around biomaterials. In order to evaluate this hypothesis, a series of in vitro tests was performed to assess various cell attachment protocols. This study quantified the efficacy of ASC attachment to biomaterials as well as the effects of attachment on cell function and viability.
Adult adipose derived stromal cells were attached using different methods to silicone elastomer, polyimide, polyurethane and tissue culture polystyrene, materials that are commonly used either in implantable glucose sensors or in cell culture. After cell attachment, four cell function assays were performed to monitor proliferation, metabolism, ATP level, and apoptosis (programmed cell death). Metabolism and intracellular ATP levels are direct indicators of the health of cells. Additionally, since apoptosis occurs in a very structured manner, upstream molecules, such as caspases, are early indicators of programmed cell death. The overall purpose of this study was to measure the extent and strength of cell adhesion and to quantify the effects of the cell attachment methods on the physiologic status of the ASCs.
Materials and Methods
Material Characterization
All of the following medical grade materials used for cell attachment studies were purchased and surface composition was verified by x-ray photoelectron spectroscopy (XPS; Analytical Axis Ultra, Kratos Analytical Inc., Chestnut Ridge, NY): polyimide/Kapton® (Fralock, Inc., Canoga Park, CA), polyurethane/pellethane 2363-80AE-050824, a soft segment polyurethane based on polyether and aromatic isocyanate (Polyzen, Inc., Apex, NC), and silicone elastomer (Specialty Manufacturing Inc., Saginaw, MI). The silicone elastomer, polyurethane, and polyimide were analyzed for contact angle using a CAM-MICRO contact angle meter (Tantec Inc., Schaumburg, IL). In addition for use in the flow study analysis, the surface topographies of polyimide and polyurethane materials were characterized using scanning atomic force microscopy (AFM; Digital Instruments Dimension 3100 AFM, Veeco, Woodbury, NY). Silicone elastomer was not analyzed by AFM due to the discontinuation of its use after poor cell attachment.
Fibronectin Adsorption
Fibronectin adsorption experiments were performed in an attempt to determine the optimal fibronectin concentration and incubation times for the materials. Fibronectin adsorption to silicone elastomer (poly-dimethylsiloxane) and polyimide was determined by radiolabelling. Radioactive iodine, 125I (Na125I) (Perkin Elmer, Boston, MA), was incorporated into fibronectin using IODO-beads (Pierce, Rockford, IL). The materials were then incubated in 125I-fibronectin for either 2 or 4 hours and washed with PBS overnight to remove non-adsorbed protein. 125I-fibronectin adsorption was then quantified by measuring 125I activity with a Packard Multi-Prias 1 Counter (Packard Instruments, Downers Grove, IL). Two experiments quantified fibronectin adsorption to assess the effects of variations in the total amount and concentration of fibronectin. The first experiment investigated the importance of total fibronectin amount by keeping fibronectin concentration constant and varying the volume. The second experiment varied the fibronectin concentration while holding the volume constant.
Cell Isolation and Differentiation
Adult adipose stem cells (ASCs) were sterilely isolated from the inguinal fat pad of male Lewis rats (Charles River Laboratories, Wilmington, MA) using a modified version of a previously published protocol[4]. Briefly, after removal of the fat from the animal, the tissue was rinsed with a solution of Hank’s Buffered Saline Solution (HBSS) containing 1% antibiotics, minced into small pieces, and incubated in a constantly stirred solution containing 1 mg collagenase (Sigma-Aldrich, St. Louis, MO) per gram of fat for 1 hour at 37°C. The top lipid layer was removed and the remaining liquid portion was centrifuged at 2000 rpm for 10 minutes. The pellet was exposed to red cell lysis buffer (Sigma-Aldrich, St. Louis, MO) for 2 minutes to remove red cells. The remaining cells were suspended in media and plated at a density of 1 x 10⁶ cells per T75 flask. After reaching approximately 80% confluence, the cells were frozen at a density of 5 x 10⁵ cells per ml of freezing media (α-MEM, 20% FBS, and 10% DMSO). Cells were thawed as needed at 37°C and seeded at a density of 7.5 x 10⁵ cells per T75 flask.
Cells were differentiated into adipocytes and osteoblasts to confirm that an ASC population was truly isolated. Adipogenic media contained DMEM, 10% FBS, 0.5 mM IBMX, 10 μM insulin, 0.5 μM Dexamethasone, and 1% penicillin/streptomycin[5]. Osteogenic media contained DMEM, 10% FBS, 10 mM b-glycerol phosphate, 50 μg/ml ascorbate 2-phosphate, 10 nM dexamethasone, 100 U/ml penicillin, and 0.1 mg/ml streptomycin[4]. Oil Red O staining after 28 days in culture was used to confirm adipose differentiation and von Kossa staining after 28 days was used to confirm bone differentiation.
Surface Modifications and Cell Attachment
Three methods of cell attachment were analyzed: (1) control, (2) fibronectin, and (3) a dual ligand system containing both avidin/biotin and fibronectin. These three cell attachment methods were performed on the bare materials and also on the materials after they had been exposed to oxygen plasma etching at 100 Watts for 40 minutes using an Emitech K-1050X Plasma Asher (Empdirect, Houston, TX). Oxygen plasma treatment has been shown to decrease the water contact angle of materials, and since cells typically adhere better to more hydrophilic materials, it has been shown to increase cell adherence. For all attachment methods, cells were seeded at 800 cells per mm2 of material and assessed on either Day 1 or Day 5. The control attachment protocol consisted of washing the material with PBS prior to the addition of cells. The fibronectin attachment protocol, which relies on integrin receptor mediated cell adhesion, was composed of treating the materials with 25 μg/ml fibronectin (Sigma-Aldrich, St. Louis, MO) for 2 hours prior to cell seeding. This fibronectin concentration and incubation time was determined by the fibronectin adsorption study. In the dual ligand method, the cells form two attachments: receptor-dependent integrin attachments with the fibronectin as well as receptor-independent attachments with biotin-streptavidin-biotin. This protocol consisted of treating the material for 2 hours with a heterogeneous mixture of 25 μg/ml fibronectin and 0.4 mg/ml biotinylated BSA (Sigma-Aldrich, St. Louis, MO), followed by 0.5 mg/ml avidin (Sigma-Aldrich, St. Louis, MO) for 40 minutes. The cells for the dual ligand treatment were biotinylated by treating with 1 mM sulfosuccinimidyl-6-(biotinamido)hexanoate, NHS-LC-biotin (Pierce, Rockford, IL), for 30 minutes[6]. For imaging, the cells were stained with LIVE/DEAD stain (Molecular Probes/Invitrogen, Carlsbad, CA). Fluorescent micrographs were taken and the percent surface covered by cells was analyzed.
Strength of Cell Attachment/Flow
Adult adipose stem cells were attached to rectangles of material (4.5 cm x 10 cm) using the same treatments described above with the cell density of 130 cells per mm2. The cells were allowed to grow for 12 hours prior to flow experiments, then stained with LIVE/DEAD stain for imaging. Flow experiments were conducted using DMEM with increasing shear stresses of 5, 20, and 50 dyne/cm2. Flow was maintained for 5 minutes at room temperature for each shear stress. A final flow of deionized water was performed at 40 dyne/cm2 for 5 minutes as a positive control for detachment. The flow chamber was briefly opened initially and between each change in shear stress and 15–20 digital pictures were taken of different areas on the material. The percent of the material surface coved by cells was analyzed using a digital image analysis program.
Cell Function and Viability
Metabolism
For all attachment methods, ASCs were seeded as described in the cell attachment experiments. After incubation for 2, 4, 7, and 9 days, the conditioned media was aspirated and stored at −80°C for metabolic analysis and fresh media was added for the next time point. Additionally, each media preparation was placed in control wells without cells in each of the plates. These wells without cells served to control for the effects of evaporation on the media’s composition. The concentration of glucose, lactate, pyruvate, and urea was measured for each of the samples of conditioned media using a CMA 600 Microdialysis Analyzer (CMA, Solna, Sweden).
Proliferation, ATP, and Caspase 3
For each attachment method at days 1, 3, 6, and 10 post-attachment, cell number was quantified using the CyQUANT Cell Proliferation Assay Kit (Molecular Probes/Invitrogen, Carlsbad, CA). As recommended by Invitrogen, the cells were washed with PBS and stored at −80°C prior to analyzing. To quantify cell number, 200 μl of the CyQUANT GR dye/cell lysis buffer was added to the sample and incubated for 4 minutes at room temperature, protected from light. Then the fluorescence was measured using a fluorescein filter set. Cell number was determined using a reference standard curve. ATP level was quantified at the same time points, days 1, 3, and 6, using the ATPlite detection assay (Perkin Elmer, Boston, MA). Briefly, as recommended by Perkin Elmer, the cells were released from the materials with 0.25% typsin and pelleted. In a 96 well plate, 50 μl of the cell lysis solution was added to 100 μl of the cell suspension per well and shaken on an orbital shaker for 5 minutes at 700 rpm to lyse cells and stabilize ATP. Next 50 μl of the substrate was added to each well and shaken for 5 minutes at 700 rpm. The plate was then dark adapted for 10 minutes and the luminescence was measured. ATP amount was determined using the standard ATP solution to make a standard curve as described in the manual.
Finally, on days 6 and 10 post-attachment, the activity of caspase-3 was analyzed using the EnzChek Caspase-3 Assay Kit #2 (Molecular Probes/Invitrogen, Carlsbad, CA). Briefly, as recommended by Invitrogen, the cells were released from the materials with 0.25% typsin, and the resulting cell pellet was washed with PBS and stored at −80°C prior to analyzing. The pellet was resuspended in 50 μl cell lysis buffer, and then centrifuged at 5000 rpm for 5 minutes to remove any cellular debris. Next, 50 μl of the supernatant was transferred to individual wells on a 96-well plate, and 50 μl of the substrate working solution was added to each well. The plate was incubated at room temperature, protected from light, for 30 minutes. Then the fluorescence was measured using a fluorescein filter set. Cell activity was determined using a R110 reference standard curve prepared as outlined in the assay manual.
Statistics
For the fibronectin adsorption experiments, first a three way ANOVA (factors of treatment, adsorption time, and material) was performed. Further intergroup comparisons were made using Fisher’s test. Additionally, the 2 and 4 hour adsorption times were compared using a t-test. For the cell attachment experiments, the main effects of treatment and time were analyzed by a two way ANOVA (factors of attachment method and day) for each material. Additionally, the main effect of attachment method was determined by a one factor ANOVA and a post hoc Dunnett’s t-test to compare all attachment methods back to control for that same day. The main effect of time was determined by a one factor ANOVA and a post hoc t-test to compare differences between Day 1 and Day 5. For the flow experiments, all results were based on percent of initial area. A repeated measure 2 way ANOVA (factors of attachment method and flow shear stress) was performed. For the cell proliferation, metabolism, ATP, and caspase experiments, a repeated measure 2 way ANOVA (factors of attachment method and material) was performed.
Results
Material Characterization
Table I shows the results of contact angle analysis on silicone elastomer, polyimide, and polyurethane before and after different plasma ashing cycles. For silicone elastomer and polyurethane, the contact angle decreased with increasing plasma ashing time until 40 minutes when it stabilized. Polyimide reached its lowest contact angle during the 20 minute plasma ashing cycle and stayed the same thereafter.
Table I.
Contact Angle Measurements (±SEM)
| Plasma Asher (100 W) | ||||
|---|---|---|---|---|
| Material | Non-treated | 20 minutes | 40 minutes | 60 minutes |
| Silicone Elastomer | 114±1 | 88±2 | 78±2 | 79±2 |
| Polyimide | 94±1 | <2 | <2 | <2 |
| Polyurethane | 83±1 | 65±1 | 42±1 | 40±1 |
The roughness of the materials was analyzed using AFM. The AFM topographies are shown in figure 1. The polyimide is a relatively smooth surface with an average roughness (RMS) of 2 nm and a vertical z-range of 13 nm. However, the polyurethane had deeper grooves with an average roughness of 360 nm and a vertical z-range of 1860 nm.
Figure 1.
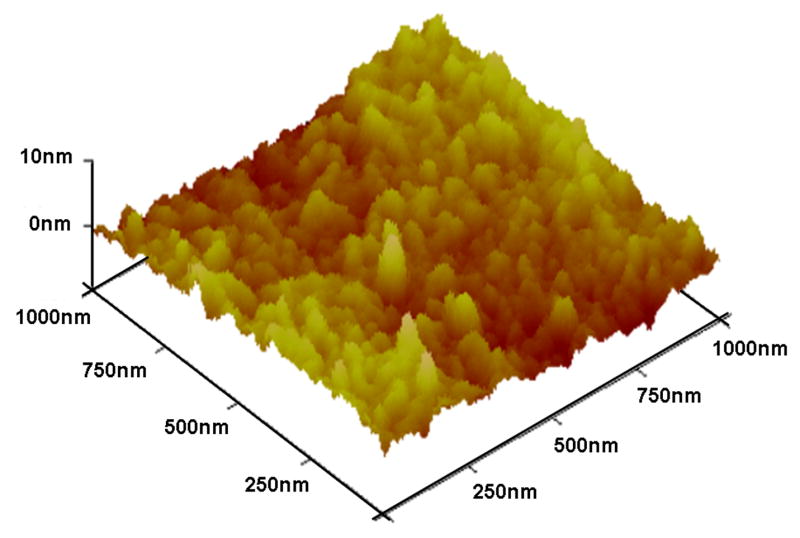
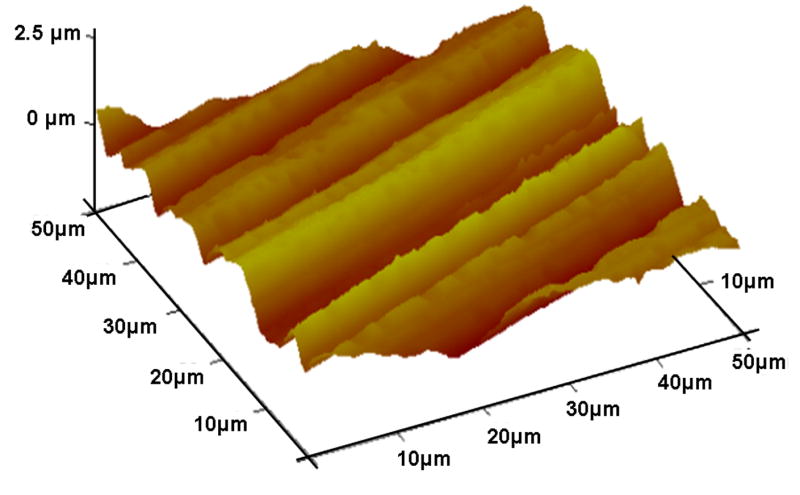
AFM surface topography images of (a) polyimide and (b) silicone elastomer.
Fibronectin Adsorption
Fibronectin adsorption experiments were performed to determine optimal fibronectin concentration and incubation time. Figure 2 displays the fibronectin adsorption in ng/mm2 to silicone and polyimide as a function of either fibronectin concentration or total amount of fibronectin added. The results of the first fibronectin study displayed in figure 2a showed no effect of volume on adsorption; there were no significant differences determined by ANOVA among the volumes and times of incubation. The results of the second experiment displayed in figure 2b show that the fibronectin concentration, not the absolute quantity of fibronectin, is the primary determinate of fibronectin adsorption at 2 and 4 hours. The highest concentration of fibronectin (30 ng/μl) produced the highest amount of protein adsorption. Finally, the 4 hour incubations did not give significantly higher fibronectin adsorption than 2 hour incubations at any fibronectin concentration, with the exception of polyimide at 10 ng/μl.
Figure 2.


Fibronectin adsorption on silicone elastomer and polyimide (a) with concentration held constant and varying volume and (b) with volume held constant and varying concentration. Mean ± SEM. * t-test, 2 hr vs 4 hr, p<0.05
Cell Attachment
Cell attachment was analyzed for four materials using three different attachment methods on either the bare material or the oxygen plasma treated material as shown in figure 3. Polystyrene or cell culture plastic was used as a positive control since the cells are known to adhere and spread on this material. Also, since cell culture plastic is already plasma treated by the manufacturer, no additionally plasma treatment was evaluated. At Day 1, the dual ligand attachment method gave significantly higher cell coverage than the control, while the fibronectin did not significantly increase the cell area coverage. However, by Day 5, all of the attachment methods had increased and covered approximately 85% of the cell culture dish. As seen in figure 3b, none of the attachment methods produced cell coverage over more than 20% of the silicone surface at either Day 1 or Day 5. There were no statistically significant differences in any of the attachment methods for silicone and for this reason, subsequent experiments did not include silicone. The control treatment on polyimide was approximately 40%, which was similar to the control treatment on polystyrene. The dual ligand did not significantly increase cell coverage at Day 1, however, the fibronectin and the oxygen plasma treatment of polyimide increased cell coverage slightly, while the oxygen plasma treatment plus fibronectin and the oxygen plasma treatment plus the dual ligand further increased the cell coverage. At Day 5, the control on both the bare polyimide and the oxygen plasma treated polyimide as well as the oxygen plasma plus dual ligand treatment had a significant decrease in cell coverage when compared to Day 1. However, the fibronectin and dual ligand treatments on the bare material as well as the oxygen plasma plus fibronectin treatments resulted in a significant increase in cell coverage. On Day 1, the fibronectin and dual ligand treatments on both the bare polyurethane and the oxygen plasma treated polyurethane gave significantly higher cell coverage than the control. The oxygen plasma treatment alone did not result in increased cell coverage, and the controls for both the bare and oxygen plasma treated polyurethane had low cell coverage on both Day 1 and Day 5. The fibronectin on the bare polyurethane and the fibronectin on the oxygen plasma treated polyurethane had slightly higher cell coverage on Day 5 versus Day 1. The dual ligand on both the bare and oxygen plasma treated polyurethane were not significantly different between the two days.
Figure 3.
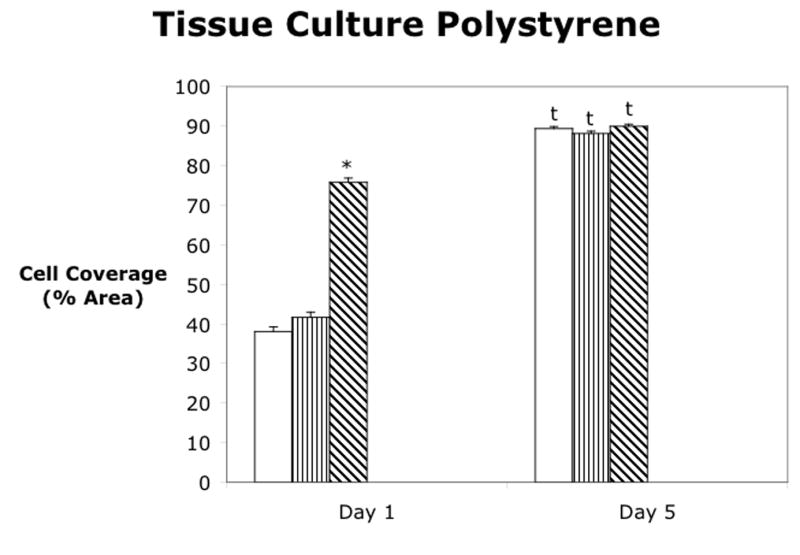
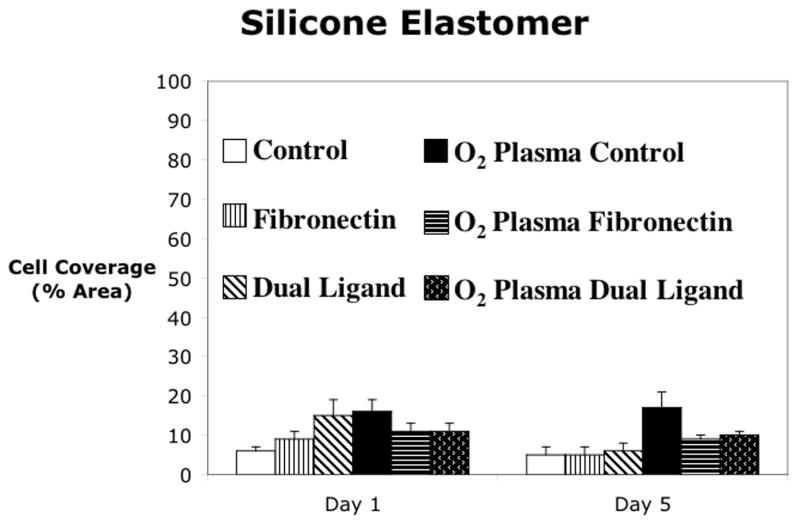
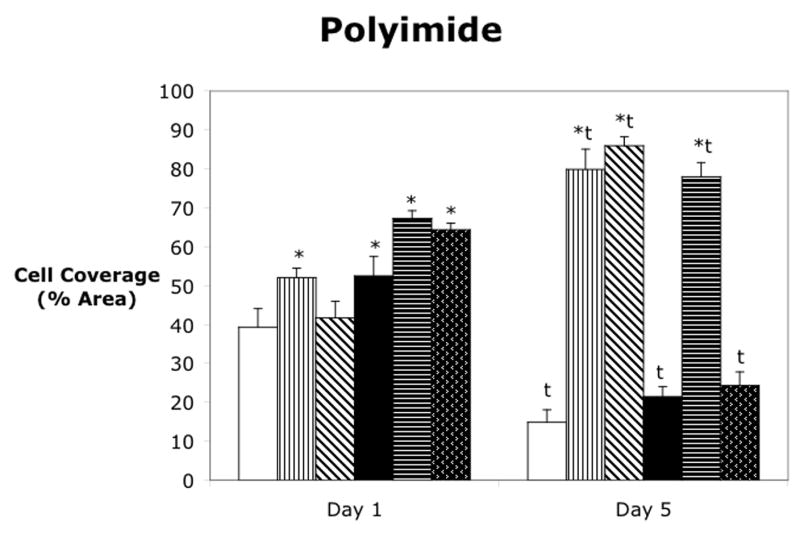
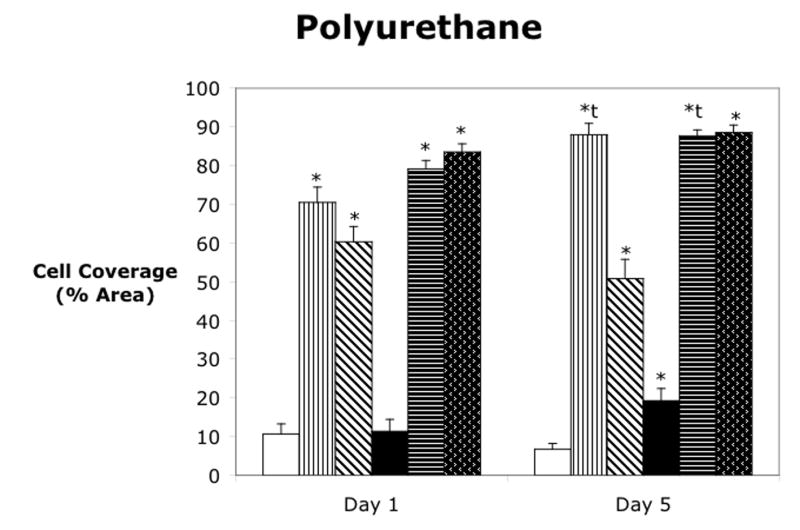
Cell attachment to (a) polystyrene, (b) silicone elastomer, (c) polyimide, and (d) polyurethane. Mean ± SEM. * = Dunnett’s (p<0.05) vs control for that material and day. t = t-test of day 1 vs day 5.
Strength of Cell Attachment
Strength of cell attachment was analyzed on polyimide and polyurethane by tracking the percent of the material surface area covered by cells while using a flow system that employed increasing shear stress rates. The attachment methods for both polyimide and polyurethane gave different initial cell coverage areas and the trends were the same as those seen in the cell attachment experiments. Figure 4 shows the change in cell coverage area as a function of increasing shear stress. There was no significant decrease in cell coverage area for any of the treatments on either polyimide or polyurethane as flow rates increased. Water was used as the final flow fluid in the final flow of each experiment. Since water lyses cell membranes and should cause detachment of the cells, this step of the experiment ensured that the cells were coming into contact with the flow. The water flows all decreased the cell coverage area to less than 20%. Due to experimental limitations, polystyrene was not analyzed. Also, silicone elastomer was not analyzed due to the discontinuation of its use after poor cell attachment results.
Figure 4.


Strength of cell attachment to (a) polyimide and (b) polyurethane. Mean ± SEM.
Proliferation Assay
Cell proliferation was analyzed on three materials, polystyrene, polyimide and polyurethane, using three attachment methods and the results are shown in figure 5. Polystyrene was used as a control. On all three materials, the fibronectin and dual ligand treatments resulted in an initial increase in the number of cells versus the control. By Day 6, both the control for both the polystyrene and the polyurethane had increased into the same range. By Day 10, the fibronectin treatment had significantly higher cell numbers than the control or dual ligand treatments on all three materials.
Figure 5.


Cell proliferation after attachment to (a) polystyrene, (b) polyimide, and (c) polyurethane. Mean ± SEM.
Metabolism
As shown in table II, no significant differences were seen in glucose consumption and lactate production in any of the cell attachment methods when compared to the control attachment on the same material. Urea levels (data not shown) showed no differences among the groups, indicating there was no systematical variation in amount of evaporation leading to differences in analyte concentrations among the groups.
Table II.
Cellular Metabolism after Attachment to Polystyrene, Polyimide, and Polyurethane
|
Glucose Consumption per day (mmol/L/day) |
Lactate Production per day (mmol/L/day) |
||||||||
|---|---|---|---|---|---|---|---|---|---|
| Material | Attachment Methods | Day 2 | Day 4 | Day 7 | Day 10 | Day 2 | Day 4 | Day 7 | Day 10 |
| Polystyrene | Control | 0.8±0.2 | 0.7±0.1 | 0.8±0.1 | 1.1±0.1 | 0.2±0.1 | 0.4±0.1 | 0.4±0.1 | 0.3±0.1 |
| Polyimide | Control | 1.2±0.4 | 0.6±0.2 | 1.0±0.2 | 1.7±0.1 | 0.0±0.1 | 0.0±0.1 | 0.1±0.1 | 0.1±0.1 |
| Polyimide | Fibronectin | 2.3±0.1 | 0.4±0.1 | 1.1±0.1 | 1.6±0.1 | 0.5±0.1 | 0.1±0.1 | 0.3±0.1 | 0.1±0.1 |
| Polyimide | Dual Ligand | 1.6±0.3 | 1.4±0.3 | 0.6±0.1 | 1.1±0.2 | −0.2±0.1 | −0.2±0.1 | 0.0±0.1 | −0.1±0.1 |
| Polyurethane | Control | 1.6±0.3 | 1.4±0.2 | 0.7±0.2 | 1.3±0.2 | −0.2±0.1 | −0.2±0.1 | 0.2±0.1 | 0.0±0.1 |
| Polyurethane | Fibronectin | 0.7±0.1 | 1.2±0.2 | 1.2±0.1 | 1.0±0.2 | 0.0±0.1 | 0.0±0.1 | 0.1±0.1 | 0.0±0.1 |
| Polyurethane | Dual Ligand | 1.2±0.4 | 0.6±0.2 | 0.6±0.2 | 0.9±0.1 | −0.2±0.1 | 0.1±0.1 | 0.0±0.1 | 0.0±0.1 |
ATP Concentration
As displayed in table III, ATP concentrations per cell ranged from 1.6x10⁻¹¹ to 1.1x10⁻¹⁰ mol/L. No significant differences were seen in the ATP levels of the cells between the different attachment methods.
Table III.
ATP Concentrations of Cells Attached to Polystyrene, Polyimide, and Polyurethane
| ATP Concentration/Cell (x 10−11M) | ||||
|---|---|---|---|---|
| Material | Attachment Method | Day 1 | Day 3 | Day 6 |
| Polystyrene | Control | 5.1 ± 0.2 | 5.0 ± 1 | 2.8 ± 0.3 |
| Polyimide | Control | 4.1 ± 0.8 | 2.9 ± 0.3 | 3.8 ± 0.4 |
| Polyimide | Fibronectin | 3.9 ± 0.9 | 3.2 ± 0.6 | 2.0 ± 0.3 |
| Polyimide | Dual Ligand | 3.9 ± 0.9 | 1.8 ± 0.3 | 2.7 ± 0.2 |
| Polyurethane | Control | 5.2 ± 1 | 4.5 ± 0.9 | 3.4 ± 0.1 |
| Polyurethane | Fibronectin | 4.2 ± 1 | 2.0 ± 0.2 | 1.6 ± 0.3 |
| Polyurethane | Dual Ligand | 4.4 ± 3 | 2.9 ± 0.3 | 4.8 ± 0.4 |
Caspase Activity
As seen in table IV, there were no significant differences in caspase-3 activity for the different attachment methods.
Table IV.
Caspase Activity of Cells Attached to Polystyrene, Polyimide, and Polyurethane
| Caspase-3 Activity/cell (μM) | |||
|---|---|---|---|
| Material | Attachment Method | Day 6 | Day 10 |
| Polystyrene | Control | 3.6±0.2 | 4.1±0.4 |
| Polyimide | Control | 2.6±0.1 | 3.7±0.1 |
| Polyimide | Fibronectin | 3.0±0.4 | 2.9±0.1 |
| Polyimide | Dual Ligand | 1.7±0.4 | 2.3±0.2 |
| Polyurethane | Control | 1.8±0.2 | 2.6±0.1 |
| Polyurethane | Fibronectin | 1.4±0.2 | 2.4±0.2 |
| Polyurethane | Dual Ligand | 3.2±0.2 | 3.3±0.1 |
Discussion
This series of in-vitro tests was performed to evaluate the efficacy of different cell attachment protocols and their effects on basic cell functions. Adipose stromal cells were attached to three commonly used biocompatible materials, silicone elastomer, polyimide and polyurethane, as well as polystyrene cell culture plastic. The cell attachment protocols were analyzed for percent surface area coverage by the cells as well as for strength of attachment. Additionally, basic metabolites were analyzed to determine if any of the cell attachment methods altered cell viability, function or metabolism.
It is noted that ASCs are a multipotent precursor cell population isolated from adipose tissue that are inherently different from mature adipocytes found in the epididymal fat pad in rats or the adipose-rich subcutaneous plane in humans. Since the basis of this research is that adipose tissue initiates a less aggressive foreign body response to implants, pre-differentiating the stem cells into adipocytes using well-defined adipogenic stimulants prior to implantation was considered. However, due to the inherent fragility of mature adipocytes and the increased complexity and time to pre-coat the implant with cells, ASCs were chosen for these experiments. Future experiments might investigate pre-differentiation prior to implantation.
Three methods of cell attachment were evaluated. The control attachment consisted of the addition of a cell suspension to the material without any material pre-treatment other than washing with PBS. In the fibronectin attachment, the cells attach to the adsorbed fibronectin using integrin receptors. In the dual ligand attachment, which has been highly characterized and used for endothelial cell attachment[6, 7], the material was treated with fibronectin and both the cells and the material were biotinylated and avidin was used to bind the two biotins together. In this method, the cells form two attachments: receptor-dependent integrin attachments with the fibronectin as well as receptor-independent attachments with biotin-streptavidin-biotin.
Since both the fibronectin attachment and the dual ligand attachment rely on fibronectin adsorption to the material of interest, the radiolabelled fibronectin studies were performed in order to determine the proper adsorption time and solution concentration. As shown in figure 2, the 125I-fibronectin experiments indicate that with 2 and 4 hours of incubation, the concentration and not the absolute quantity of fibronectin was the primary determinant of fibronectin adsorption. This suggests that cell adherence to devices would likely have better results with incubation at higher fibronectin concentration instead of higher volume. In addition, the highest concentration of fibronectin (30 ng/μl) produced the highest amount of protein adsorption. Finally, the 4 hour incubations did not give significantly higher fibronectin adsorption than 2 hour incubations with the exception of polyimide at 10 ng/μl. Therefore, a fibronectin concentration of 25–30 ng/μl was chosen with an incubation time of 2 hours for the remaining cell attachment experiments. These experiments did not include polystyrene and polyurethane, however these materials should act similarly and therefore the same concentrations and incubation times were used.
Oxygen plasma ashing was studied as a material treatment prior to cell attachment. Oxygen plasma ashing uses a low pressure RF induced gas discharge to excite oxygen gas molecules and dissociate the gas into chemically active ions and molecules. These ions bombard the surface of the material leaving an oxidized layer on the surface. This has been shown to decrease the water contact angle of materials. Since cells typically adhere better to more hydrophilic materials, oxygen plasma ashing has been shown to increase cell adherence [8, 9]. As seen in table I, oxygen plasma ashing reduced the water contact angle for all of the materials studied. Plasma ashing beyond 40 minutes did not significantly further decrease the contact angle. Therefore, all experiments were performed with a plasma ashing time of 40 minutes immediately prior to cell attachment.
Cell attachment to the four materials, silicone elastomer, polyimide, polyurethane, and polysytrene, was evaluated as the percent of material area covered by cells and is shown in figure 3. Attachment was evaluated on polystyrene, or cell culture plastic, as a positive control because cells are known to attach and spread well on this material. As seen in figure 3a, the dual ligand attachment method improved initial cell coverage on polystyrene at day 1. However, by Day 5, all of the attachment methods produced cell coverage of approximately 85% of the cell culture dish.
Silicone elastomer, both before and after oxygen plasma treatment was a very hydrophobic material and, as discussed above, cells typically do not adhere well to hydrophobic materials. As shown in figure 3b, none of the attachment methods produced cell coverage greater than 20%. Therefore, high surface coverage by cells on silicone elastomer may require novel strategies for cell attachment. For this reason, cell attachment studies with silicone elastomer were not studied further in this series.
As seen in figure 3c, the control attachment on polyimide was approximately 40%, similar to that of polystyrene. At Day 1, all attachment methods, with the exception of the dual ligand, produced significantly higher cell attachment than the control. However, at Day 5, only the fibronectin and dual ligand on polyimide and the oxygen plasma plus fibronectin had increased cell surface area coverage. These three attachment methods produced very high cell surface area coverage, similar to that of the polystyrene treatments at Day 5. Therefore, all of these treatments could be considered as possible attachment methods on polyimide.
Figure 3d shows the cell attachment results on polyurethane. The control attachment on polyurethane produced low cell coverage, approximately 10%. The fibronectin and dual ligand on the bare material and on the oxygen plasma treated material gave significantly higher coverage, approximately 60–80%. At Day 5, the dual ligand attachment did not increase, but the fibronectin on bare and oxygen plasma treated polyurethane increased to approximately 85–90% cell surface area coverage. Therefore the fibronectin on bare polyurethane and the fibronectin and dual ligand on the oxygen plasma treated polyurethane are possible candidates for good cell attachment methods for this material.
Oxygen plasma treatment did not significantly increase cell coverage more than the fibronectin alone on either polyimide or polyurethane. Therefore, no further studies, such as strength of attachment and viability, on the oxygen plasma treated materials were conducted.
Not only is high cell coverage on the surface of the material important, but the strength of the cellular attachment to the material is also important. In order to evaluate strength of adhesion, a flow system was used that employed media flowing across the material surface to generate different shear stresses. Figure 4 shows the change in cell coverage area as a function of increasing shear stress. The cell attachment was very strong for all of the cell attachment methods on both polyimide and polyurethane. Even high shear rates of 50 dyne/cm2 did not decrease cell coverage significantly. One possible reason for strong attachment on polyurethane may be due to the surface topography of the material. The polyurethane had deep grooves with an average roughness of 360 nm and a vertical z-range of 1860 nm. With typical cell heights in this range, the cells could sit down in these groves and be semi-protected from the flow fluid. For all experiments, water was used as the final flow fluid to ensure that the cell release could be detected in this system. In all cases, water resulted in cell coverage areas of less than 20%. Continued measurement of 20% coverage after 5 minutes of water exposure could have resulted from cell lysis with fragments remaining on the material and counted as “cell coverage”.
Cell proliferation for the different attachment methods was also analyzed to determine if any of the attachment methods changed the cell proliferation profile. The cell proliferation profiles looked very similar among all of the materials. The rate of proliferation for the fibronectin attachment was similar to that of the control. However, the dual ligand resulted in a decrease in the rate of proliferation for polyurethane. With significant caution, one can roughly estimate cell spreading by dividing the cell coverage data collected at a certain time by the fit of cell proliferation data at that same time point. The calculated average area occupied by each of the ASCs ranged from approximately 200 μm2 (Day 5, polyurethane, control attachment) to approximately 2300 μm2 (Day 5, polystyrene, control attachment), which is similar to the cell area for cells seen in other experiments[7]. These cell area numbers can be used to determine if an increase or decrease in cell coverage of the material surfaces was due to cell spreading or to cell proliferation. For polystyrene, there was a slight increase in cell area between Day 1 and Day 5 for both the control and the dual ligand attachment methods. This likely indicates that the increase in cell coverage area is due mostly to cell proliferation and only slightly to cell spreading.
The fibronectin had a significantly different cell coverage profile. Cell coverage for the fibronectin method was much lower than the dual ligand at Day 1 but increased to the same cell coverage area by Day 5, and the cell area increased more than 2-fold indicating that much of the increase in cell coverage for the fibronectin was from cell spreading. The control attachment for polyimide and polyurethane resulted in a decrease in cell area from Day 1 to Day 5 indicating that even though the cells were slowly proliferating, they were also contracting at the same time. Since adipose stem cells are a heterogeneous cell population, one explanation could be that the larger, more spread cells died between Day 1 and 5 while the smaller cells were proliferating. The decrease could also be due solely to cell contraction. For polyimide, the fibronectin treatment yielded no change in cell area from Day 1 to Day 5, however the dual ligand treatment yielded a slight increase in cell spreading. For polyurethane, the fibronectin and dual ligand attachment methods yielded no change in cell area indicating that on polyurethane, the change in cell coverage is due to a change in cell number as opposed to cell spreading.
Intracellular ATP concentrations, caspase-3 concentrations, and cell metabolism were studied to determine if any of the cell attachment protocols affected these cell functions. However, no significant differences were seen in any of these variables, and when compared to other studies, all levels were within a normal range. ATP provides information about sublethal cell damage because the production of ATP may be transiently depressed by many forms of cell stress. ATP levels measured here were within a normal range, similar to that seen in studies of other cell types [10, 11]. Additionally, caspase-3, a member of the caspase family of cysteine proteases, is a known early indicator of apoptosis. Since apoptosis occurs in a very structured manner, upstream molecules, such as caspases, can indicate cell death before it would be visually apparent. Caspase-3 concentrations were orders of magnitude less than the levels reported in similar cells where apoptosis occurred[12], suggesting that apoptosis was not increased by the material treatments.
Conclusions
In conclusion, this paper examines cell coverage and cell function of ASCs on different biomaterials. In vivo, the cell coverage may increase mass transport and lessen fibrotic encapsulation around biosensors leading to an increase in the ability of biosensors to function.
Cell coverage on silicone rubber was always below 20% indicating that high surface coverage by cells on silicone elastomer may require novel strategies for cell attachment. The fibronectin, dual ligand and oxygen plasma plus fibronectin treatments all produced high cell coverage on polyimide. The fibronectin, oxygen plasma plus fibronectin and oxygen plasma plus dual ligand treatments all produced high cell coverage on polyurethane. Cell attachment was very strong on both polyimide and polyurethane for all attachment methods. Finally, none of the attachment methods caused any differences in basic cell functions, including proliferation, metabolism, intracellular ATP concentration, and caspase-3 activity.
Acknowledgments
These studies were supported by NIH grant T32 GM08555, NIH grant DK54932, and the Robert Jones Fund. The authors thank Dr. Kevin Olbrich for valuable discussions regarding the cell culture studies.
Footnotes
Heather L Prichard, Duke University, Box 3906, Durham, NC 27710
William M Reichert, Duke University, Department of Biomedical Engineering, Box 90281, Durham, NC 27708
References
- 1.Williams SK, Berman SS, Kleinert LB. Differential healing and neovascularization of ePTFE implants in subcutaneous versus adipose tissue. Journal of Biomedical Materials Research. 1997;35(4):473–481. doi: 10.1002/(sici)1097-4636(19970615)35:4<473::aid-jbm7>3.0.co;2-e. [DOI] [PubMed] [Google Scholar]
- 2.Kellar RS, Kleinert LB, Williams SK. Characterization of angiogenesis and inflammation surrounding ePTFE implanted on the epicardium. Journal of Biomedical Materials Research. 2002;61(2):226–233. doi: 10.1002/jbm.10021. [DOI] [PubMed] [Google Scholar]
- 3.Wisniewski N, Rajamand N, Adamsson U, Lins PE, Reichert WM, Klitzman B, et al. Analyte flux through chronically implanted subcutaneous polyamide membranes differs in humans and rats. American Journal of Physiology-Endocrinology and Metabolism. 2002;282(6):E1316–E1323. doi: 10.1152/ajpendo.00259.2001. [DOI] [PubMed] [Google Scholar]
- 4.Lee JA, Parrett BM, Conejero JA, Laser J, Chen J, Kogon A, et al. Biological Alchemy: Engineering Bone and Fat From Fat-Derived Stem Cells. Annals of Plastic Surgery. 2003;50:610–617. doi: 10.1097/01.SAP.0000069069.23266.35. [DOI] [PubMed] [Google Scholar]
- 5.Zuk PA, Zhu M, Mizuno H, Huang J, Futrell JW, Katz AJ, et al. Multilineage cells from human adipose tissue: Implications for cell-based therapies. Tissue Engineering. 2001;7(2):211–228. doi: 10.1089/107632701300062859. [DOI] [PubMed] [Google Scholar]
- 6.Bhat VD, Klitzman B, Koger K, Truskey GA, Reichert WM. Improving endothelial cell adhesion to vascular graft surfaces: Clinical need and strategies. Journal of Biomaterials Science-Polymer Edition. 1998;9(11):1117–1135. doi: 10.1163/156856298x00686. [DOI] [PubMed] [Google Scholar]
- 7.Anamelechi CC, Truskey GA, Reichert WM. Mylar (TM) and Teflon-AF (TM) as cell culture substrates for studying endothelial cell adhesion. Biomaterials. 2005;26(34):6887–6896. doi: 10.1016/j.biomaterials.2005.04.027. [DOI] [PubMed] [Google Scholar]
- 8.Lee JN, Jiang X, Ryan D, Whitesides GM. Compatibility of mammalian cells on surfaces of poly(dimethylsiloxane) Langmuir. 2004;20(26):11684–11691. doi: 10.1021/la048562+. [DOI] [PubMed] [Google Scholar]
- 9.Abbasi F, Mirzadeh H, Katbab AA. Modification of polysiloxane polymers for biomedical applications: a review. Polymer International. 2001;50(12):1279–1287. [Google Scholar]
- 10.Nerurkar PV, Dragull K, Tang CS. In vitro toxicity of kava alkaloid, pipermethystine, in HepG2 cells compared to kavalactones. Toxicological Sciences. 2004;79(1):106–111. doi: 10.1093/toxsci/kfh067. [DOI] [PubMed] [Google Scholar]
- 11.Merighi S, Benini A, Mirandola P, Gessi S, Varani K, Leung E, et al. A(3) adenosine receptor activation inhibits cell proliferation via phosphatidylinositol 3-kinase/Akt-dependent inhibition of the extracellular signal-regulated kinase 1/2 phosphorylation in A375 human melanoma cells. Journal Of Biological Chemistry. 2005;280(20):19516–19526. doi: 10.1074/jbc.M413772200. [DOI] [PubMed] [Google Scholar]
- 12.Wu BT, Hung PF, Chen HC, Huang RN, Chang HH, Kao YH. The apoptotic effect of green tea (-)-epigallocatechin gallate on 3T3-L1 preadipocytes depends on the Cdk2 pathway. Journal Of Agricultural And Food Chemistry. 2005;53(14):5695–5701. doi: 10.1021/jf050045p. [DOI] [PubMed] [Google Scholar]