Abstract
During ventricular fibrillation (VF), electrical activation waves are fragmented and the heart cannot contract in synchrony. It has been proposed that VF waves emanate from stable periodic sources (often called “mother rotors”). The objective of the present study was to determine if stable rotors are consistently present on the epicardial surface of hearts comparable in size to human hearts. Using new optical mapping technology, we imaged VF from nearly the entire ventricular surface of 6 isolated swine hearts. Using newly developed pattern analysis algorithms, we identified and tracked VF wavefronts and phase singularities (PS: the pivot point of a reentrant wavefront). We introduce the notion of a compound rotor in which the rotor's central PS can change and describe an algorithm for automatically identifying such patterns. This prevents rotor lifetimes from being inappropriately abbreviated by wavefront fragmentation and collision events near the PS. We found that stable epicardial rotors were not consistently present during VF: only 1 of 17 VF episodes contained a compound rotor that lasted for the entire mapped interval of 4 s. However, shorter-lived rotors were common; 12.2±3.3 compound rotors with lifetime >200 ms were visible on the epicardium at any given instant. We conclude that epicardial mother rotors do not drive VF in this experimental model; if mother rotors do exist, they are intramural or septal. This paucity of persistent rotors suggests that individual rotors will eventually terminate by themselves and therefore that the continual formation of new rotors is critical for VF maintenance.
Keywords: rotor, reentry, optical mapping
Introduction
Sudden cardiac death, usually caused by ventricular fibrillation (VF), is a leading cause of death (11). During VF, the ventricles are swept by complexly interacting activation waves and the muscle does not contract in synchrony. These waves do not originate from the heart's pacing system, but from the ventricles themselves. VF is generally self-sustaining unless halted by a shock (14); however, the mechanisms maintaining VF are poorly understood. A key question is whether the multitude of activation waves that characterize VF emanate from one, or possibly a few, stable periodic sources (3, 25, 32), or whether the wave sources are transitory and widely distributed (5, 15). The first mechanism of VF is often called the mother rotor hypothesis. Although some investigators have observed these persistent sources in small hearts (3, 25), their existence in hearts comparable in size to human hearts is controversial (4). The second mechanism is often called the multiple wavelet hypothesis. Because the two mechanisms suggest different strategies for controlling VF (targeting the central source vs. global interventions), the distinction is likely to be critical in developing new rational anti-VF therapies. Some authors refer to these two basic mechanisms as Type 2 and Type 1 VF, respectively (30, 31).
Periodic wave sources in VF are generally thought to arise from reentry, which occurs when a wave circles back and reactivates tissue it has already passed through. For reentry to exist in the absence of an anatomical obstacle (i.e., a hole in the tissue or an inexcitable region), the pivoting end of the wave must contain a phase singularity (PS)—sometimes called a wave break—which is a convergence point of tissue at all phases of the action potential (8, 28). Phase, in this context, is an angular variable that specifies a patch of tissue's progression through the action potential. In 2D mapping data, a wavefront is an isoline of the phase value that corresponds to the upstroke. In 3D, a wavefront is an isosurface and the phase singularity is a 1D filament snaking through the tissue (17, 28). The intersection of this filament with a surface such as the epicardium is the PS observed in 2D mapping data. A PS has a chirality that is determined by the rotation direction of its wavefront. A singular filament with a wave rotating about it is called a rotor. We refer to rotors whose central filament intersects the epicardium as epicardial rotors.
One step in substantiating the mother rotor hypothesis in large hearts is to determine if at least one stable rotor is consistently present during VF. Previous studies that mapped portions of the swine right ventricle (22, 23, 27), left ventricle (16, 21, 22, 27), or septum (10) were unable to document such a rotor, even though relatively long-lived rotors were sometimes observed (21). However, all of these studies mapped only a limited region, typically 20-40 cm2, admitting the possibility that a mother rotor was present, but located in an unmapped region.
The objective of the present study was to map from the entire epicardial surface of a large heart preparation to determine by direct observation if stable epicardial rotors are consistently present during VF. This was accomplished using a newly developed optical mapping system that merges fluorescence data acquired from 4 high-speed video cameras into a single continuous dataset (12) and newly developed algorithms that identify and track wavefronts and PSs as they move over the epicardium. In addition, we introduce the notion of a compound rotor in which the central PS can change and describe an algorithm for automatically identifying such patterns.
Methods
Animal Preparation
The use of experimental animals in this study was approved by the Institutional Animal Care and Use Committee at the University of Alabama at Birmingham. We studied six isolated, perfused swine hearts. The animals were healthy mixed breed pigs of either sex (weight 23±4 kg, range 21.0-30.2 kg). Details of anesthesia, heart excision, and Langendorff perfusion have been described previously (18). These previous methods were slightly modified by placing a suction tube in each ventricle to remove perfusate, preventing it from running over the epicardium and distorting optical signals. The circulating volume of perfusate was 1.5 L and the flow rate was 200 ml/min. Fresh perfusate was continuously added to the system at 25 ml/min. When the perfusate reservoir exceeded a set level, a valve automatically opened to discard perfusate and restore the target volume.
Panoramic Optical Mapping
We used a newly developed optical mapping system that records electrical activity from nearly the entire ventricular epicardium (the tip of the apex is not well imaged and is generally obscured by dripping perfusate). Figure 1 shows a schematic of the system. The shape of the epicardium is acquired with the rotating geometry camera. Electrical activity is recorded using a voltage sensitive dye and the mapping cameras. The movies from the mapping cameras are merged into one dataset by mapping them onto the epicardial geometry. Details are as previously described (12) with the following exceptions:
Figure 1.
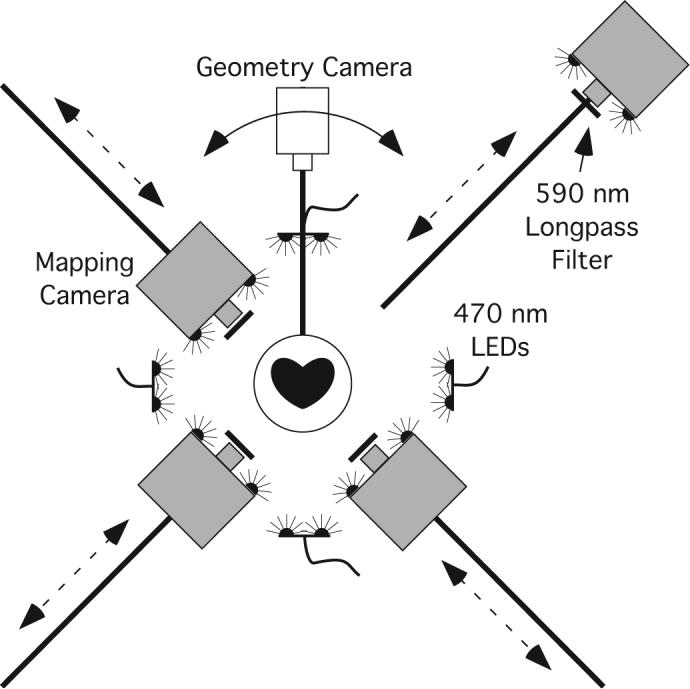
Panoramic optical mapping system. The geometry camera is mounted on a rotating arm. Images are acquired every 5 degrees and used to reconstruct the epicardial geometry. The mapping cameras are track-mounted and can be positioned close to the heart for mapping or backed away for geometry scans. Excitation light is provided by 32 blue LEDs. Emitted fluorescence is filtered by 590 nm lens-mounted longpass filters.
1) The time required for an epicardial scan (one rotation of the geometry camera) has been reduced from 9 minutes to 70 seconds.
2) We replaced the original dual mapping cameras with 4 high-speed CCD cameras (iXon DV860, Andor Technology, South Windsor, CT). The cameras are positioned around the heart in 90° increments (128×64 pixels in each view). Final spatial resolution with this system is ∼1.6 mm and temporal sampling is 750 fps. The cameras are synchronized using a computer controlled PCI timing board (PCI-CTR05, Measurement Computing Corporation). Each mapping camera is fitted with a 2.2mm, F/1.0, 1/4” format video lens (Pentax, Golden, CO) and positioned approximately 10 cm from the heart. The cameras are mounted on a track so they can be backed out of the way of the geometry camera while it circles the heart and then be returned accurately to the mapping position.
3) Excitation light is now provided by 32 blue light emitting diodes (LEDs, Luxeon V Star, 470 nm, Lumileds Lighting, LLC, San Jose, CA). Each LED dissipates 5 W with luminous flux of 48 lumens. Six LEDs are mounted on the front of each mapping camera and two are mounted on each of four positionable arms.
Study Protocol
Hearts were immobilized with 2,3-butanedione monoxime (BDM, 20 mM) to eliminate contraction artifacts in the optical signals and stained with a 5-7 ml bolus of the voltage-sensitive dye di-4- ANEPPS (15 μM). The hearts were periodically restained during the study if signal amplitude decreased. After an approximately 30 minute interval for the preparation to stabilize (12), the following procedure was repeated three times: 1) scan the epicardial geometry; 2) optically map four seconds of a paced rhythm; 3) induce VF by applying a 9V battery to the right ventricle; 4) ∼20 seconds after induction, optically map 4 seconds of VF; 5) defibrillate with a minimum reliable-strength shock (5-20 J) delivered through external paddles. One induction resulted in a monomorphic tachycardia rather than VF; this episode was excluded from analysis. We therefore analyzed a total of 17 VF episodes. At the end of each experiment, all cameras were calibrated as previously described (12).
Geometric Reconstruction and Decimation
Using images collected by the geometry camera at 5° increments, the epicardial models were constructed with sub-millimeter resolution (12). However, because analysis of VF wavefronts requires only about 1-2 mm spatial resolution (1), we subsequently reduced the spatial resolution of each model to ∼1.6 mm. In this procedure, 2300 points are randomly scattered onto the surface of the high-resolution model. The points are then moved about the surface under the influence of an iterative mutual repulsion function to achieve approximately equal spacing (26). A new triangular mesh is then formed from this set of points using the alpha shapes suite of programs (6). Triangles in the new mesh were typically spaced by ∼1.6 mm (centroid-to-centroid). This procedure occasionally produced topological defects in the output mesh (e.g., more than two triangles meeting along an edge). These defects were repaired with an interactive program. The model was further corrected so that the three vertices for each triangle in the mesh were listed counterclockwise when viewed from the outside. This ensured that the normal vectors for each triangle pointed away from the center of the model.
Texture Mapping of Fluorescence Data
Background-subtracted fluorescence data from the high-speed cameras were texture mapped onto the decimated epicardial models using a modification of our previously described procedure (12). In the modified method, the vertices of each triangle in the mesh are projected onto the image plane of the camera(s) that optimally map the triangle (using previously described optimization rules (12)). The fluorescence assigned to the triangle is a weighted average of fluorescence from each pixel that falls completely or partially within the triangle in the image plane. Pixel weights are determined by the percentage of the pixel that falls within the projected triangle. The fluorescence for triangles that are optimally mapped by more than one camera is a weighted average of the triangle data from each camera image, where weights are determined by the distance of the triangle to the edge of the heart (12).
In one typical geometry, the resolution of the mapping camera images was 1.42±0.05 mm (mean ± std). The triangles in the mesh were spaced by1.61±0.16 mm (centroid-to-centroid). Triangles received contributions from 8.6±2.6 image plane pixels. Thus, texture mapping imposed some spatial smoothing on the fluorescence data. After texture mapping, the signal for each triangle was temporally smoothed using a lowpass Butterworth filter (55 Hz passband, 65 Hz stopband, 3 dB passband loss, 10 dB stopband attenuation) and then normalized to the range 0:100. Spatial and temporal smoothing is useful to reduce high-frequency shot noise present in the optical recordings. Without smoothing, spurious signal fluctuations can cause temporary wavebreaks to appear in activation wavefronts and inappropriately increase the number of very short-lived PSs registered by our analysis algorithms. Filtering may obscure fine spatial and temporal details of the activation patterns, but should not affect the macroscopic, long-lived patterns that are the primary focus of this study.
All optical recordings were mapped onto the geometric model acquired most recently before the mapping run. The atria and regions with poor signals acquired during pacing were clipped from the model using an interactive program. Such regions typically included small fat-obscured areas at the atrioventricular groove, and the tip of the apex, which was poorly imaged by all mapping cameras and was also obscured by dripping perfusate.
Wavefront and Phase Singularity Analysis
The resulting VF datasets were processed with newly developed algorithms that automatically identify PSs and wavefronts and construct data structures that describe wavefront-wavefront, PS-wavefront, and PS-PS relationships (20).Wavefront-wavefront interactions are codified in a directed graph (2) in which the graph edges are wavefronts and the vertices are wavefront initiation, termination, or contact events (20, 24). Contact events include fragmentations, in which one parent wavefront breaks up into two or more child wavefronts, and collisions, in which two or more parent wavefronts collide and coalesce to produce a single child wavefront. We call this data structure a wavefront graph. Figure 2 shows a simple example.
Figure 2.
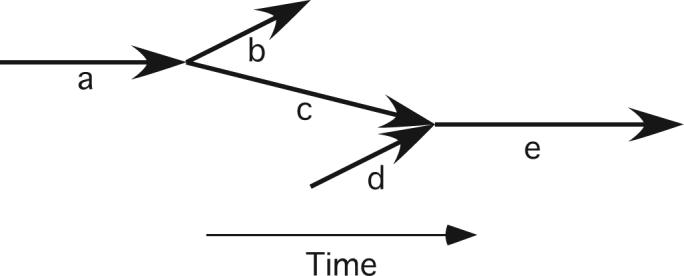
A simple wavefront graph. Each bold arrow represents a wavefront. The horizontal positions of a wavefront's endpoints locate the wavefront in time. The vertical positions are not significant. There are two wavefront contact events: wavefront a fragments into wavefronts b and c and wavefronts c and d collide and coalesce to form wavefront e.
Compound Rotors
In the traditional definition of a rotor, a wavefront propagates about a single PS. The rotor terminates when its PS is annihilated by collision with a PS of opposite chirality or with a boundary (8). However, we commonly observed wave fragmentation or collision events near the PS at the tip of a rotating wavefront. In such events, the original PS was annihilated, but a child wavefront continued to rotate in the same direction about a new PS in very nearly the same position. Figure 3 shows an example of this phenomenon. In panel A, wavefront 1 is rotating counterclockwise about PS i. By panel B, wavefront 1 has fragmented into wavefronts 2 and 3. Wavefront 3 contains the original PS i in addition to a new PS of opposite chirality (gray triangle). Wavefront 2 contains another new PS, ii, with the same chirality as i. By panel C, wavefront 3 has contracted allowing the oppositely rotating PSs on either end to annihilate each other and terminate the wavefront. One of the annihilated PSs is the original PS i. However, wavefront 2 now propagates about the new PS ii much as wavefront 1 propagated about PS i. It can be argued that such a pattern constitutes reentry about a single organizing center even though the central PS changes.
Figure 3.
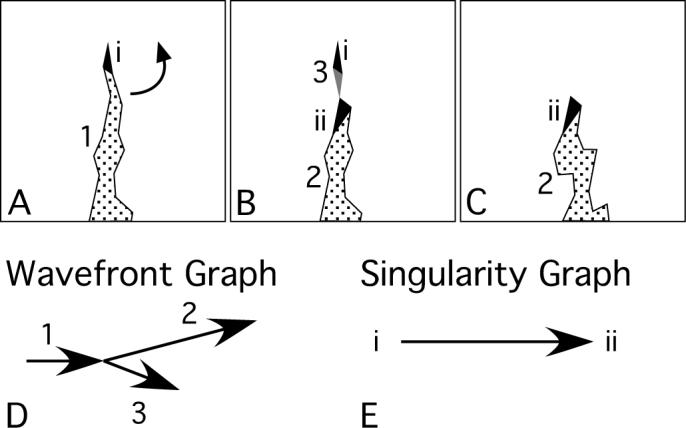
A compound rotor with two sequential phase singularities. In panels A-C, the black and gray triangles are PSs of opposite chirality and the stippled regions are wavefronts. The arrow in A indicates the direction of rotation about the PS. Panel D is the wavefront graph of the activation pattern in A-C. Panel E is the singularity graph of the black PSs.
We developed an algorithm to automatically detect these events. We create, for each VF episode, two new directed graphs (2) called singularity graphs. There is one such graph for each of the two chiralities. To generate a singularity graph, we first set the chirality-appropriate PSs to be the singularity graph's nodes. We then iterate over all contact events in the VF episode's wavefront graph. The wavefront graph for the activation pattern in Figure 3 A-C is shown in panel D. This graph contains one contact event, the fragmentation of wavefront 1 into wavefronts 2 and 3. For each contact, we identify the PSs that continue through the contact (e.g., PS i) and those that either begin or end at the contact. PS ii is an example of a beginning PS. We compute the spatial distance between each continuing PS and each beginning or ending PS. If this distance is no more than 5 triangle-to-triangle hops (∼8 mm), a graph edge is added between the two corresponding PSs. The edges are directed from continuing-to-beginning or ending-to-continuing PSs. The singularity graph for the black singularities in Figure 3 A-C is shown in panel E. There are two nodes (i and ii) and a single edge directed from i to ii.
Although we have described the algorithm with a fragmentation event, it works in the same way for collisions. For example, if the flow of time is reversed in Figure 3, wavefront 3 appears de novo on the epicardium and coalesces with wavefront 2 to form wavefront 1. In this situation, PS i is again a continuing PS and PS ii is an ending PS. In the singularity graph, the arrow is directed from ii to i.
A singularity graph may contain multiple subgraphs each of which is disconnected from all other subgraphs. In graph theory, each of these subgraphs is called a component of the full graph (2). In the limiting case of a VF episode in which no events such as the one depicted in Figure 3 A-C occurred, both singularity graphs (one for each chirality) would consist only of nodes with no connecting edges. Each node would therefore be its own component. The singularity graph in Figure 3 E is the opposite limiting case: all nodes are connected by edges and the entire graph therefore consists of a single component spanning all PSs. We treat each singularity graph component as a compound rotor. A compound rotor contains one or more PSs, all of which have the same chirality. The number of PSs in the compound rotor is the number of nodes in the singularity graph component. Its lifetime spans the lifetimes of all of its constituent PSs
Results
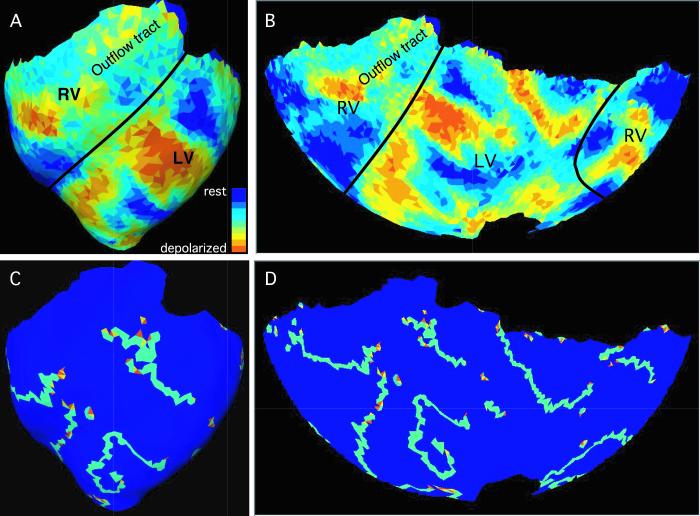
We studied a total of 17 VF episodes in 6 hearts. Each episode was mapped for 4 s starting approximately 20 s after induction. Figure 4 shows a snapshot of a panoramically mapped VF episode. Panels A and B show fluorescence and panels C and D show the wavefronts and PSs found by our algorithms. Movies S1 and S2 animate the entire episode.
Figure 4.
One frame of a VF episode (episode 6 in Table 1). Panels A and B show fluorescence data. The black lines indicate the approximate boundary between the right and left ventricles. Panels C and D show the wavefronts (light blue triangles) and phase singularities found in the same frame. Yellow and orange phase singularities have opposite chiralities. Panels A and C show an anterior view of the reconstructed epicardial geometry. In panels B and D, a Hammer map projection is used to show the entire epicardium. Movies S1 and S2 animate all frames from this episode.
Over all VF episodes, we observed 310,356 PSs. Most PSs were very short in duration: 65% had lifetimes less than 10 ms and 99.6% were less than 200 ms (PSs lasting longer then 200 ms have completed at least one cycle of reentry, but less than two). Figure 5 shows a histogram of all PS lifetimes (black bars; note the log scale). Only one PS persisted for its entire mapped interval.
Figure 5.
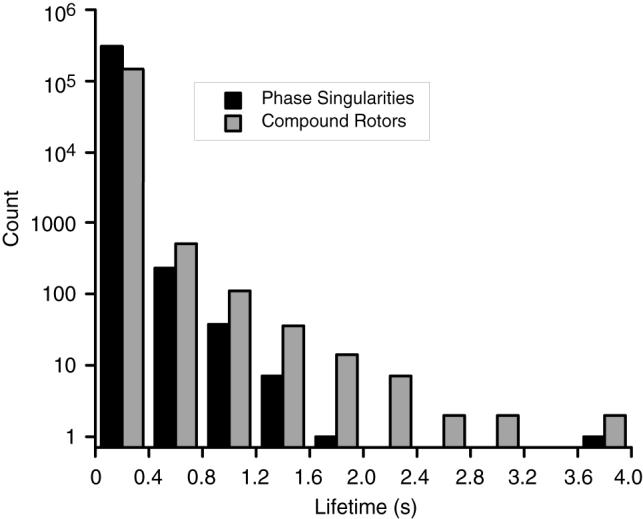
Distribution of phase singularity (black) and compound rotor (gray) lifetimes. Data from all VF episodes are lumped. Note the log scale.
Combining PSs into compound rotors substantially prolonged lifetimes (Figure 5, gray bars). Over all VF episodes, there were 1.6±2.0 (mean±std) PSs per compound rotor. 79% of compound rotors had only one PS and an additional 10% had only two. The compound rotor with the most PSs had 80.
Figure 6 shows the distribution of compound rotor lifetimes exceeding 200 ms averaged across episodes. Compound rotors lasting longer than 1 s were rare. The lifetime of the longest-lived compound rotor from each episode is listed in Table 1. One episode contained two compound rotors that persisted for the entire mapped interval (episode 11; the listed time is slightly less than 4.0 s because a few temporal samples were removed from either end of the episode as part of the filtering process). Movie S3 animates this episode. None of the other episodes contained a compound rotor that persisted for the entire mapped interval.
Figure 6.
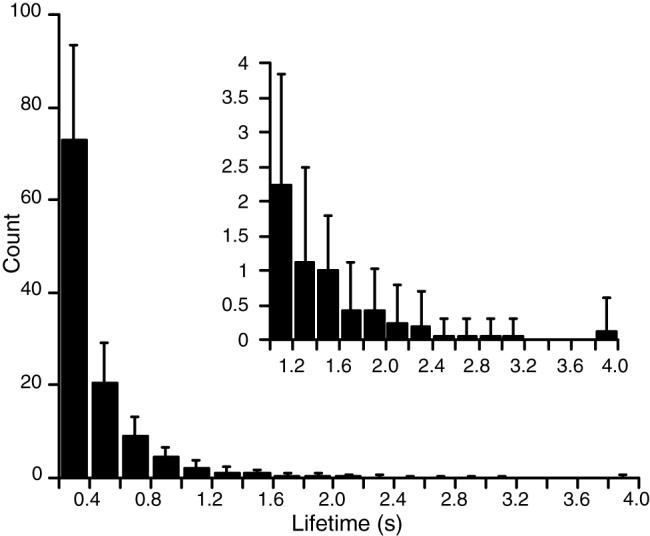
Lifetime distribution for compound rotors that lasted longer than 200 ms. The bars are averages across episodes. Error bars are standard deviations. The inset is an expansion showing lifetimes exceeding 1.0 s.
Table 1.
Compound Rotor Parameters per Episode
| Animal | Episode | maxLifetime* (s) | nRotors† |
|---|---|---|---|
| 1 | 1 | 1.001 | 8.8 ± 2.2 |
| 1 | 2 | 1.289 | 11.9 ± 2.4 |
| 1 | 3 | 1.120 | 9.2 ± 2.8 |
| 2 | 4 | 1.480 | 9.1 ± 3.4 |
| 2 | 5 | 1.404 | 9.4 ± 3.0 |
| 2 | 6 | 1.916 | 12.9 ± 3.4 |
| 3 | 7 | 1.876 | 15.7 ± 3.8 |
| 3 | 8 | 2.665 | 13.9 ± 3.0 |
| 4 | 9 | 3.081 | 11.3 ± 2.7 |
| 4 | 10 | 1.953 | 9.7 ± 2.5 |
| 4 | 11 | 3.981 | 8.1 ± 2.3 |
| 5 | 12 | 1.761 | 12.1 ± 3.1 |
| 5 | 13 | 2.047 | 20.3 ± 4.8 |
| 5 | 14 | 2.425 | 10.4 ± 2.7 |
| 6 | 15 | 1.877 | 14.4 ± 3.0 |
| 6 | 16 | 1.457 | 13.9 ± 3.5 |
| 6 | 17 | 2.292 | 16.7 ± 3.8 |
Maximum compound rotor lifetime
Mean number of compound rotors present at any instant (± std)
Table 1 lists the mean number of compound rotors exceeding 200 ms that were present at one time in each episode. The mean over all episodes was 12.2±3.3. Figure 7 is an example of how the number of compound rotors fluctuates with time. We fit a straight line to these data for each episode (e.g., the dotted line in Figure 7). The mean slope of the regression line over all episodes was −0.3±1.0 s−1. This number was not significantly different from 0 by t-test (p>0.2); thus the number compound rotors did not consistently increase or decrease during the mapped interval.
Figure 7.
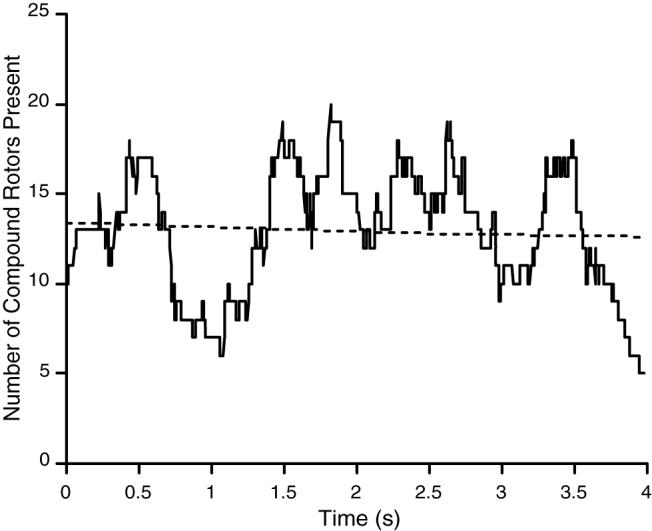
Temporal fluctuation in the number of compound rotors (with lifetimes exceeding 200 ms) simultaneously present on the epicardium. Data are from episode 6 in Table 1. The dotted line is a linear regression line.
Discussion
In the present study, we mapped epicardial activation patterns during VF in isolated swine hearts. We analyzed 4-second intervals starting approximately 20 s after induction. This corresponds to Wiggers' stage II VF, which is clinically relevant because it is the time during which implantable defibrillators deliver therapy. Our major finding is that stable epicardial rotors are not consistently present during VF in this experimental model.
Compound Rotors
In the strictest sense, the sequence shown in Figure 3 contains two counterclockwise rotors: one that rotates about singularity i and terminates with the termination of wavefront 3, and another that rotates about singularity ii and is formed when wavefront 1 fragments into wavefronts 2 and 3. We argue that sequences such as this should be regarded as a single rotating entity even though the central PS changes. We therefore introduced the notion of a compound rotor, which allows multiple PSs to be associated with a single rotor, and described an objective and automatic algorithm for identifying these entities. In essence, this algorithm allows small-scale fragmentation and collision events near rotor tips to be neglected when associating PSs and wavefronts with rotors. This guards against such events (which may be noise artifacts) from resulting in inappropriately abbreviated rotor lifetimes. The use of this relaxed definition of a rotor, which has the effect of registering rotor lifetimes that are longer than those for traditional single-PS rotors, is particularly important for the present study because it amplifies our major finding that individual rotor lifetimes are generally shorter than the duration of VF.
Rotor Lifetimes
All 17 VF episodes contained compound rotors last lasted for hundreds of milliseconds and each had at least one compound rotor that lasted for 1 s or more. However, a compound rotor cannot drive the VF episode (i.e., be a mother rotor) unless it persists for the entire episode. Only one of the 17 VF episodes we analyzed contained compound rotors that lasted for the entire mapped interval. Previous epicardial mapping studies were unable to document mother rotors in either the left (16, 21, 22) or right (22, 23) ventricle. However, these studies could not exclude epicardial mother rotors because only limited epicardial regions were sampled. In the present study, we used a newly developed optical mapping system (12) that can identify and track VF wavefronts across nearly the entire epicardium. Thus we extend the previous results and exclude stable epicardial rotors (with the possible exception of a rotor at the very tip of the apex) as a requirement for VF maintenance in this experimental model.
The possibility still exists that VF in pig hearts is driven by a stable mother rotor whose filament does not intersect the epicardium and therefore cannot be observed directly with epicardial mapping. However, stable mother rotors were not observed in studies mapping limited nonepicardial regions including the septum (10) and sections across the right (27) and left (21, 27) ventricular free walls. Further studies are needed to confirm or exclude the presence of stable nonepicardial mother rotors.
Despite the paucity of compound rotors that persisted for the entire mapped interval, shorter-lived rotors were common. We found that at any given instant, roughly a dozen (with lifetimes of at least 200 ms) were simultaneously present on the epicardium. These data suggest that the formation of new rotors is critical for VF maintenance because once started, rotors will eventually die out by themselves. This implies that rotor formation may be a more attractive target than rotor termination in the development of new anti-VF therapies.
Limitations
In the present study, we imaged VF activation patterns with high spatial (∼1.6 mm) and temporal (750 frames per second) resolution over the great majority of the swine epicardial surface. However, patterns within the ventricular walls were not recorded. The study focused on VF relatively early after induction (Wiggers' Stage II). Activation patterns are known to change as VF proceeds (9, 29), so our findings may not apply to more prolonged VF. We mapped isolated perfused swine hearts that were exposed to BMD to eliminate motion artifacts in the optical recordings. Other species were not studied. We previously found that VF patterns in this preparation are slower and more regular than those in the same hearts before excision (18). Other authors have found that BDM converts VF to a stable tachycardia in isolated ventricular tissue from dogs (19) and pigs (13). In addition, Evans et al. used BDM to stabilize reentry to create a model of monomorphic VT in rabbit hearts (7). Thus, because of the slowing and stabilization effects of heart isolation and BDM on VF, we expect that rotor lifetimes are substantially shorter in intact hearts than they were in the present study.
Supplementary Material
Acknowledgments
We thank C. Killingsworth, F. Vance, and R. Collins for veterinary support. MWK is currently with the Department of Physiology and Pharmacology, The George Washington University, Washington DC. JDG is currently with the Department of Medicine, University of Alabama at Birmingham.
Footnotes
Grants
This work was supported in part by NIH grant HL64184 (JMR) and a grant from the Whitaker Foundation (MWK).
References
- 1.Bayly PV, Johnson EE, Idriss SF, Ideker RE, Smith WM. Efficient electrode spacing for examining spatial organization during ventricular fibrillation. IEEE Trans Biomed Eng. 1993;40:1060–1066. doi: 10.1109/10.247805. [DOI] [PubMed] [Google Scholar]
- 2.Chachra V, Ghare PM, Moore JM. Applications of Graph Theory Algorithms. North Holland; New York: 1979. [Google Scholar]
- 3.Chen J, Mandapati R, Berenfeld O, Skanes AC, Jalife J. High frequency periodic sources underlie ventricular fibrillation in the isolated rabbit heart. Circ Res. 2000;86:86–93. doi: 10.1161/01.res.86.1.86. [DOI] [PubMed] [Google Scholar]
- 4.Chen PS, Weiss JN. Runaway pacemakers in ventricular fibrillation. Circulation. 2005;112:148–150. doi: 10.1161/CIRCULATIONAHA.105.548669. [DOI] [PubMed] [Google Scholar]
- 5.Choi BR, Nho W, Liu T, Salama G. Life span of ventricular fibrillation frequencies. Circ Res. 2002;91:339–345. doi: 10.1161/01.res.0000031801.84308.f4. [DOI] [PubMed] [Google Scholar]
- 6.Edelsbrunner H, Mücke E. Three-dimensional alpha shapes. ACM Transactions on Graphics. 1994;13:43–72. [Google Scholar]
- 7.Evans F, Gray R, Ideker R. Global effects of shocks on epicardial transmembrane potential. PACE. 2000;23:609. [Google Scholar]
- 8.Gray RA, Pertsov AM, Jalife J. Spatial and temporal organization during cardiac fibrillation. Nature. 1998;392:75–78. doi: 10.1038/32164. [DOI] [PubMed] [Google Scholar]
- 9.Huang J, Rogers JM, Killingsworth CR, Singh KP, Smith WM, Ideker RE. Evolution of activation patterns during long-duration ventricular fibrillation in dogs. Am J Physiol Heart Circ Physiol. 2004;286:H1193–1200. doi: 10.1152/ajpheart.00773.2003. [DOI] [PubMed] [Google Scholar]
- 10.Huang J, Walcott GP, Killingsworth CR, Melnick SB, Rogers JM, Ideker RE. Quantification of activation patterns during ventricular fibrillation in open-chest porcine left ventricle and septum. Heart Rhythm. 2005;2:720–728. doi: 10.1016/j.hrthm.2005.03.025. [DOI] [PubMed] [Google Scholar]
- 11.Huikuri H, Castellanos A, Myerburg R. Sudden death due to cardiac arrhythmias. N Engl J Med. 2001;345:1473–1482. doi: 10.1056/NEJMra000650. [DOI] [PubMed] [Google Scholar]
- 12.Kay MW, Amison PM, Rogers JM. Three-dimensional surface reconstruction and panoramic optical mapping of large hearts. IEEE Trans Biomed Eng. 2004;51:1219–1229. doi: 10.1109/TBME.2004.827261. [DOI] [PubMed] [Google Scholar]
- 13.Lee MH, Lin SF, Ohara T, Omichi C, Okuyama Y, Chudin E, Garfinkel A, Weiss JN, Karagueuzian HS, Chen PS. Effects of diacetyl monoxime and cytochalasin D on ventricular fibrillation in swine right ventricles. Am J Physiol Heart Circ Physiol. 2001;280:H2689–2696. doi: 10.1152/ajpheart.2001.280.6.H2689. [DOI] [PubMed] [Google Scholar]
- 14.Manoach M, Watanabe Y. How can we facilitate spontaneous termination of ventricular fibrillation and prevent sudden cardiac death? A working hypothesis. J Cardiovasc Electrophysiol. 1995;6:584–590. doi: 10.1111/j.1540-8167.1995.tb00433.x. [DOI] [PubMed] [Google Scholar]
- 15.Moe GK, Reinboldt WC, Abildskov JA. A computer model of atrial fibrillation. Am Heart J. 1964;67:200–220. doi: 10.1016/0002-8703(64)90371-0. [DOI] [PubMed] [Google Scholar]
- 16.Nanthakumar K, Huang J, Rogers JM, Johnson PL, Newton JC, Walcott GP, Justice RK, Rollins DL, Smith WM, Ideker RE. Regional differences in ventricular fibrillation in the open-chest porcine left ventricle. Circ Res. 2002;91:733–740. doi: 10.1161/01.res.0000038945.66661.21. [DOI] [PubMed] [Google Scholar]
- 17.Pertsov AM. Scroll waves in three dimensions. In: Zipes DP, Jalife J, editors. Cardiac Electrophysiology, From Cell to Bedside. 4th ed. W.B. Saunders; Philadelphia: 2004. [Google Scholar]
- 18.Qin H, Kay MW, Chattipakorn N, Redden DT, Ideker RE, Rogers JM. Effects of heart isolation, voltage-sensitive dye, and electromechanical uncoupling agents on ventricular fibrillation. Am J Physiol, Heart Circ Physiol. 2003;284:H1818–H1826. doi: 10.1152/ajpheart.00923.2002. [DOI] [PubMed] [Google Scholar]
- 19.Riccio ML, Koller ML, Gilmour RF. Electrical restitution and spatiotemporal organization during ventricular fibrillation. Circ Res. 1999;84:955–963. doi: 10.1161/01.res.84.8.955. [DOI] [PubMed] [Google Scholar]
- 20.Rogers JM. Combined phase singularity and wavefront analysis for optical maps of ventricular fibrillation. IEEE Trans Biomed Eng. 2004;51:56–65. doi: 10.1109/TBME.2003.820341. [DOI] [PubMed] [Google Scholar]
- 21.Rogers JM, Huang J, Melnick SB, Ideker RE. Sustained reentry in the left ventricle of fibrillating pig hearts. Circ Res. 2003;92:539–545. doi: 10.1161/01.RES.0000061569.23879.20. [DOI] [PubMed] [Google Scholar]
- 22.Rogers JM, Huang J, Pedoto RW, Walker RG, Smith WM, Ideker RE. Fibrillation is more complex in the left ventricle than the right ventricle. J Cardiovasc Electrophysiol. 2000;11:1364–1371. doi: 10.1046/j.1540-8167.2000.01364.x. [DOI] [PubMed] [Google Scholar]
- 23.Rogers JM, Huang J, Smith WM, Ideker RE. Incidence, evolution, and spatial distribution of functional reentry during ventricular fibrillation in pigs. Circ Res. 1999;84:945–954. doi: 10.1161/01.res.84.8.945. [DOI] [PubMed] [Google Scholar]
- 24.Rogers JM, Usui M, KenKnight BH, Ideker RE, Smith WM. A quantitative framework for analyzing epicardial activation patterns during ventricular fibrillation. Ann Biomed Eng. 1997;25:749–760. doi: 10.1007/BF02684159. [DOI] [PubMed] [Google Scholar]
- 25.Samie FH, Berenfeld O, Anumonwo J, Mironov SF, Udassi S, Beaumont J, Taffet S, Pertsov AM, Jalife J. Rectification of the Background Potassium Current: A Determinant of Rotor Dynamics in Ventricular Fibrillation. Circ Res. 2001;89:1216–1223. doi: 10.1161/hh2401.100818. [DOI] [PubMed] [Google Scholar]
- 26.Turk G. Re-Tiling Polygonal Surfaces. Comput Graph. 1992;26:55–64. [Google Scholar]
- 27.Valderrabano M, Lee MH, Ohara T, Lai AC, Fishbein MC, Lin SF, Karagueuzian HS, Chen PS. Dynamics of intramural and transmural reentry during ventricular fibrillation in isolated swine ventricles. Circ Res. 2001;88:839–848. doi: 10.1161/hh0801.089259. [DOI] [PubMed] [Google Scholar]
- 28.Winfree AT. When Time Breaks Down. Princeton University Press; Princeton: 1987. [Google Scholar]
- 29.Witkowski FX, Leon LJ, Penkoske PA, Giles WR, Spano ML, Ditto WL, Winfree AT. Spatiotemporal evolution of ventricular fibrillation. Nature. 1998;392:78–82. doi: 10.1038/32170. [DOI] [PubMed] [Google Scholar]
- 30.Wu TJ, Lin SF, Baher A, Qu Z, Garfinkel A, Weiss JN, Ting CT, Chen PS. Mother rotors and the mechanisms of D600-induced type 2 ventricular fibrillation. Circulation. 2004;110:2110–2118. doi: 10.1161/01.CIR.0000143834.51102.91. [DOI] [PubMed] [Google Scholar]
- 31.Wu TJ, Lin SF, Weiss JN, Ting CT, Chen PS. Two types of ventricular fibrillation in isolated rabbit hearts: importance of excitability and action potential duration restitution. Circulation. 2002;106:1859–1866. doi: 10.1161/01.cir.0000031334.49170.fb. [DOI] [PubMed] [Google Scholar]
- 32.Zaitsev AV, Berenfeld O, Mironov SF, Jalife J, Pertsov AM. Distribution of excitation frequencies on the epicardial and endocardial surfaces of fibrillating ventricular wall of the sheep heart. Circ Res. 2000;86:408–417. doi: 10.1161/01.res.86.4.408. [DOI] [PubMed] [Google Scholar]
Associated Data
This section collects any data citations, data availability statements, or supplementary materials included in this article.


