
Figure 1.
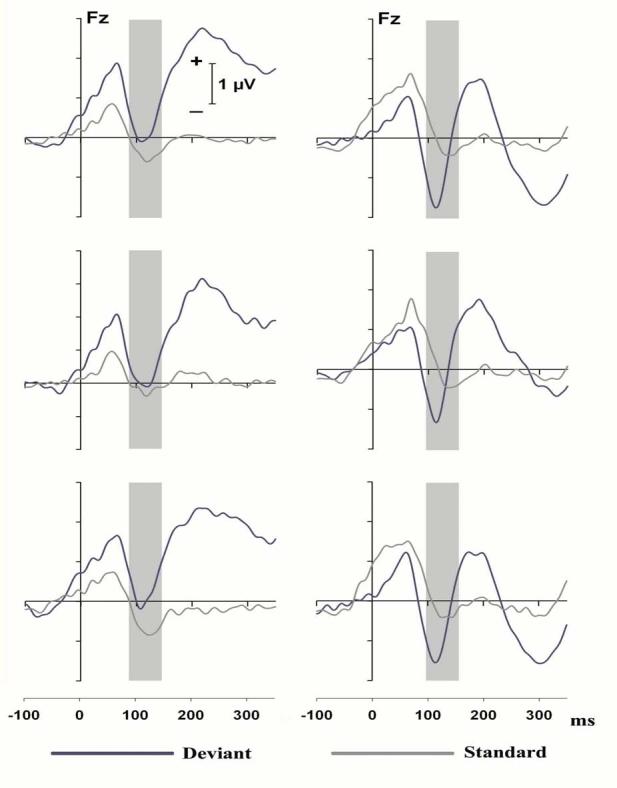
Top panels: grand mean ERPs at Fz for all 20 subjects for switch (blue curves) and standard trials (gray curves) presented to the left (left panel) and right (right panel) ear. Middle and bottom panels: similar grand mean ERPs for the first 10 (middle panels) and the second 10 (bottom panels) subjects. Vertical bars indicate the area of interest.