Abstract
During ventricular fibrillation (VF), activation waves are fragmented and the heart cannot contract synchronously. It has been proposed that VF waves emanate from stable sources (“mother rotors”). Previously, we used new optical mapping technology to image VF wavefronts from nearly the entire epicardial surface of six isolated swine hearts. We found that VF was not driven by epicardial rotors, but could not exclude the presence of stable rotors hidden within the ventricular walls. Here, we use graph theoretic analysis to show that, in all 17 VF episodes we analyzed, it was always possible to trace sequences of wavefronts through series of fragmentation and collision events from the beginning to the end of the episode. The set of wavefronts that were so related (the dominant component) consisted of 92% ± 1% of epicardial wavefronts. Because each such wavefront sequence constitutes a continuous activation front, this finding shows that complete reentrant pathways were always present on the epicardial surface and therefore, that wavefront infusion from nonepicardial sources was not strictly necessary for VF maintenance. These data suggest that VF in this model is not driven by localized sources; thus, new anti-VF treatments designed to target such sources may be less effective than global interventions.
INTRODUCTION
Ventricular fibrillation (VF) is characterized by a multitude of complexly interacting activation waves. Despite decades of research, the mechanisms by which these waves arise and are sustained are poorly understood. The classical view is that wavefronts fragment when they encounter local regions that recover more slowly than surrounding regions. This results in multiple wandering wavelets that follow constantly changing pathways about transitory islands of refractoriness (1). In this multiple wavelet scenario, VF is a spatially distributed phenomenon driven by constant formation of new wavelets. The patchy heterogeneity that underlies it could be a static feature of the myocardium, or it could be generated dynamically by the activation pattern (2). An alternative proposal is that VF is driven by a stable, persistent periodic source (3–5). As wavefronts propagate away from the source, they break up on small heterogeneities, which results in the complex patterns characteristic of VF. The periodic source is thought to be a rotor—a vortex-like rotating wavefront (6). In this scenario, VF is locally driven. Because all wavefronts emanate from the stable rotor, it is often called a mother rotor. In three-dimensional tissue, rotors circulate about a one-dimensional singular filament that snakes through the tissue (6,7). When this filament intersects the surface of the heart, rotors can be recognized as such by surface mapping. When it does not, wavefronts emanating from the rotor appear de novo on the epicardium as breakthrough wavefronts (6,7).
Considerable controversy surrounds the question of whether VF is locally driven or a distributed phenomenon. Although some investigators have found evidence for a local driving source in small hearts (3,4), other investigators have been unable to document such sources even in very similar preparations (8,9). The discrepancy may be due to differences in the solutions used to perfuse the preparations (10). In large hearts, some investigators have presented evidence that VF is driven by local periodic drivers, either stationary (5,11) or mobile (12). However, a number of other studies that mapped limited regions of the heart were unable to document a driving rotor during VF (13–18). Nash et al. mapped VF patterns in patients undergoing cardiac surgery and reported that epicardial rotors were sometimes present and could sweep the entire ventricles for several cycles, but were not the sole drivers of VF (19).
In a previous study, using a newly developed panoramic optical mapping system to map from nearly the entire ventricular epicardium, we excluded stable persistent epicardial rotors as the drivers of early VF (∼20 s post induction) in the isolated pig heart (20). Thus, if mother rotors drive VF in this model, they must be hidden within the ventricular walls—in other words, their filaments do not contact the surface where they can be seen. It is currently infeasible to map from within the ventricular walls with sufficient spatial resolution to confirm or exclude the presence of intramural or septal mother rotors by direct observation. However, global epicardial maps contain a great deal of information that can be exploited to test indirectly for their presence. In this study, we use graph theoretic analysis of epicardial mapping data to show that infusion of wavefronts from intramural or septal sources is not strictly necessary for VF maintenance; rather wavefronts visible on the epicardium are sufficient to maintain continuous activation.
METHODS
Animal preparation and data collection
Animal preparation and collection of the data analyzed for this study were previously described in detail (20). Briefly, we studied six isolated, perfused hearts from healthy, young, mixed-breed pigs of either sex (weight: 23 ± 4 kg). We studied three VF episodes in each of five animals and two episodes in a 6th (17 total episodes). The hearts were immobilized with 2,3-butanedione monoxime (BDM, 20 mMol) and stained with the voltage-sensitive dye di-4-ANEPPS. We induced VF by applying a 9-V battery to the right ventricle. We mapped VF activation patterns for 4 s beginning ∼20 s after induction. VF cycle length was typically ∼125 ms, so 4 s is a sample of ∼30 cycles. VF patterns were recorded using a newly developed panoramic optical mapping system that can map from nearly the entire epicardial surface at ∼1.6 mm spatial resolution and 750 frames/s (20,21). The system employs 32 high-power blue light emitting diodes for excitation light (470 nm) and 4 fast CCD video cameras for recording the emitted fluorescence through 590 nm longpass filters. The fluorescence contains a signal proportional to the transmembrane potential. The epicardial geometry is reconstructed by a 5th video camera that rotates about the heart and acquires images every 5°. These images are processed to produce a geometric model composed of a mesh of approximately equal-sized triangles spaced by ∼1.6 mm (centroid-to-centroid). Background-subtracted fluorescence from the four high-speed cameras are merged into a single continuous data set by texture mapping the data onto the model of the epicardium. The signal associated with each mesh triangle is normalized to the range 0–100.
Wavefront identification
We processed the VF data sets using recently developed analysis algorithms that identify activation wavefronts and characterize their interrelationships (22). Briefly, each normalized fluorescence signal is converted to phase (23) by detrending the signal and plotting it against its integral. The resulting trajectory circles the origin of this phase plane. The phase for each temporal sample is found by converting the phase plane to a polar coordinate system and taking the angular coordinate of the point (22). Because phase has a unique value as a patch of tissue progresses through an action potential (as opposed to transmembrane potential, which has the same value upon depolarization and again during repolarization), phase simplifies identification of wavebreaks and wavefronts during VF. In the phase representation, singular points (points surrounded by tissue at all phases of the action potential) reveal wavebreaks (24), which are the points about which functionally reentrant waves rotate (6,23). Wavefronts are isolines of the phase value that corresponds to the upstroke (−π/2). Wavefronts must either be closed loops, or be terminated in space by phase singularities or a boundary (22,23). With the spatial and temporal resolution used in this study (∼1.6 mm and 1.33 ms, respectively), wavefronts can be reliably tracked from frame to frame as long as the propagation speed at some point along the front is <∼120 cm/s. This is two to three times the propagation speed we have previously reported during VF in this preparation (25). Phase analysis has become a standard tool in analyzing arrhythmias and is in use in many laboratories (19,20,24,26–29).
Wavefront graphs and components
Our algorithms codify the timing of the wavefronts and their interrelationships with a directed graph (22,30,31). In this representation, a wavefront is a directed line segment. The horizontal positions of the segment's endpoints specify the wavefront's starting and ending times. The vertical positions are not significant. For example, consider an activation pattern in which a single paced wavefront sweeps across the mapped region at fixed intervals. The wavefront graph for this pattern will consist of a series of disconnected line segments: one for each wavefront (see Fig. 5 in Rogers et al. (31), for an example).
FIGURE 5.
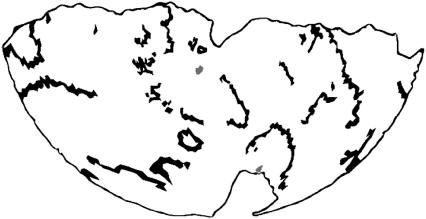
Wavefronts in a single frame of a VF episode. Data are from the same episode illustrated in Figs. 3 and 4. The geometry is rendered as a Hammer map projection so that the entire epicardium is visible. The wavefronts of the dominant component are black. All other wavefronts are gray. The first 2 s of this episode are rendered in this format in supplemental movie 2, which shows dominant component wavefronts in cyan and other wavefronts in red.
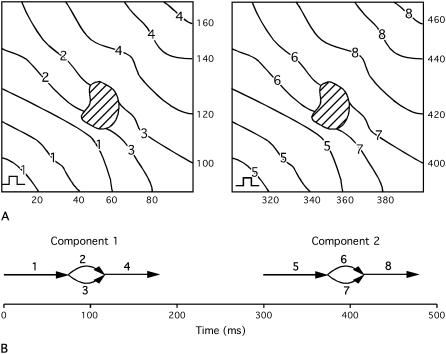
Fig. 1 A shows an isochronal map for a slightly more complex activation pattern in which a paced wavefront encounters an inexcitable region that splits the wavefront into two parts. The parts recombine after passing the obstacle. Two cycles of this pattern are shown. Each cycle consists of four interconnected wavefronts as shown in the wavefront graph in panel B. The points at which wavefronts connect are contact events; the first contact is a fragmentation in which one wavefront breaks up into two new wavefronts, and the second is collision in which two wavefronts collide and coalesce to form a new wavefront. More complex contact events are also possible (22,31). This wavefront graph contains two subgraphs that are disconnected from each other. Such subgraphs are called components. Because epicardial wavefronts in different components have no direct interactions with each other, they must arise in the mapped region from distinct epicardial sources. Such sources include wavefronts that propagate into the mapped region from outside, paced wavefronts (as in Fig. 1) or waves that arise de novo in the mapped regions from foci or epicardial breakthrough of intramural wavefronts.
FIGURE 1.
Schematic of two cycles of a paced activation pattern. (A) Isochronal maps. The stimulus site is indicated in the lower left corner of each map. Wavefront numbers are written on each contour line. The times (in milliseconds) corresponding to each contour are on the edges of the maps. The hashed region represents an inexcitable obstacle. (B) Wavefront graph for the activation pattern shown in panel A. Each arrow represents a wavefront, which is identified by the adjacent number. The wavefront graph has two components, one for each cycle of the activation pattern.
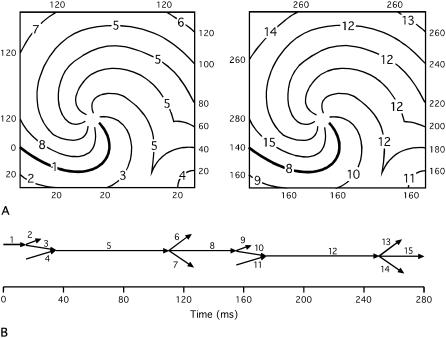
Fig. 2 illustrates isochrones and the wavefront graph for an activation pattern that consists of a counterclockwise rotor and an additional periodic source that sends waves into the mapped region from the lower-right corner. The rotor and the additional source have the same period. Two cycles are shown. A number of fragmentation events occur when wavefronts encounter the boundaries. In addition, there are two collisions when waves from the periodic source encounter waves spawned by the rotor. In this example, although there are 15 wavefronts, there is only one component. This is a consequence of reentry.
FIGURE 2.
Schematic of two cycles of a reentrant activation pattern. (A) Isochronal maps. A rotor is located near the center of the mapped region. A second periodic source with the same frequency sends wavefronts into the mapped region from the lower-right corner. Wavefront numbers are written on each contour line. The times (in milliseconds) corresponding to each contour are on the edges of the maps. The bold contour is the earliest contour in each map. (B) Wavefront graph for the activation pattern shown in panel A. Each arrow represents a wavefront, which is identified by the adjacent number. This graph contains only one component.
Stable breakthrough patterns
We define breakthrough wavefronts as those that arise de novo on the epicardium without being in contact with a boundary in their first frame. We identified stable, repetitive breakthrough patterns by animating the VF episodes with breakthrough wavefronts rendered in one color and all other wavefronts rendered in another color. The animations were displayed in a Hammer map projection so that the entire epicardium was visible at the same time. With this display format, stable, repetitive breakthrough patterns could be easily discerned. We identified breakthrough patterns that continued for at least 2 s and those that persisted for the entire 4 s mapped interval.
RESULTS
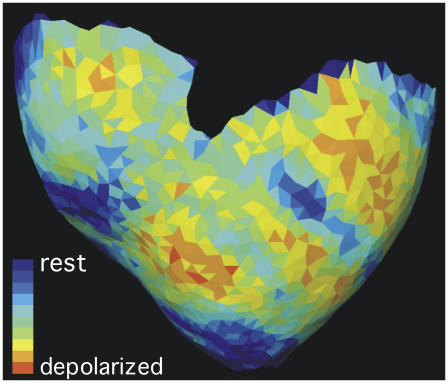
Fig. 3 shows a single frame of normalized VF fluorescence texture mapped onto the associated ventricular geometry. The first 2 s of the episode is animated in supplemental movie S1. Additional examples are shown in Kay et al. (20).
FIGURE 3.
Anterior view of a reconstructed ventricular epicardial geometry. One frame of normalized fluorescence recorded during VF is texture mapped onto the geometry. Red triangles are depolarized and blue are resting. The first 2 s of this VF episode are animated in supplemental movie S1.
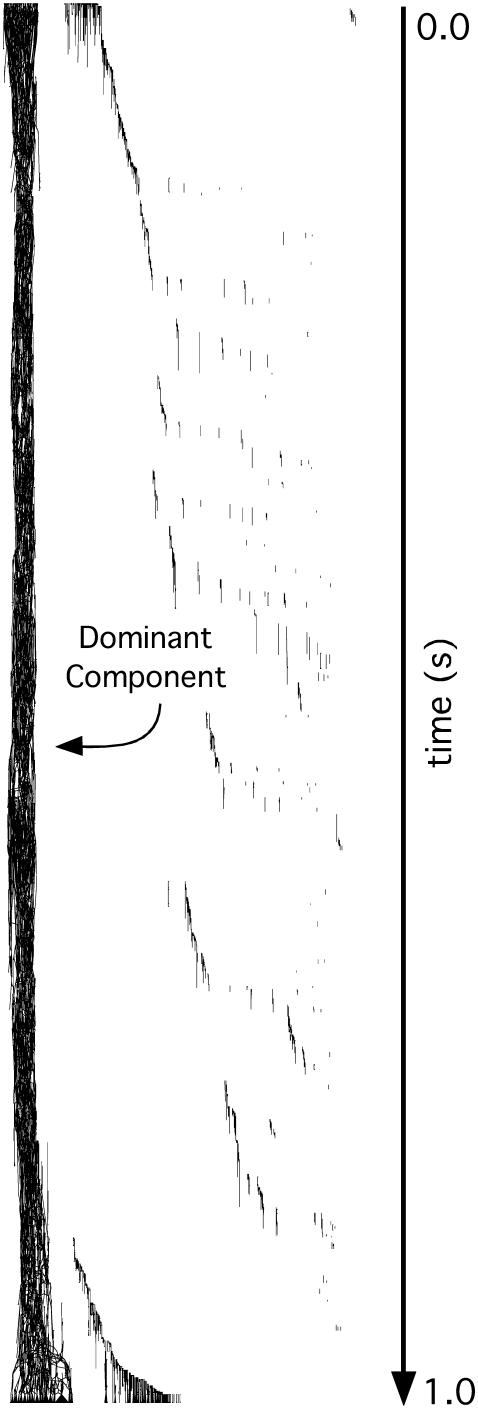
The 17 panoramically mapped VF episodes we analyzed contained 42,841 ± 13,074 wavefronts (range: 18,162–74,215). These episodes were each 4 s long. Fig. 4 shows the wavefront graph generated from the first second of one of the VF episodes. In this case the graph is vertically oriented so that time runs from top to bottom. The graph contains 13,296 wavefronts and 10,760 contacts. A high resolution version of this graph that can be magnified to show its detailed structure is available in the online supplement (Fig. S1).
FIGURE 4.
A complete wavefront graph generated from the first second of the VF episode shown in Fig. 3 and supplemental movie S1. Time runs from the top of the graph to the bottom as indicated by the time line arrow. Arrowheads on individual wavefronts in the graph are not visible at this scale. The structure on the left that runs from the top of the graph to the bottom is the dominant component. It contains 91% of wavefronts. Fig. S1 in the online supplement is a high resolution version of this graph that can be magnified to show its detailed structure.
The structure on the left side of the graph that extends from the beginning all the way to the end of the graph is a single component that contains 12,111 wavefronts (91%). The remaining components each contain fewer than 100 wavefronts with most having just one. This general pattern—a single component persisting for the entire episode with small components scattered in time and space—was also present in the graph generated by the full 4-s episode. In fact, this was the case for all 17 VF episodes. We call this persistent component the dominant component.
Over all episodes, the dominant component contained 92% ± 1% of wavefronts. We defined an active sample to be a site occupied by a wavefront in one temporal frame. Over all episodes, 98% ± 1% of active samples belonged to wavefronts in the dominant component. Fig. 5 shows a frame from the same episode as Fig. 3. Wavefronts are now displayed instead of normalized fluorescence. Wavefronts from the dominant component are black and wavefronts from other components are gray. The geometry is displayed with a Hammer map projection so that the entire epicardium can be seen. Supplemental movie S2 animates the first 2 s of the episode in this format. Wavefronts from outside of the dominant component are small and scattered and appear to play a negligible role in the overall activation pattern.
Three of the 17 VF episodes had a stable breakthrough pattern that persisted for the entire mapped interval. Supplemental movie S3 shows an example of 1 s of such a pattern. Two additional episodes had breakthrough patterns that lasted for at least 2 s but <4 s.
DISCUSSION
In a previous study, we imaged VF wavefronts from nearly the entire epicardium and found that stage II VF in the isolated pig heart is not driven by stable persistent rotors that are visible on the epicardium. In this study, we use graph theoretic analysis to examine our previously collected data for evidence that a driving source hidden within the ventricular walls is required for VF maintenance.
Our major finding is that in all 17 VF episodes we analyzed, the majority of epicardial wavefronts (92% ± 1%) accounting for 98% ± 1% of site activations were interconnected into a single dominant component that persisted for the entire 4-s mapped interval. This means that it was always possible to follow sequences of wavefronts through series of fragmentation and collision events from the beginning to the end of the mapped interval.
To understand the implications of this, first consider the opposite case in which all of the components have lifetimes shorter than the mapped interval. In this situation, VF maintenance is dependent on the birth of new components: without new components, VF would stop when all of the wavefronts from the initial component(s) terminated. New components can only be formed by wavefronts entering the mapped region from the outside or appearing de novo within the mapped region. Because we are mapping essentially the entire epicardial surface, there is no “outside” and new components must arise from de novo wavefronts.
This “multiple-component” pattern is what we would expect to see if VF were driven by an intramural mother rotor. Rotors whose central filaments do not intersect the epicardium manifest themselves on the epicardium as a series of breakthrough wavefronts appearing de novo on the epicardium with each cycle (7). If such an intramural or septal rotor were driving VF in the manner outlined by the mother rotor hypothesis, with each cycle, we would see wavefronts erupting onto the epicardium and propagating away, fragmenting on anatomical and functional obstacles in a process called fibrillatory conduction (3,5). In graph terms, each cycle of the mother rotor should produce one or more discrete components.
However, this was not the pattern we observed. In all cases, there was a dominant component that persisted for the entire time that we mapped. As can be seen in Fig. S1, there are innumerable ways to trace sequences of wavefronts through fragmentation and collision events from the start of the mapped interval to the end. This finding shows that many complete reentrant pathways were always present on the epicardial surface. This is because each such sequence of wavefronts constitutes a continuous activation front and the only way for a front to remain on the heart for 4 s at physiological propagation velocities is to activate tissue more than once. The wavefronts that participate in reentrant pathways are sufficient to maintain VF activation in the sense that if all breakthrough wavefronts were removed from the activation pattern without affecting the remaining wavefronts, then continuous activation would still exist.
We believe that this finding is strong evidence that VF is not driven by hidden mother rotors or some other intramural periodic source. However, we do not claim that it is absolute proof. This will likely require high-density three-dimensional mapping of all of the ventricular walls, which is currently infeasible.
One possible counter argument to our claim—that the existence of a dominant component is incompatible with VF that is driven by an intramural periodic source—is that it is possible for the epicardial wavefronts arising from successive breakthrough cycles to be connected together into a single component. The only way for this to occur would be for wavefronts descending from an early breakthrough cycle to survive on the epicardium long enough to collide and coalesce with wavefronts descending from the next breakthrough cycle. An important point is that each such connection completes a reentrant pathway on the epicardium. Because these pathways are redundant with the intramural/septal reentry generating the breakthrough wavefronts, if the intramural/septal rotor were extinguished, VF activation could still be maintained via the alternate reentrant pathways on the epicardium. In fact, this pattern seems to be present in the three VF episodes that featured a stable breakthrough pattern that persisted for the entire mapped interval (e.g., supplemental movie S3). Although the breakthrough patterns were very likely generated by intramural rotors, in all cases there was still a single dominant component indicating the simultaneous presence of epicardial reentry.
Another counter argument is the possibility that some epicardial reentrant pathways might require infusion of breakthrough wavefronts to be complete. For example, suppose a wavefront participating in epicardial reentry is propagating decrementally and near failure when it collides and coalesces with a breakthrough wavefront. The combined wavefront then goes on to complete the reentrant circuit. If the breakthrough wavefront had not appeared, the epicardial wavefront would have failed and the reentrant circuit would have been broken. However, to achieve the rich interconnections and complexity of the epicardial dominant component (e.g., Figs. 4 and S1) in an arrhythmia that is driven by intramural sources, such events would have to be ubiquitous, which we believe is unlikely. However, because we cannot rule out all such scenarios, we cannot completely exclude hidden mother rotors as the drivers of VF.
These results combined with those of our previous work (20) suggest that VF in this experimental model is not driven by mother rotors that are either visible on the epicardium or hidden within the ventricular walls. Similarly, our data are inconsistent with a driving rotor that is sometimes visible on the epicardium and sometimes not. In this situation, we would expect to see a continuous component during the times the rotor's filament contacts the epicardium and discrete components when it does not. We did not observe such a pattern. Our data are more consistent with the notion that VF is a distributed phenomenon maintained by the constant formation of new wavefronts and reentrant pathways. This implies that new anti-VF treatments designed to target local driving sources may be less effective than more global interventions.
As outlined in our earlier work (20), these results apply to early VF in young, isolated swine hearts that were exposed to the electromechanical uncoupling agent BDM. VF patterns and mechanisms may differ as VF progresses or in different experimental preparations.
SUPPLEMENTARY MATERIAL
An online supplement to this article can be found by visiting BJ Online at http://www.biophysj.org.
Acknowledgments
We thank C. Killingsworth, F. Vance, and R. Collins for veterinary support and R. Ideker and W. Smith for helpful discussion. M.W.K. is with the Dept. of Electrical and Computer Engineering, The George Washington University, Washington, DC. J.D.G. is with the Dept. of Medicine, University of Alabama at Birmingham.
This work was supported in part by National Institutes of Health grant HL64184 (J.M.R.) and a Biomedical Engineering Research grant from the Whitaker Foundation (M.W.K.).
References
- 1.Moe, G. K., W. C. Reinboldt, and J. A. Abildskov. 1964. A computer model of atrial fibrillation. Am. Heart J. 67:200–220. [DOI] [PubMed] [Google Scholar]
- 2.Panfilov, A., and A. Pertsov. 2001. Ventricular fibrillation: evolution of the multiple-wavelet hypothesis. Philos. Trans. R. Soc. Lond. A. 359:1315–1325. [Google Scholar]
- 3.Chen, J., R. Mandapati, O. Berenfeld, A. C. Skanes, and J. Jalife. 2000. High frequency periodic sources underlie ventricular fibrillation in the isolated rabbit heart. Circ. Res. 86:86–93. [DOI] [PubMed] [Google Scholar]
- 4.Samie, F. H., O. Berenfeld, J. Anumonwo, S. F. Mironov, S. Udassi, J. Beaumont, S. Taffet, A. M. Pertsov, and J. Jalife. 2001. Rectification of the background potassium current: a determinant of rotor dynamics in ventricular fibrillation. Circ. Res. 89:1216–1223. [DOI] [PubMed] [Google Scholar]
- 5.Zaitsev, A. V., O. Berenfeld, S. F. Mironov, J. Jalife, and A. M. Pertsov. 2000. Distribution of excitation frequencies on the epicardial and endocardial surfaces of fibrillating ventricular wall of the sheep heart. Circ. Res. 86:408–417. [DOI] [PubMed] [Google Scholar]
- 6.Winfree, A. T. 1987. When Time Breaks Down. Princeton University Press, Princeton, NJ.
- 7.Pertsov, A. M. 2004. Scroll waves in three dimensions. In Cardiac Electrophysiology, from Cell to Bedside. D. Zipes and J. Jalife, editors. W. B. Saunders, Philadelphia. 345–354.
- 8.Choi, B. R., T. Liu, and G. Salama. 2001. The distribution of refractory periods influences the dynamics of ventricular fibrillation. Circ. Res. 88:E49–E58. [DOI] [PubMed] [Google Scholar]
- 9.Choi, B. R., W. Nho, T. Liu, and G. Salama. 2002. Life span of ventricular fibrillation frequencies. Circ. Res. 91:339–345. [DOI] [PubMed] [Google Scholar]
- 10.Choi, B. R., W. J. Hatton, J. R. Hume, T. Liu, and G. Salama. 2006. Low osmolarity transforms ventricular fibrillation from complex to highly organized, with a dominant high frequency source. Heart Rhythm. 3:1210–1220. [DOI] [PubMed] [Google Scholar]
- 11.Thomas, S. P., A. Thiagalingam, E. Wallace, P. Kovoor, and D. L. Ross. 2005. Organization of myocardial activation during ventricular fibrillation after myocardial infarction: evidence for sustained high-frequency sources. Circulation. 112:157–163. [DOI] [PubMed] [Google Scholar]
- 12.Everett, T. H., 4th, E. E. Wilson, S. Foreman, and J. E. Olgin. 2005. Mechanisms of ventricular fibrillation in canine models of congestive heart failure and ischemia assessed by in vivo noncontact mapping. Circulation. 112:1532–41. [DOI] [PMC free article] [PubMed] [Google Scholar]
- 13.Huang, J., G. P. Walcott, C. R. Killingsworth, S. B. Melnick, J. M. Rogers, and R. E. Ideker. 2005. Quantification of activation patterns during ventricular fibrillation in open-chest porcine left ventricle and septum. Heart Rhythm. 2:720–728. [DOI] [PubMed] [Google Scholar]
- 14.Nanthakumar, K., J. Huang, J. M. Rogers, P. L. Johnson, J. C. Newton, G. P. Walcott, R. K. Justice, D. L. Rollins, W. M. Smith, and R. E. Ideker. 2002. Regional differences in ventricular fibrillation in the open-chest porcine left ventricle. Circ. Res. 91:733–740. [DOI] [PubMed] [Google Scholar]
- 15.Rogers, J. M., J. Huang, S. B. Melnick, and R. E. Ideker. 2003. Sustained reentry in the left ventricle of fibrillating pig hearts. Circ. Res. 92:539–545. [DOI] [PubMed] [Google Scholar]
- 16.Rogers, J. M., J. Huang, R. W. Pedoto, R. G. Walker, W. M. Smith, and R. E. Ideker. 2000. Fibrillation is more complex in the left ventricle than the right ventricle. J. Cardiovasc. Electrophysiol. 11:1364–1371. [DOI] [PubMed] [Google Scholar]
- 17.Rogers, J. M., J. Huang, W. M. Smith, and R. E. Ideker. 1999. Incidence, evolution, and spatial distribution of functional reentry during ventricular fibrillation in pigs. Circ. Res. 84:945–954. [DOI] [PubMed] [Google Scholar]
- 18.Valderrabano, M., M. H. Lee, T. Ohara, A. C. Lai, M. C. Fishbein, S. F. Lin, H. S. Karagueuzian, and P. S. Chen. 2001. Dynamics of intramural and transmural reentry during ventricular fibrillation in isolated swine ventricles. Circ. Res. 88:839–848. [DOI] [PubMed] [Google Scholar]
- 19.Nash, M. P., A. Mourad, R. H. Clayton, P. M. Sutton, C. P. Bradley, M. Hayward, D. J. Paterson, and P. Taggart. 2006. Evidence for multiple mechanisms in human ventricular fibrillation. Circulation. 114:536–542. [DOI] [PubMed] [Google Scholar]
- 20.Kay, M. W., G. P. Walcott, J. D. Gladden, S. B. Melnick, and J. M. Rogers. 2006. Lifetimes of epicardial rotors in panoramic optical maps of fibrillating swine ventricles. Am. J. Physiol. Heart Circ. Physiol. 291:H1935–1941. [DOI] [PMC free article] [PubMed] [Google Scholar]
- 21.Kay, M. W., P. M. Amison, and J. M. Rogers. 2004. Three-dimensional surface reconstruction and panoramic optical mapping of large hearts. IEEE Trans. Biomed. Eng. 51:1219–1229. [DOI] [PubMed] [Google Scholar]
- 22.Rogers, J. M. 2004. Combined phase singularity and wavefront analysis for optical maps of ventricular fibrillation. IEEE Trans. Biomed. Eng. 51:56–65. [DOI] [PubMed] [Google Scholar]
- 23.Gray, R. A., A. M. Pertsov, and J. Jalife. 1998. Spatial and temporal organization during cardiac fibrillation. Nature. 392:75–78. [DOI] [PubMed] [Google Scholar]
- 24.Liu, Y. B., A. Peter, S. T. Lamp, J. N. Weiss, P. S. Chen, and S. F. Lin. 2003. Spatiotemporal correlation between phase singularities and wavebreaks during ventricular fibrillation. J. Cardiovasc. Electrophysiol. 14:1103–1109. [DOI] [PubMed] [Google Scholar]
- 25.Qin, H., M. W. Kay, N. Chattipakorn, D. T. Redden, R. E. Ideker, and J. M. Rogers. 2003. Effects of heart isolation, voltage-sensitive dye, and electromechanical uncoupling agents on ventricular fibrillation. Am. J. Physiol. Heart Circ. Physiol. 284:H1818–H1826. [DOI] [PubMed] [Google Scholar]
- 26.Gray, R. A., and N. Chattipakorn. 2005. Termination of spiral waves during cardiac fibrillation via shock-induced phase resetting. Proc. Natl. Acad. Sci. USA. 102:4672–4677. [DOI] [PMC free article] [PubMed] [Google Scholar]
- 27.Kuo, S. R., and N. A. Trayanova. 2006. Action potential morphology heterogeneity in the atrium and its effect on atrial reentry: a two-dimensional and quasi-three-dimensional study. Philos. Transact. A Math. Phys. Eng. Sci. 364:1349–1366. [DOI] [PubMed] [Google Scholar]
- 28.Sarmast, F., A. Kolli, A. Zaitsev, K. Parisian, A. S. Dhamoon, P. K. Guha, M. Warren, J. M. Anumonwo, S. M. Taffet, O. Berenfeld, and J. Jalife. 2003. Cholinergic atrial fibrillation: I(K,ACh) gradients determine unequal left/right atrial frequencies and rotor dynamics. Cardiovasc. Res. 59:863–873. [DOI] [PubMed] [Google Scholar]
- 29.Clayton, R. H., E. A. Zhuchkova, and A. V. Panfilov. 2006. Phase singularities and filaments: simplifying complexity in computational models of ventricular fibrillation. Prog. Biophys. Mol. Biol. 90:378–398. [DOI] [PubMed] [Google Scholar]
- 30.Chachra, V., P. M. Ghare, and J. M. Moore. 1979. Applications of Graph Theory Algorithms. North-Holland, New York.
- 31.Rogers, J. M., M. Usui, B. H. KenKnight, R. E. Ideker, and W. M. Smith. 1997. A quantitative framework for analyzing epicardial activation patterns during ventricular fibrillation. Ann. Biomed. Eng. 25:749–760. [DOI] [PubMed] [Google Scholar]


