Abstract
Determining tissue structure and composition from the behavior of the NMR transverse relaxation during free induction decay and spin echo formation has seen significant advances in recent years. In particular, the ability to quantify cerebrovascular network parameters such as blood volume and deoxyhemoglobin concentration from the NMR signal dephasing has seen intense focus. Analytical models have been described, based on statistical averaging of randomly oriented cylinders in both the static and slow diffusion regimes. However, the error in estimates obtained from these models when applied to systems in which the statistical assumptions of many, randomly oriented perturbers are violated has not been systematically investigated. Using a deterministic simulation that can include diffusion, we find that the error in estimated venous blood volume fraction and deoxyhemoglobin concentration obtained using a static dephasing regime statistical model is inversely related to the square root of number of blood vessels. The most important implication of this is that the minimum imaging resolution for accurate deoxyhemoglobin and blood volume estimation is not bound by hardware limitations, but rather by the underlying tissue structure.
INTRODUCTION
A resurgence in the use of magnetic field inhomogeneity induced NMR signal dephasing to determine underlying tissue parameters can be seen in the literature (1–8). A number of analytical methods have been developed to describe the effects of the cerebral vascular network and similar sized field perturbers on the NMR signal. The cerebral vascular network is particularly interesting in light of the widespread use of blood oxygenation level dependent (BOLD) imaging for functional studies of the brain. Understanding the relationship between underlying hemodynamic changes and the BOLD effect could provide significant additional insight into quantifying the changes that occur during brain function.
Biophysical models have been used to characterize the NMR signal relaxation behavior. The first Monte Carlo (MC) model was developed by Ogawa et al to quantify the BOLD effect (9) and a refined MC simulation was developed by Boxerman et al (10). The Anderson-Weiss mean field theory has been used to predict spin echo and gradient echo signal (11). The Gaussian approximation of the spin-phase distribution was also used in a two-compartment model presented by Sukstanskii and Yablonskiy (6). Analytical expressions for the signal evolution due to the cerebral vascular network have also been developed. Yablonskiy and Haacke (1) developed a model for the static dephasing regime, which was extended to the slow diffusion regime by Kiselev and Posse (12). However, the use of a statistical model for the vascular network is required for these analytical approaches that seek to model realistic tissue parameters. The Yablonskiy and Haacke (1) model has been used to estimate in vivo deoxyhemoglobin and blood volume values, because it does not require vessel radius distribution information inherent in including diffusion (12). The theoretical equations have also been analyzed in a phantom study using polyethylene fishing line in a doped water solution (5). However, controlling for radius, number of segments, volume faction, and diffusion is impractical in both in vivo and phantom studies. The error in estimates obtained with statistical models when their central assumption of many randomly oriented, magnetically noninteracting vessels is broken has not been investigated. Because detailed vessel morphology is not readily obtainable, models based on statistical averaging demonstrate the most promise for in vivo application. Issues arising from macroscopic inhomogeneity, signal/noise, and diffusion effects can be mitigated with pulse sequences and hardware advances. However, the basic geometry of the vascular network presents fundamental limits to the application of statistical averaging based models that are not well understood. A better understanding of the fundamental limits of these models can provide insight into approaches for other confounding artifacts.
A three-dimensional simulation of NMR signal has been developed based on the two-dimensional deterministic diffusion model first proposed by Bandettini and Wong (13). Deterministic simulations are computationally less intense than the MC simulation and yet not bound by the assumptions inherent in analytical models. These simulations are therefore ideally suited to investigate the error introduced when underlying assumptions are violated as well as investigating diffusion and intravascular effects.
Using these simulations, the effect of the number of vessels on the accuracy of venous blood volume containing deoxyhemoglobin ς and deoxyhemoglobin concentration [Hb] estimates obtained using a static dephasing analytical expression (1) for signal evolution is determined. The relationship between vessel radius and error in estimates of [Hb] and ς due to diffusion is also characterized.
THEORY
Analytical model
The elegant analytical description of NMR signal in a two-compartment model consisting of randomly oriented infinitely long magnetized cylinders (i.e., blood vessels) embedded in a medium (i.e., tissue) developed by Yablonskiy and Haacke (1) predicts two time domains for signal relaxation. For a blood vessel network in tissue, where fully deoxygenated blood has a susceptibility difference Δχ compared to tissue, the transition between the short time domain and the long time domain occurs at ∼1.5 tc, where
 |
(1) |
is the critical time and Y is the hemoglobin saturation (Y = 1 when fully saturated with molecular oxygen). During the short time domain, the log-linear space signal decay is predicted to have a quadratic dependence on time, whereas during the long time domain it has a linear dependence. The time course during a spin echo is therefore given by
 |
(2) |
where S0 is the initial signal, S′0 is the spin echo signal, ς is the blood volume fraction, RS is the short time domain reversible decay constant, R′2 is the long time domain reversible decay constant, and R2 is the irreversible transverse relaxation constant. The allowance for different values of S0 and S′0 allows for imperfect radio frequency refocusing, which is inherent to real experiments. The tissue concentration of hemoglobin is given by
 |
(3) |
where χM,Hb is the molar susceptibility of deoxyhemoglobin. Oxygenated hemoglobin is assumed to have the same susceptibility as surrounding tissue. Pauling reported an effective magnetic moment of 5.46 Bohr magnetons per heme (14) from which a molar susceptibility of 48.1 × 10⁻⁶ M−1 in cgs units can be calculated (15).
Simulations
Bandettini and Wong originally detailed the deterministic diffusion model for two-dimensional problems (13). The NMR simulation uses three-dimensional spatial grids that represent the complex valued transverse magnetization M, the relaxation and precession R, and a Gaussian diffusion kernel D. Iterative multiplication and convolution of these three-dimensional arrays according to
 |
(4) |
allows the calculation of the magnetization at the kth time point Mk. The operator “×” is defined as point wise multiplication of arrays and “*” is the convolution operator. M1 is the initial magnetization, which is assumed uniform and real everywhere. This assumption implies a uniform proton density and ideal excitation. The implementation of the three-dimensional convolution requires the use of the Fourier transform to be computationally practical. The practical implementation of Eq. 4 is therefore
 |
(5) |
The net voxel magnetization, which defines the NMR signal, for the kth time point is the sum of all the complex values in the Mk array:
 |
(6) |
The Gaussian diffusion kernel is derived from the Einstein equation and the Gaussian distribution in three dimensions. D is define as the probability distribution for the location of a molecule moving with an isotropic diffusion coefficient D for a time δt and is given by
 |
(7) |
where x, y, and z are the three Cartesian coordinates of each array position.
R is defined as
 |
(8) |
where Δω is the induced frequency offset and P defines the positions occupied by the blood vessel network. P is defined to be 1 everywhere occupied by a blood vessel and 0 elsewhere. T2,tissue was 66 ms and T2,blood was computed from literature values based on oxygenation (16). To perform simulations in which the intravascular signal was suppressed, T2,blood was set to zero. All vessels are assumed to be freely permeable to water, and the intravascular suppression does not address the radius-dependent vessel permeability, but it does remove the rapidly decaying intravascular signal. For a single blood vessel of radius R and angle θ relative to the main magnetic field, the induced frequency offset ΔωV is given by
 |
(9) |
where Δχ is the susceptibility difference between fully deoxygenated blood and tissue, Y is the fractional oxygenation of blood, r is the perpendicular distance to vessel, and φ is the azimuthal angle in the plane perpendicular to the vessel. Blood vessels are assumed to be infinitely long cylinders passing through the voxel. The principal of superposition allows the total frequency offset Δω to be calculated as the sum of ΔωV for each blood vessel.
The number of vessels in a network is derived from the nominal blood volume desired. The average blood volume for a vessel of radius R in an isotropic voxel of dimension Δx is approximately ΔxπR2. This is only an approximation since the vessels are randomly distributed and oriented within the voxel and it is only exact for orthogonal vessels (which, by definition, do not intersect). Therefore, the number of vessels required to desired blood volume can be estimated using
 |
(10) |
For each set of vessel distributions, the actual volume fraction of the n vessels was computed and used in subsequent comparisons.
All simulations where conducted with a static magnetic field of 4 T, spin echo time of 90 ms, uniform blood oxygenation of 50%, hematocrit of 0.4, and 256-point isotropic three-dimensional grid. To generate a random distribution of vessels, the location in three dimensions was assigned from a uniform random distribution over the entire grid. The azimuthal angle φ was assigned from a uniform random distribution from 0 to 2π, and the angle θ was assigned from a sin(θ)/2 random distribution. Vessel crossing was not prevented, since the real vascular network contains branching patterns.
Model fitting
Simulation time courses were fit to analytical static dephasing model (Eq. 2) in log-linear space using linear least squares to generate estimates of [Hb] and ς. The fitting routine solves for six parameters: S0, S′0, ς, RS, R′2, and R2. Equation 3 was used to obtain [Hb] from the fitted R′2.
Simulation computational accuracy
There is a lower limit on the time step and diffusion that can be accurately simulated for a given grid size and resolution. Small time steps and low diffusion values can result in numerical delta functions for large voxels with coarse grids, i.e., low-resolution grids. Large time steps and high diffusion can result in diffusion kernel that is larger than the sampling grid. The diffusion kernel must be smaller than the total grid size Δx. This means that the kernel must be less than the machine precision ɛmachine, the smallest increment that can be computed, at the edge of the grid or that
 |
(11) |
To avoid numerical delta functions as diffusion kernels, the minimum probability at the nearest neighbor pmin is defined such that
 |
(12) |
where m is the number of grid points. Based on initial observation, pmin was set at 2 × 10⁻⁵ for all simulations. This means that to maintain numerical stability,
 |
(13) |
Simulation validation
Simulations with linear magnetic field gradients were performed to test the accuracy of the implementation. The effect of a linear gradient Gx on the free induction decay of a voxel of size Δx is well understood and can be expressed analytically (17,18)
 |
(14) |
The signal that occurs at a spin echo time t has also been characterized (19):
 |
(15) |
It was determined that there is a grid size dependent error that is independent of diffusion and arises due to the numerical integration inherent in the simulations. This can be readily observed by considering the signal Eq. 14 without diffusion and R2 decay:
 |
(16) |
However, if Eq. 16 is solved using an N point numerical approximation, there is an additional error ɛ related to the regular sampling of the linear gradient given by
 |
(17) |
From Eq. 9, it can be calculated that the maximum frequency offset ωmax that occurs around a vessel is
 |
(18) |
At 4 T and 50 % oxygenation, ωmax = 56 Hz. If this frequency offset is assumed to be distributed over 1.2 mm voxel in a 7 μm resolution simulation, because a three-dimensional sampling does not regularly and symmetrically sample the radial decay around a vessel and there are multiple perturbers with different spatial sampling, the expected error due to numerical integration is 0.6% for a 135 ms simulation.
Simulations of 1.2 mm voxels with a linear gradient of 0.1 Hz μm−1 using a 256-point grid had errors of <3 % at the spin echo location compared to the analytical solution given by Eq. 15 for diffusion values in the 0.8–1.2 μm2 ms−1. The implementation of diffusion using the Fourier transform convolution also makes the simulation prone to edge effects that occur due to the assumption of repeating space. By performing simulations with various diffusion rates and sampling only the central region of the simulation space to obtain the signal, it was determined that edge effects of the Fourier transform became apparent after 135 time steps when the effective diffusion kernel size, in which the diffusion kernel was nonzero, exceeded 0.7 times the number of the unsampled edge pixels. The edge effect was more pronounced with larger gradients because of the larger error occurring at the edges due to the assumed repetition. In random samples, such as blood vessel networks, this effect would be significantly reduced since a repeated random distribution would provide a reasonable approximation of a continuous random distribution. For the simulations conducted, the effective diffusion kernel was always smaller than 0.7 times the unsampled edge voxels.
METHODS
Number of vessels
To estimate the effects of the statistical assumption of a large number of vessels, simulations with 1 ms temporal resolution and without diffusion (i.e., static dephasing) were conducted for nominal blood volumes of 0.5, 1.0, 1.5, 2.0, 2.5, and 3.0% and vessel radii of 2, 4, 6, 8, 15, and 20 μm. The grid representing a voxel was 1 mm isotropic and the entire grid was summed to obtain the net magnetization. The vessel network was described over a 1.3 mm concentric cube. Allowing vessel position outside the sampling grid prevents sparsely populated outer regions that would result due to random positioning and orientation. Simulations were conducted both with and without intravascular signal suppression. Thirteen vessel networks with different random orientations and positions were used for each combination of vessel radii and blood volume. The resulting signal time courses were fit to the static dephasing model to estimate [Hb] and ς.
Diffusion
Diffusion simulations used a 256 point 1.5 mm isotropic grid with a time step of 1 ms. The vessel network was defined over a 1.8 mm cube and the summation for the voxel net magnetization used the central 1.2 mm portion of the grid. Using only the central portion of the grid prevents the inclusion of error prone edge effects. The fast Fourier transform assumes a repeating structure, resulting in errors in the peripheral grid points, so our summation of the central region avoids this problem. This affects all numerical convolution algorithms. Simulations using diffusion coefficients of 0, 0.8, 1.0, 1.2, and 2.5 μm2/ms were performed with vascular networks generated using vessel radii ranging from 2 to 50 μm.
Dual network
To determine the effect of combined vessel networks, two vessel networks were overlaid to simulate capillary and draining venule networks. The first network consisted of 2579 vessels with 2 μm radii placed on a 1.5 mm isotropic grid and occupying ∼1% of the 1.2 mm isotropic sampling voxel. The second network was 92 vessels of 15 μm radius that occupies roughly 2.5% of the sampling volume. The exact blood volume depends on the random orientation and position of the blood vessels. Each vessel network was used for a separate simulation and then combined in a third simulation. This set of three simulations was repeated with six random orientations and positions of vessels for 18 simulations in total.
RESULTS AND DISCUSSION
Number of vessels
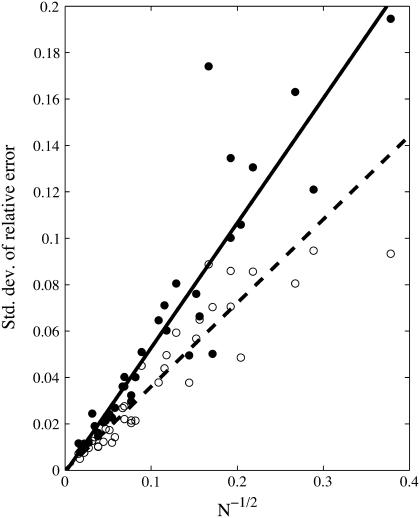
Using the static dephasing model (Eq. 2), simulations indicate that the standard deviation over the 13 vessel networks of the relative error in predicted concentration of deoxyhemoglobin, ɛHb, and blood volume fraction, ɛς, have a linear relationship with the square root of the number of blood vessels in a voxel with a slope of 0.54 ± 0.03 and 0.35 ± 0.02, respectively (Fig. 1). The coefficient of determination R2 was 0.85 for both ɛHb and ɛς. The standard deviation provides an estimate of the range of relative errors expected for predications obtained from vessel networks, in the absence of systematic errors. This range reflects the relative error that can be expected from predications obtained from a single vessel network configuration with a finite number of vessels, and is therefore critical to understanding the validity of predications obtained from real vascular networks.
FIGURE 1.
Standard deviation of the relative error in [Hb] (closed) and blood volume fraction (open) is inversely proportional to the square root of the number of vessels with constants of proportionality of 0.54 ± 0.03 and 0.36 ± 0.02, respectively.
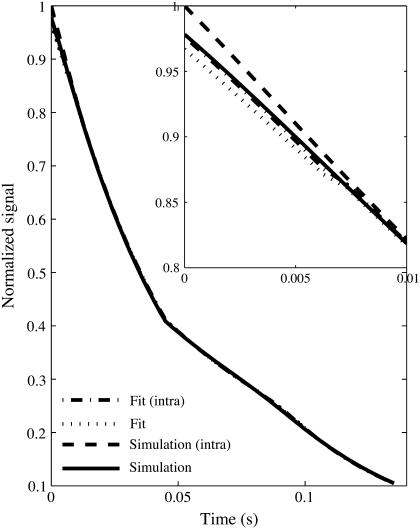
Blood volume fraction was systematically underestimated by 31.2 ± 0.2% if the intravascular signal was not suppressed and the initial free induction decay was used in estimating ς. The fit of the analytical model to simulated data shown in Fig. 2 demonstrates the significant deviation that occurs during the early free induction decay. This is due to the rapid decay of vessel signal due to the high transverse relaxation rate, which leads to an increased signal only during the initial short time domain free induction decay. For times greater then tc, which are used in calculating [Hb], the intravascular signal has almost completely decayed. However, the estimate of ς depends strongly on an accurate signal within the short time domain. If only the spin echo and not the initial free induction decay is used to estimate [Hb] and ς, the blood volume is not underestimated because intravascular signal has completed decayed before the spin echo. The variance of the relative error in ς and the [Hb] estimate were insensitive to intravascular signal and inclusion of initial free induction decay in fitting because of the systematic nature of the intravascular signal that caused the underestimation.
FIGURE 2.
Simulation and fit time course for vessel network with 92 vessels of 15 μm radius in a 1.5 mm isotropic voxel with (intra) and without intravascular contributions. The inset shows the large deviation due to intravascular component for short times.
Since the analytical model used to estimate [Hb] and ς is based on a statistical assumption of large number of vessels, the inverse dependence of the error on the square root of the number of vessels is expected (1). The proportionality constants determined using simulations allow the estimation of a minimal voxel size. The total blood volumes in brain parenchyma have been measured anywhere between 3% and 5%. Using Eq. 10 and assuming a blood volume of 1.5% for the venous vasculature excluding large veins, which represents the vasculature that contains Hb and to which the model could be applied, a minimum voxel dimension in microns for a given relative error can be estimated:
 |
(19) |
 |
(20) |
Diffusion
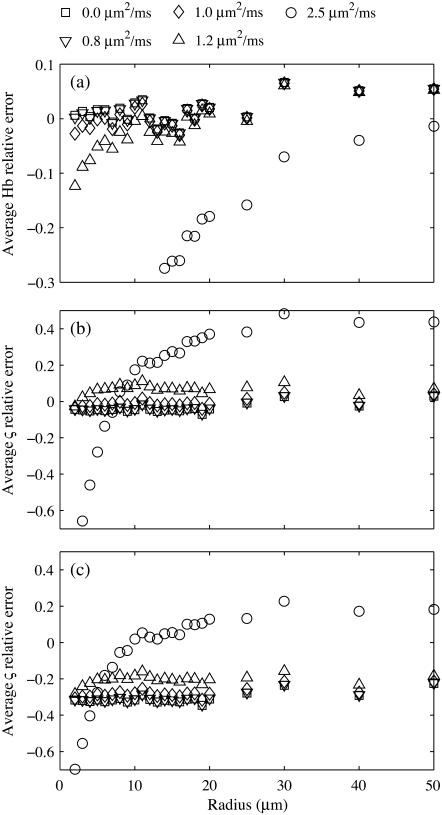
When the static dephasing model is used to predict deoxyhemoglobin and blood volume from simulated signal intensity curves that included diffusion, the relative error of the predicted values begins to drop significantly around 10 μm for in vivo diffusion values of 1.0 μm2 ms−1. Fig. 3 a shows the average relative error of [Hb], and average ς error is given in Fig. 3 b. The inclusion of blood vessel signal produced a systematic underestimation (Fig. 3 c) as in the static dephasing simulations. This underestimation was eliminated when only the spin echo was fit (data not shown).
FIGURE 3.
(a) Average relative error in [Hb] shows sharp underestimation that increases with diffusion and for smaller vessels. (b) Average relative error in blood volume fraction, ς, shows general overestimation for large vessel that is offset by an underestimation for small vessels. The simulation did not include intravascular signal. (c) Average relative error ς shows general underestimation when the intravascular signal is included and the full time course is fit. Simulation done with diffusion values of 0 (□), 0.8 (∇), 1.0 (◊), 1.2 (Δ), and 2.5 (○) μm2/ms.
Diffusion causes a suppression of the effect of deoxyhemoglobin in small vessels, thereby biasing the measured hemoglobin concentration to the larger venules and veins. Spin refocusing relies on equal precession during the free induction and spin echo formation. Differences in the magnetic field during these times result in nonequal precession for isochromats. The magnetic field gradients around small vessels have more rapid spatial variation than around large vessels. This leads to an average increase in the variation in local magnetic field experienced by an isochromat during the time course of the spin echo. Specifically, differences in precession frequency during the free induction decay and spin echo refocusing result in different phase accumulation at the spin echo. The NMR signal is the sum of all individual isochromats, and the larger the differences in precession angle, the greater the dephasing of the signal. This signal dephasing results in a signal loss during the spin echo formation that is not accounted for in the static dephasing regime analytical model. When the susceptibility induced field distortions are comparable to the diffusion distance, the precession frequency becomes time dependent and hence leads to irreversible signal loss. This transition to a fast dephasing regime for small blood vessels results in a violation of the static dephasing assumption of the applied analytical model and therefore an underestimation of blood volume and deoxyhemoglobin concentration.
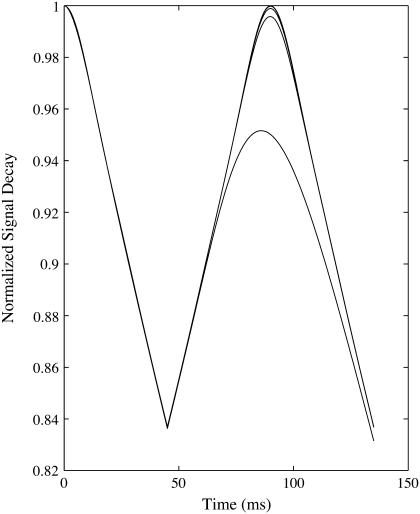
For large vessels, there is an overestimation of the blood volume that increases with diffusion. This is not a result of change in the long time regime behavior, as the slope, and hence the [Hb] estimate, is accurate. The diffusion results in a decrease of the signal during the short time regime that is particularly pronounced at higher diffusion rates (Fig. 4). Since the estimate of blood volume is derived from the difference in extrapolated long time regime and short time regime signal at the spin echo, this causes an overestimation of the blood volume. Even small changes in the short time regime significantly affect blood volume concentrations. The free permeability of the vessel wall enables a mixing of intravascular and extravascular pools. This reduces the rephasing efficiency and therefore the spin echo signal. However, it has only a negligible effect on the rate, which results in an overestimation of blood volume.
FIGURE 4.
Normalized signal decay due to dephasing and diffusion in the presence of 25 μm radius vessel network. Increasing diffusion of 0, 0.8, 1.0, 1.2, and 2.5 μm2/ms from top to bottom produces a reduced short time regime signal.
Dual networks
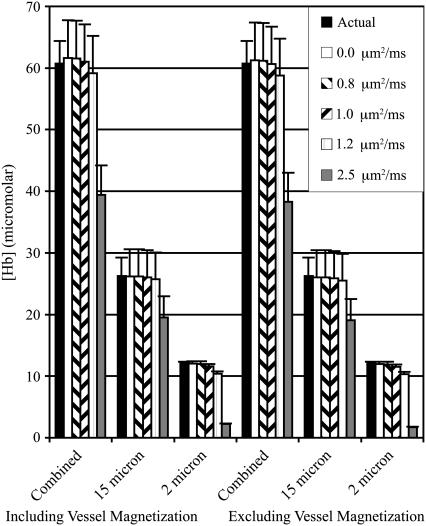
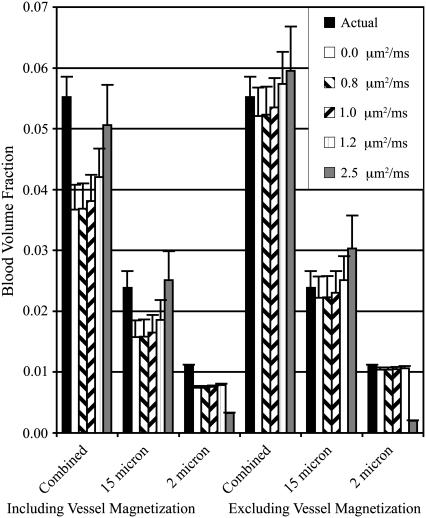
The estimated [Hb] from the combined network simulation was the sum of the estimates from the separate networks at all five levels of diffusion. This could be expected due to the superposition of the frequency offsets. The superposition of two vessel networks with 2 μm and 15 μm radii shows that the large vessel network dominates the predicted values when diffusion is present (Figs. 5 and 6). This is expected because diffusion suppresses the spin refocusing from smaller vessels, allowing larger vessels to dominate the spin echo formation. This creates a natural biasing of predictions to the deoxyhemoglobin concentration of larger venous vessels.
FIGURE 5.
[Hb] concentrations for 2 μm, 15 μm, and combined vessel networks both with and without vessel contributions. The actual [Hb] and the predicted value using five levels of diffusion are shown.
FIGURE 6.
Blood volume concentrations for 2 μm, 15 μm, and combined vessel networks both with and without vessel contributions. The actual blood volume and the predicted value using five levels of diffusion are shown.
CONCLUSIONS
The magnitude of the error introduced by a finite number of vessels has important implications for in vivo applications. To achieve 2% error or better in both [Hb] and ς, the isotropic voxel size has to be 2.7 mm or larger for typical vascular densities. Voxel volumes <20 mm3 cannot reasonably be expected to yield accurate results. This means that the minimum imaging resolution for accurate [Hb] and ς estimation is not bound by hardware limitations, but rather the underlying tissue structure. Since the effect of macroscopic gradients, which also cause a contaminating recoverable signal dephasing, increases with voxel size, a competing balance between macroscopic gradient effects and statistical errors must be reached. Small animal imaging also tends to use much smaller voxel sizes. This will generally lead to inaccurate results, and the voxel size must be matched to the capillary and venule vessel sizes.
The systemic underestimation of blood volume fraction is mitigated for in vivo application due to the ability to selectively suppress intravascular signal. Intravascular signal is naturally decreased by the bulk flow, and can be further suppressed using flow suppression techniques (20). This blood vessel underestimation does not account for previous experimental results that calculate blood volumes that are greater than typical blood volume fractions (2,21,22), which is more likely related to the systematic overestimation observed with diffusion or macroscopic magnetic field inhomogeneities that lead to an increased decay rate during the long time domain. These increased decay rates lead to higher extrapolated initial and spin echo signals and therefore an elevated blood volume fraction. Although the effects of small capillaries are not completely suppressed by diffusion, the natural biasing of reversible decay to larger vessels may provide a benefit for measurements of oxygen consumption. This natural venous weighting, as the vessel radius increases, provides a better estimate of the outflowing deoxyhemoglobin concentration required for consumption calculations.
The biophysical model used in the simulations still relies on the assumption that capillaries can be approximated as infinitely long cylinders. More realistic vessel networks should be developed to investigate the effect of this assumption. Other parameters affecting the accuracy of in vivo measurements, such as spin echo time and gradient echo spacing, can also be investigated with this method. Pulse sequences for measuring underlying tissue structure must be tuned to the assumptions underlying the theoretical signal time course. For [Hb] and ς, this means that the voxel size limits are established by the vasculature and not the NMR hardware.
Acknowledgments
The authors thank the Natural Sciences and Engineering Research Council of Canada for a postdoctoral fellowship award (L.M.K) and a Discovery Grant (R.S.M). Support of the Canada Research Chairs program is also acknowledged (R.S.M).
References
- 1.Yablonskiy, D. A., and E. M. Haacke. 1994. Theory of NMR signal behavior in magnetically inhomogeneous tissues: the static dephasing regime. Magn. Reson. Med. 32:749–763. [DOI] [PubMed] [Google Scholar]
- 2.An, H., and W. Lin. 2000. Quantitative measurements of cerebral blood oxygen saturation using magnetic resonance imaging. J. Cereb. Blood Flow Metab. 20:1225–1236. [DOI] [PMC free article] [PubMed] [Google Scholar]
- 3.Kiselev, V. G., and D. S. Novikov. 2002. Transverse NMR relaxation as a probe of mesoscopic structure. Phys. Rev. Lett. 89:278101. [DOI] [PubMed] [Google Scholar]
- 4.Sukstanskii, A. L., and D. A. Yablonskiy. 2001. Theory of FID NMR signal dephasing induced by mesoscopic magnetic field inhomogeneities in biological systems. J. Magn. Reson. 151:107–117. [DOI] [PubMed] [Google Scholar]
- 5.Yablonskiy, D. A. 1998. Quantitation of intrinsic magnetic susceptibility-related effects in a tissue matrix. Phantom study. Magn. Reson. Med. 39:417–428. [DOI] [PubMed] [Google Scholar]
- 6.Sukstanskii, A. L., and D. A. Yablonskiy. 2003. Gaussian approximation in the theory of MR signal formation in the presence of structure-specific magnetic field inhomogeneities. J. Magn. Reson. 163:236–247. [DOI] [PubMed] [Google Scholar]
- 7.Fujita, N. 2001. Extravascular contribution of blood oxygenation level-dependent signal changes: a numerical analysis based on a vascular network model. Magn. Reson. Med. 46:723–734. [DOI] [PubMed] [Google Scholar]
- 8.Fujita, N., M. Shinohara, H. Tanaka, K. Yutani, H. Nakamura, and K. Murase. 2003. Quantitative mapping of cerebral deoxyhemoglobin content using MR imaging. Neuroimage. 20:2071–2083. [DOI] [PubMed] [Google Scholar]
- 9.Ogawa, S., R. S. Menon, D. W. Tank, S. G. Kim, H. Merkle, J. M. Ellermann, and K. Ugurbil. 1993. Functional brain mapping by blood oxygenation level-dependent contrast magnetic resonance imaging. A comparison of signal characteristics with a biophysical model. Biophys. J. 64:803–812. [DOI] [PMC free article] [PubMed] [Google Scholar]
- 10.Boxerman, J. L., P. A. Bandettini, K. K. Kwong, J. R. Baker, T. L. Davis, B. R. Rosen, and R. M. Weisskoff. 1995. The intravascular contribution to fMRI signal change: Monte Carlo modeling and diffusion-weighted studies in vivo. Magn. Reson. Med. 34:4–10. [DOI] [PubMed] [Google Scholar]
- 11.Kennan, R. P., J. Zhong, and J. C. Gore. 1994. Intravascular susceptibility contrast mechanisms in tissues. Magn. Reson. Med. 31:9–21. [DOI] [PubMed] [Google Scholar]
- 12.Kiselev, V. G., and S. Posse. 1999. Analytical model of susceptibility-induced MR signal dephasing: effect of diffusion in a microvascular network. Magn. Reson. Med. 41:499–509. [DOI] [PubMed] [Google Scholar]
- 13.Bandettini, P. A., and E. C. Wong. 1995. Effects of biophysical and physiological parameters on brain activation-induced R2* and R2 changes: simulations using a deterministic diffusion model. Int. J. Imag. Syst. Tech. 6:133–152. [Google Scholar]
- 14.Pauling, L., and C. D. Coryell. 1936. The magnetic properties and structure of hemoglobin, oxyhemoglobin and carbonmonoxyhemoglobin. Proc. Natl. Acad. Sci. USA. 22:210–216. [DOI] [PMC free article] [PubMed] [Google Scholar]
- 15.Spees, W. M., D. A. Yablonskiy, M. C. Oswood, and J. J. Ackerman. 2001. Water proton MR properties of human blood at 1.5 Tesla: magnetic susceptibility, T(1), T(2), T*(2), and non-Lorentzian signal behavior. Magn. Reson. Med. 45:533–542. [DOI] [PubMed] [Google Scholar]
- 16.Silvennoinen, M. J., C. S. Clingman, X. Golay, R. A. Kauppinen, and P. C. van Zijl. 2003. Comparison of the dependence of blood R2 and R2* on oxygen saturation at 1.5 and 4.7 Tesla. Magn. Reson. Med. 49:47–60. [DOI] [PubMed] [Google Scholar]
- 17.Hahn, E. L. 1950. Spin echoes. Phys. Rev. 80:580–594. [Google Scholar]
- 18.Haacke, E. M., R. W. Brown, M. R. Thompson, and R. Venkatesan. 1999. Magnetic Resonance Imaging: Physical Principles and Sequence Design. Wiley, New York.
- 19.Carr, H. Y., and E. M. Purcell. 1954. Effects of diffusion on free precession in nuclear magnetic resonance experiments. Phys. Rev. 94:630–638. [Google Scholar]
- 20.An, H., and W. Lin. 2003. Impact of intravascular signal on quantitative measures of cerebral oxygen extraction and blood volume under normo- and hypercapnic conditions using an asymmetric spin echo approach. Magn. Reson. Med. 50:708–716. [DOI] [PubMed] [Google Scholar]
- 21.An, H., and W. Lin. 2002. Cerebral oxygen extraction fraction and cerebral venous blood volume measurements using MRI: effects of magnetic field variation. Magn. Reson. Med. 47:958–966. [DOI] [PubMed] [Google Scholar]
- 22.Klassen, L. M., and R. S. Menon. 2002. Non-invasive absolute deoxyhemoglobin concentration measurement using high field MRI and near infrared spectroscopy. Proc. 13th ISMRM. 1342.


