Abstract
Structural properties of the complex formed between genomic DNA and the intercalating drug ethidium bromide (EtBr) have been determined by use of a Raman microscope equipped with near-infrared laser excitation. The polarized spectra, which were obtained from oriented fibers of the EtBr:DNA complex, are interpreted in terms of the relative orientations of the phenanthridinium ring of EtBr and bases of DNA. Quantification of structure parameters of EtBr and DNA in the complex were assessed using Raman tensors obtained from polarized Raman analyses of oriented specimens of EtBr (single crystal) and DNA (hydrated fiber). We find that the phenanthridinium plane is tilted by 35 ± 5° from the plane perpendicular to the fiber (DNA helix) axis. Assuming coplanarity of the phenanthridinium ring and its immediate base neighbors at the intercalation site, such bases would have a tilt angle closer to that of A-DNA (20°) than to that of B-DNA (6°). The average base tilt in stretches of DNA between intercalation sites remains that of B-DNA.
INTRODUCTION
A rational approach to drug design requires detailed knowledge of the molecular mechanism and specificity of drug-induced DNA structure perturbations (1–6). The acquisition of such information represents a challenging goal for molecular pharmacology, particularly if the DNA target is of chromosomal size and complexity. In the case of intercalating drugs, for which structural information has been obtained primarily by methods of x-ray crystallography and NMR spectroscopy (7–14), the data are limited exclusively to complexes involving very small oligonucleotides. Alternative approaches are required to probe complexes of drugs with larger DNA molecules.
Raman spectroscopy provides a potentially valuable approach for detecting drug-induced structure perturbations of DNA targets. Advantages of the method are its applicability to DNA molecules of any size or topology, irrespective of condensation state (15–23). Until recently, drugs and their DNA complexes were considered ill-suited for Raman spectroscopy, owing to the intense fluorescence of drug chromophores through much of the visible spectrum (400–600 nm). Fluorescence can be circumvented, however, if the Raman spectrum is generated using near-infrared (NIR) rather than visible laser excitation. This has been well illustrated in the NIR-excited Raman spectrum of the prototypical DNA intercalating drug ethidium bromide (EtBr), despite its phenanthridinium fluorophore (24). Importantly, the NIR-Raman spectrum of the complex of EtBr with high-molecular-weight DNA (160 basepair mononucleosomal DNA from calf thymus) exhibits identifiable structural markers of both the drug and DNA (24). The results have provided new mechanistic insights into the intercalation of phenanthridinium into DNA sequences and the extent of ligand-induced DNA unwinding (18,22,23).
In this work we report the acquisition of structurally informative polarized Raman spectra of single crystals of EtBr and oriented fibers of defined EtBr:DNA complexes using a Raman microscope equipped with NIR excitation (785 nm). The results are interpreted to reveal structural relationships between the DNA-bound ethidium drug and the neighboring base and backbone moieties of the DNA substrate. These findings, which augment and extend previously reported Raman studies of solution complexes of EtBr and DNA (24), suggest a model for ethidium intercalation in genomic DNA.
MATERIALS AND METHODS
Preparation of EtBr single crystals
A saturated methanol solution of electrophoresis grade EtBr (Fisher Scientific, Waltham, MA) was prepared and filtered at 60°C. Di-N-butylether was added to the filtrate and the mixture was maintained at 20°C to promote slow solvent evaporation. After 24 h, single crystals of EtBr were observed as elongated plates with parallelogram faces. X-ray analysis (courtesy of Dr. Charles Barnes, Department of Chemistry, University of Missouri-Columbia, and Dr. Tomohiro Sato, Kuroda Project, Graduate School of Arts and Sciences, University of Tokyo) confirmed that the crystals were monoclinic (space group P21/c with unit cell dimensions a = 9.58 Å, b = 10.70 Å, c = 20.24 Å, and θ = 106.3°) (25). The parallelogram face of each crystal was in the 011 plane and the elongation direction was along the a axis.
Preparation of DNA and EtBr:DNA fibers
Complexes of EtBr (Fisher Scientific) and calf thymus DNA (GE Health Care, Piscataway, NJ, lot No. 00544562) were prepared for Raman spectroscopy by mixing stock solutions of EtBr (0.14 mg/mL) and DNA (10 mg/mL in 5 mM NaCl) in the appropriate stoichiometric ratios on the basis of their known molar extinction coefficients (ɛ260 = 6600 M−1cm−1 for DNA and ɛ480 = 5860 M−1cm−1 for EtBr). The resulting solutions were concentrated by evaporation in a hygrostatic chamber maintained at 92% relative humidity (rh) to yield viscous gels that were stretched between opposing glass poles of a fiber pulling apparatus to yield highly oriented fibers, as described (26). Each DNA fiber was maximally oriented (>95%), as judged by comparison of the observed Raman polarizations with those reported previously (26). Fiber complexes were prepared with EtBr/basepair ratios (R) of 0.05, 0.075, and 0.10. For data collections, the fibers were positioned horizontally within a cylindrical glass cell that was sealed with a quartz coverslip and mounted in the Raman microscope.
NIR Raman microspectroscopy
NIR-Raman spectra of oriented specimens (EtBr single crystals, pure DNA fibers, and EtBr:DNA fibers) were obtained using a commercially available Raman microscope system (HoloSpec VPT MicroProbe spectrometer and an Invictus diode laser operating at 785 nm, Kaiser Optical, Ann Arbor, MI). The confocal microscope (model DMLP, Leica Microsystems, Bannockburn, IL) was coupled via a single mode optical fiber to the laser. The beam emerging from the optical fiber was passed through a polarizer before being focused with a 10× objective onto the sample, which was maintained at 92% rh. The Raman scattering at 180° was collected with the same 10× objective and directed through an analyzing polarizer and optical fiber to the spectrometer and detector (model 1340/400 EHRB/1, liquid-nitrogen cooled CCD, Roper Scientific, Tucson, AZ). To prevent radiation damage or excessive heating of the sample, the incident laser power was kept below 10 mW and the sample temperature was maintained at 20°C.
Data collection and analysis
Four components of the polarized Raman spectrum of the EtBr single crystal were observed. These are indexed as aa, ad, da, and dd components, depending upon whether the polarizations of the electric vector of the exciting beam (first index) and analyzed beam (second index) are along the a axis or along the direction d that is in the 011 plane and perpendicular to a. The respective polarized Raman intensities are designated as Iaa, Iad, Ida, and Idd. Independent measurements of Iad and Ida provide a basis for assessing the orientation of the crystalline a axis and 011 face with respect to the electric vector orientations of the incident and Raman-scattered radiation. Identity of these intensities (Iad = Ida) confirms the proper orientation, such that the polarized Raman intensity ratios Iaa/Idd and Iaa/Iad for every band are free from systematic error (27). Similar data were collected on the oriented fibers of EtBr:DNA complexes. In the case of oriented fibers, the corresponding polarized Raman intensities are designated as Ibb, Ibc, Icb, and Icc, where c is the DNA helix axis (i.e., fiber axis) and b is a DNA dyad axis that is perpendicular to c. Baselines for intensity measurements were chosen as previously described (26).
In general, a Raman tensor interrelates two electric vectors, those of the exciting and Raman-scattered radiation. The tensor has six components, αxx, αyy, αzz, αxy, αxz, and αyz, where x, y, and z are rectangular coordinate axes fixed to the molecule but otherwise chosen arbitrarily. We assume the transferability of Raman tensors between solution and either crystal or fiber states (27). If the principal axes of the Raman tensor, which are unique for the Raman band in question, are chosen as the xyz-coordinate system, then the six nonzero tensor components are reduced to the three diagonal components, αxx, αyy, and αzz. In this work, we consider the relative magnitudes of these three principal tensor components, defined by αxx/αzz ≡ r1 and αyy/αzz ≡ r2.
We also employ the Raman band depolarization ratio, ρ ≡ I⊥/I‖, i.e., the intensity ratio of perpendicular and parallel polarized Raman scattering intensities from the solution spectrum of EtBr, to analyze the crystal Raman data. Further details of this approach have been described (27).
RESULTS AND INTERPRETATION
Assignment and Raman tensor of the 1377 cm−1 band of ethidium bromide
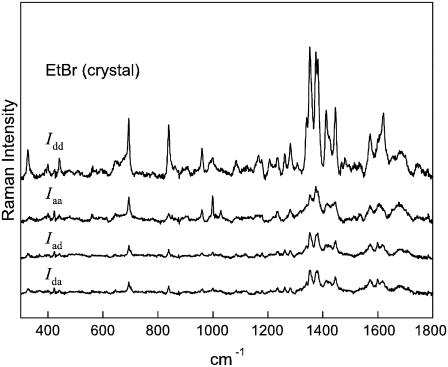
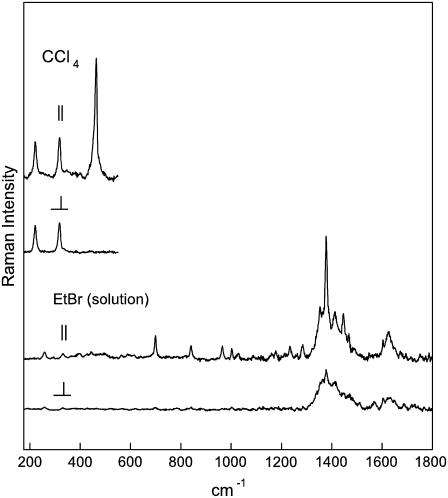
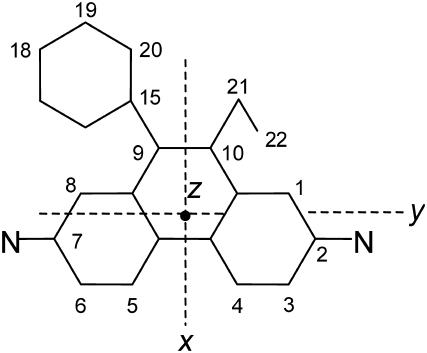
The 785-nm excited Raman spectrum of the EtBr crystal (Fig. 1) is dominated by a group of bands centered near 1377 cm−1. In solution, the most intense band of EtBr also occurs at 1377 cm−1 (Fig. 2). A similar profile is evident for H2O and D2O solution spectra of EtBr excited at 752 nm (24). Based upon the similar Raman profile reported previously for the planar phenanthrene molecule (C2v point group symmetry) (28), the 1377 cm−1 band of ethidium is confidently assigned to the planar phenanthridinium moiety. Specifically, the 1377 cm−1 band is attributed to a symmetrical in-plane stretching vibration of conjugated C–C and C–N bonds of the phenanthridinium ring. On the basis of this assignment, the principal axes (xyz) of the 1377 cm−1 Raman tensor are selected as shown in Fig. 3, such that y is along the line connecting atoms N23 and N24, x is perpendicular to y in the phenanthridinium plane, and z is perpendicular to the phenanthridinium plane.
FIGURE 1.
Polarized Raman spectra (785-nm excitation) of an oriented single crystal of ethidium bromide. The spectral traces are labeled from top to bottom (Idd, Iaa, Iad, Ida) in accordance with the polarized Raman intensity components defined in the text. Crystal field splitting is evident for the most intense bands of the Idd spectrum.
FIGURE 2.
Polarized Raman spectra (785-nm excitation) of an aqueous solution of ethidium bromide (1.6 mg/mL in 100 mM NaCl, pH 7, 20°C). Perpendicular and parallel polarizations are indicated by I⊥ and I‖, respectively. The inset at left shows corresponding polarized Raman spectra of liquid CCl4 (175–600 cm−1 region) to illustrate the accuracy of depolarization measurements.
FIGURE 3.
Structural formula of the ethidium ion and the Raman tensor axis system (xyz) selected for the 1377 cm−1 mode.
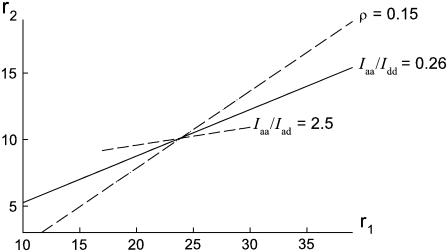
In lieu of the single sharp band at 1377 cm−1 in the solution Raman spectrum of EtBr (Fig. 2), the crystal spectrum exhibits a closely spaced doublet at 1373 and 1382 cm−1 (Fig. 1), most likely reflecting crystal field splitting of the 1377 cm−1 vibration. (The average value of the intensities of the doublet components was used to calculate the 1377 cm−1 band intensity in polarized Raman spectra of the crystal.) The Raman spectrum of the EtBr crystal also exhibits a sharp band at 1349 cm−1 as the crystal counterpart to the 1351 cm−1 band in the solution spectrum. This Raman marker is assigned to a phenanthridinium vibrational mode that is distinct from the 1377 cm−1 mode. We have used the polarized Raman intensity ratios for the 1377 cm−1 band, viz. Iaa/Idd = 0.26 ± 0.01 and Iaa/Iad = 2.5 ± 0.5 from Fig. 1, and I⊥/I‖ = 0.15 ± 0.01 from Fig. 2, to calculate the Raman tensor. The error limits reflect reproducibility among several (three or more) protocols on multiple (two or more) samples that were prepared independently. We have adopted the same procedure described previously for analysis of polarized Raman intensities of DNA (27), which can be summarized as follows.
The observed Raman intensity ratios Iaa/Idd and Iaa/Iad are dependent upon the orientations of each of the four ethidium molecules per unit cell of the EtBr crystal (25). Using the published atomic coordinates of the monoclinic oblique axis system (abc) (25), the atomic coordinates for the rectangular axis system (ade) can be calculated, where the e axis is defined as perpendicular to the previously defined a and d axes. The contributions of molecule i (= 1, 2, 3, 4) of the unit cell to the observed Raman intensity ratios, Iaa/Idd and Iaa/Iad, are given, respectively, by Eqs. 1 and 2:
 |
(1) |
 |
(2) |
where lx, ly, and lz are direction cosines of the xyz axes of molecule i with respect to the a axis, and mx, my, and mz are direction cosines with respect to the d axis.
The sums of contributions from each of the four unit-cell molecules yield the observed polarized Raman intensities:
 |
(3) |
 |
(4) |
For the randomly oriented ethidium molecule in solution, we have also (27)
 |
(5) |
Equations 1–5 can be reproduced as contour lines in r1,r2-space, as shown in Fig. 4. The point of intersection of the contours determines the r1 and r2 values consistent with all of the data, from which we obtain r1 = 23.5 ± 2.5 and r2 = 10.0 ± 1.0.
FIGURE 4.
Plots in r1,r2-space of the Raman intensity ratios Iaa/Idd = 0.26, Iaa/Iad = 2.5, and I⊥/I‖ = 0.15 observed for the 1377 cm−1 band. The point of intersection corresponds to Raman tensor values r1 = 23.5 and r2 = 10.0.
Polarized Raman spectra of the complex of EtBr with DNA
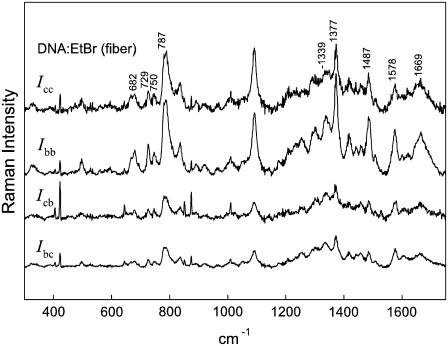
Polarized Raman spectra corresponding to four electric vector directions (Ibb, Icc, Ibc, and Icb) were measured for oriented fibers of EtBr:DNA complexes with R = 0.05, 0.075, and 0.10. For comparison, polarized Raman spectra of B-DNA fibers containing no EtBr (R = 0) were also obtained using 785-nm excitation.
Although each polarized Raman spectrum obtained from B-DNA using 785-nm excitation exhibits the same wavenumber values as the corresponding spectrum obtained using 514.5-nm excitation (26), the relative band intensities are significantly different for the two excitation wavelengths. For example, when compared with the 514.5-nm excited spectrum, the 785-nm excited spectrum of B-DNA exhibits band intensities at 1465 (5′CH2 scissor), 1420 (2′CH2 scissor), 1093 ( symmetric stretching), 836 (O–P–O stretch), and 497 cm−1 (
 scissor) that are greatly enhanced relative to band intensities of DNA base vibrations. Such enhancements, which are observed for each polarization protocol (Icc, Ibb, Icb, Ibc), reflect the fact that the light scattering mechanism for a given Raman band depends on the proximity of the excitation wavelength to the wavelength of electronic absorption of the molecular oscillator (preresonance effect). Thus, in the case of 785-nm excitation, the electronic absorption wavelengths of all DNA oscillators (bases and sugar-phosphates) are sufficiently remote from the excitation wavelength that none exhibits a significant preresonance enhancement; conversely, for 514.5-nm excitation, Raman bands due to all DNA base vibrations are appreciably preresonance enhanced compared to bands due to sugar-phosphate vibrations. Nevertheless, the polarized Raman intensity ratios (Ibb/Icc, Ibb/Ibc, etc.) for any given band are independent of excitation wavelength. We have observed this to be the case for every band of B-DNA.
Spectra for the R = 0.05 complex, which are shown in Fig. 5, indicate that Ibb ≫ Icc for the 1377 cm−1 band of the phenanthridinium moiety. Because the polarizability oscillation for the 1377 cm−1 mode takes place primarily within the phenanthridinium plane (Fig. 4), it can be concluded that the phenanthridinium plane is oriented close to perpendicular to the DNA helix (fiber) axis. Fig. 5 also demonstrates that in the R = 0.05 complex, the principal Raman markers of the DNA bases (bands at 682, 729, 750, 787, 1339, 1487, 1578, and 1669 cm−1) occur at virtually the same wavenumber values and with the same polarization characteristics (Ibb > Icc) as those in fibers of drug-free B-DNA. Thus, the global B-DNA conformation is largely conserved in the R = 0.05 complex. Similar results were obtained for both the R = 0.075 and R = 0.10 complexes, where, as expected, the intensity of the 1377 cm−1 band of EtBr is commensurately greater than that observed in the R = 0.05 complex (data not shown).
FIGURE 5.
Polarized Raman spectra (785-nm excitation) in the region 300–1800 cm−1 of an oriented fiber of the EtBr:DNA complex (R = 0.05). The spectral traces are labeled from top to bottom (Icc, Ibb, Icb, Ibc) in accordance with the text.
Orientation of Ethidium in the EtBr:DNA complex
The orientation of an atomic group with tensor principal axes x, y, and z in relation to a uniaxial lattice with axes a, b, and c is given by two angles, θ and χ (27). The polarized Raman intensity ratios Icc/Ibb and Icc/Ibc are given in terms of θ and χ by Eqs. 6 and 7:
 |
(6) |
 |
(7) |
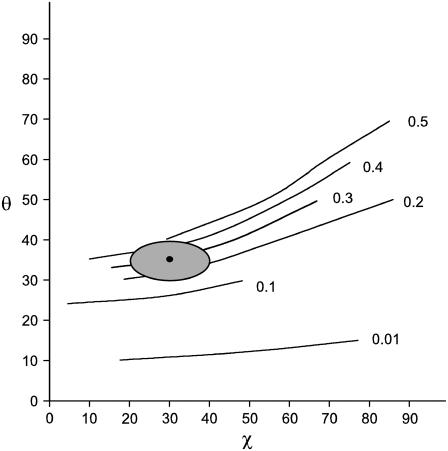
Fig. 6 shows Icc/Ibb contour plots in θ,χ-space for the 1377 cm−1 band of EtBr in the R = 0.05 fiber. The contours were calculated using Eq. 6 and the known Raman tensors (r1 = 23.5 and r2 = 10.0, Fig. 4). Similar contour plots can be generated for the parameter Icc/Ibc (not shown). Using the polarized Raman results of Fig. 5, for which Icc/Ibb = 0.3 ± 0.1 and Icc/Ibc = 1.5 ± 0.5, we find by Eqs. 6 and 7 that the allowed values of θ and χ are confined to the enclosed shaded area of the Fig. 6 map. (The experimental uncertainties in the polarized Raman intensities of Fig. 5 are relatively large because of the overlapping thymine band of DNA at 1375 cm−1. However, the data clearly indicate that Icc/Ibb is neither as high as 0.5 nor as low as 0.1, which corresponds to maximum error limits of ±5° in θ and ±10° in χ.) Thus, the orientation of the phenanthridinium moiety in the R = 0.05 fiber is given by θ = 35 ± 5° and χ = 30 ± 10°. The Icc/Ibb values obtained for the R = 0.075 and R = 0.10 fibers are consistent with this determination, although error limits (noise levels) are nominally higher in the latter spectra. Interestingly, the phenanthridinium plane is tilted with respect to the DNA (fiber) axis by an angle considerably greater than that proposed (∼8°) in an earlier model (29).
FIGURE 6.
Contour map of Icc/Ibb plotted in θ,χ-space for the 1377 cm−1 Raman band of EtBr. Contour lines were calculated using Eq. 6 and the 1377 cm−1 Raman band tensor determined from the EtBr single crystal (see Fig. 1). The value of Icc/Ibb is indicated to the right of each contour line. Here, θ and χ are Eulerian angles defining the orientation of the Raman tensor coordinate system (xyz) with respect to the coordinate system of the fiber (abc) (27). The allowed values of θ (35 ± 5°) and χ (30 ± 10°) are indicated by the shaded oval area.
DISCUSSION AND CONCLUSIONS
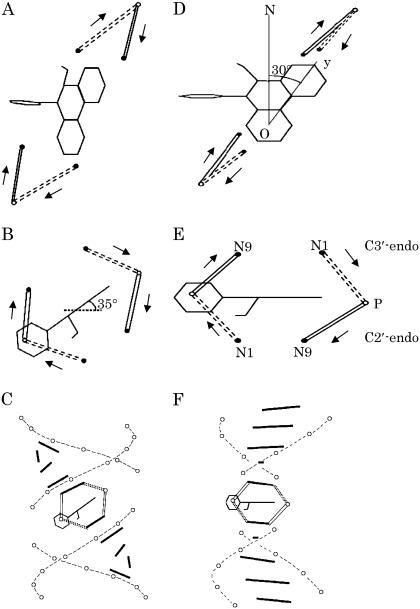
This work shows that for each of the EtBr:DNA fibers studied (R = 0.05, 0.075, 0.1) the polarized Raman intensity ratio Icc/Ibb for the 1377 cm−1 band is never smaller than 0.1. This indicates that the phenanthridinium plane must be significantly inclined from the ab plane of the EtBr:DNA fiber. From the contour plot in Fig. 6 we calculate that the Eulerian angle θ, which defines the tilt of the Raman tensor principal axis z from the fiber axis c, is 35° ± 5°. With this tilt angle and complementary information determined from solution studies of EtBr:DNA complexes (24), a model depicting the local structure at the ethidium intercalation site can be proposed. This model is shown in Fig. 7, diagrams A (view along helix axis) and B (perpendicular to helix axis). Incorporation of the intercalation site into an extended B-DNA helix is represented in diagram C of Fig. 7 (helix axis vertical). For clarity, only the ethidium skeleton and the nucleotide N1, N9, and P atoms are shown.
FIGURE 7.
Structural model proposed for the EtBr:DNA complex on the basis of the polarized Raman measurements is shown in diagrams A (view of the intercalation site along the fiber axis), B (view of the intercalation site perpendicular to the fiber axis), and C (incorporation of the intercalation site into an extended DNA duplex with the helix axis vertical). For comparison, the structure proposed previously for the idealized EtBr:dUpdA·dCpdG complex (29) (see text) is shown in diagrams D, E, and F. In A–C, the orientation of the phenanthridinium moiety is defined by the Eulerian coordinates θ = 35° and χ = 30° (Fig. 6). For clarity, only the phenanthridinium skeleton is shown, and in the case of Fig. 7 E, nucleotide atoms N1, N9, and P atoms are labeled. DNA residues incorporating C2′-endo and C3′-endo puckers are represented, respectively, by solid and broken lines. Arrows identify the 5′ to 3′ direction.
A hypothetical structure of ethidium-bound B-DNA was proposed previously on the basis of the crystal structure of EtBr bound to an RNA fragment, the ribodinucleoside monophosphate duplex UpA·CpG (29). In the hypothetical structure (EtBr:dUpdA·dCpdG), the paired bases were assigned a propeller twist of 10°, tilt of 8°, and helix-axis displacement of 1.0 Å. The helix was underwound by 26° compared with that of canonical B-DNA and its backbone incorporated C2′-endo and C3′-endo puckering, at the modeled deoxyribosyl 5′ and 3′ termini, respectively. The local structure proposed for the intercalation site, which is represented in diagrams D and E of Fig. 7, projects to the duplex structure shown in diagram F of Fig. 7.
Fig. 7 illustrates the principal differences between our DNA-based model and the ribodinucleotide-based model of Sobell et al., particularly in the extent to which the phenanthridinium ring and base planes are tilted at the intercalation site, namely ∼35° in this work (Fig. 7, A–C) vs. ∼8° previously (Fig. 7, D–F)(29). In both cases, nevertheless, the bases that immediately neighbor the EtBr intercalator exhibit a tilt with respect to the local helix axis that is reminiscent of A-DNA. This is consistent with recent solution studies of EtBr:DNA suggesting a highly localized B-to-A perturbation of the DNA conformation upon ethidium intercalation (24,30). Nucleotides remote from the intercalation site retain the conformational characteristics of B-DNA (Fig. 7 C).
A recent analysis of the structures contained in the Nucleic Acid Database (31) suggests that attributes of the A-DNA conformation occur frequently in complexes formed between DNA oligonucleotides and either drugs, proteins, or other ligands (32). The deviations from the canonical B-DNA structure are generally localized to the immediate sites of nucleotide-ligand interaction. These findings are consistent with this pattern of ligand-induced modification of the local DNA structure. Additionally, our results show that the phenomenon of ligand-induced B-to-A perturbation is not restricted to the small DNA targets (oligonucleotides) comprising the Nucleic Acid Database, but is common to the genomic-sized DNA target used in the polarized Raman experiments. Localized structural perturbation of genomic DNA—like that detected here for EtBr intercalation—may be sufficient to impact recognition by gene regulatory factors. In this scenario, it would be the conformation of the DNA rather than the base sequence per se that is sensed by the regulatory factor.
Here, we have demonstrated how polarized Raman spectroscopy can be exploited to ascertain local and long-range effects of nonspecific drug binding to high molecular weight DNA. The methodology is not limited to intercalated DNA and should prove useful for probing other types of genomic complexes.
Acknowledgments
This work is article LXXXV in the series Raman Spectral Studies of Nucleic Acids, supported by National Institutes of Health grant GM54378, which is gratefully acknowledged.
Masamichi Tsuboi's permanent address is College of Science and Engineering, Iwaki-Meisei University, Iwaki, Fukushima, Japan.
References
- 1.Ren, J., and J. B. Chaires. 1999. Sequence and structural selectivity of nucleic acid binding ligands. Biochemistry. 38:16067–16075. [DOI] [PubMed] [Google Scholar]
- 2.Ren, J., T. C. Jenkins, and J. B. Chaires. 2000. Energetics of DNA intercalation reactions. Biochemistry. 39:8439–8447. [DOI] [PubMed] [Google Scholar]
- 3.Haq, I., and J. Ladbury. 2000. Drug-DNA recognition: energetics and implications for design. J. Mol. Recognit. 13:188–197. [DOI] [PubMed] [Google Scholar]
- 4.Han, X., and X. Gao. 2001. Sequence specific recognition of ligand-DNA complexes studied by NMR. Curr. Med. Chem. 8:551–581. [DOI] [PubMed] [Google Scholar]
- 5.Chaires, J. B. 2001. Analysis and interpretation of ligand-DNA binding isotherms. Methods Enzymol. 340:3–22. [DOI] [PubMed] [Google Scholar]
- 6.Haq, I. 2002. Thermodynamics of drug-DNA interactions. Arch. Biochem. Biophys. 403:1–15. [DOI] [PubMed] [Google Scholar]
- 7.Jain, S. C., and H. M. Sobell. 1984. Visualization of drug-nucleic acid interactions at atomic resolution. VIII. Structures of two ethidium/dinucleoside monophosphate crystalline complexes containing ethidium:cytidylyl (3′-5′) guanosine. J. Biomol. Struct. Dyn. 1:1179–1194. [DOI] [PubMed] [Google Scholar]
- 8.Jain, S. C., and H. M. Sobell. 1984. Visualization of drug-nucleic acid interactions at atomic resolution. VII. Structure of an ethidium/dinucleoside monophosphate crystalline complex, ethidium: uridylyl(3′-5′) adenosine. J. Biomol. Struct. Dyn. 1:1161–1177. [DOI] [PubMed] [Google Scholar]
- 9.Sakore, T. D., K. K. Bhandary, and H. M. Sobell. 1984. Visualization of drug-nucleic acid interactions at atomic resolution. X. Structure of a N,N-dimethylproflavine: deoxycytidylyl(3′-5′)deoxyguanosine crystalline complex. J. Biomol. Struct. Dyn. 1:1219–1227. [DOI] [PubMed] [Google Scholar]
- 10.Bhandary, K. K., T. D. Sakore, H. M. Sobell, D. King, and E. J. Gabbay. 1984. Visualization of drug-nucleic acid interactions at atomic resolution. IX. Structures of two N,N-dimethylproflavine: 5-iodocytidylyl (3′-5′) guanosine crystalline complexes. J. Biomol. Struct. Dyn. 1:1195–1217. [DOI] [PubMed] [Google Scholar]
- 11.Lybrand, T., and P. Kollman. 1985. Molecular mechanical calculations on the interaction of ethidium cation with double-helical DNA. Biopolymers. 24:1863–1879. [DOI] [PubMed] [Google Scholar]
- 12.Moravek, Z., S. Neidle, and B. Schneider. 2002. Protein and drug interactions in the minor groove of DNA. Nucleic Acids Res. 30:1182–1191. [DOI] [PMC free article] [PubMed] [Google Scholar]
- 13.Patel, D. J. 1997. Structural analysis of nucleic acid aptamers. Curr. Opin. Chem. Biol. 1:32–46. [DOI] [PubMed] [Google Scholar]
- 14.Feigon, J., W. Leupin, W. A. Denny, and D. R. Kearns. 1982. Binding of ethidium derivatives to natural DNA: a 300 MHz 1H NMR study. Nucleic Acids Res. 10:749–762. [DOI] [PMC free article] [PubMed] [Google Scholar]
- 15.Duguid, J. G., V. A. Bloomfield, J. M. Benevides, and G. J. Thomas Jr. 1996. DNA melting investigated by differential scanning calorimetry and Raman spectroscopy. Biophys. J. 71:3350–3360. [DOI] [PMC free article] [PubMed] [Google Scholar]
- 16.Deng, H., V. A. Bloomfield, J. M. Benevides, and G. J. Thomas Jr. 1999. Dependence of the Raman signature of genomic B-DNA on nucleotide base sequence. Biopolymers. 50:656–666. [DOI] [PubMed] [Google Scholar]
- 17.Serban, D., J. M. Benevides, and G. J. Thomas Jr. 2002. DNA secondary structure and Raman markers of supercoiling in Escherichia coli plasmid pUC19. Biochemistry. 41:847–853. [DOI] [PubMed] [Google Scholar]
- 18.Serban, D., J. M. Benevides, and G. J. Thomas Jr. 2003. HU protein employs similar mechanisms of minor-groove recognition in binding to different B-DNA sites: demonstration by Raman spectroscopy. Biochemistry. 42:7390–7399. [DOI] [PubMed] [Google Scholar]
- 19.Thomas, G. J., Jr., and M. Tsuboi. 1993. Raman spectroscopy of nucleic acids and their complexes. C. A. Bush, editor. JAI Press, Greenwich, CT. 1–70.
- 20.Thomas, G. J., Jr., Benevides, J. Duguid, and V. A. Bloomfield. 1993. Roles of cations in the structure, stability and condensation of DNA. In Spectroscopy of Biological Molecules. T. Theophanides, J. Anastassapoulou, and N. Fotopoulos, editors. Kluwer Academic Publishers, Dordrecht, The Netherlands. 39–45.
- 21.Deng, H., V. A. Bloomfield, J. M. Benevides, and G. J. Thomas. 2000. Structural basis of polyamine-DNA recognition: spermidine and spermine interactions with genomic B-DNAs of different GC content probed by Raman spectroscopy. Nucleic Acids Res. 28:3379–3385. [DOI] [PMC free article] [PubMed] [Google Scholar]
- 22.Benevides, J. M., G. Chan, X. J. Lu, W. K. Olson, M. A. Weiss, and G. J. Thomas Jr. 2000. Protein-directed DNA structure. I. Raman spectroscopy of a high-mobility-group box with application to human sex reversal. Biochemistry. 39:537–547. [DOI] [PubMed] [Google Scholar]
- 23.Benevides, J. M., T. Li, X. J. Lu, A. R. Srinivasan, W. K. Olson, M. A. Weiss, and G. J. Thomas Jr. 2000. Protein-directed DNA structure II. Raman spectroscopy of a leucine zipper bZIP complex. Biochemistry. 39:548–556. [DOI] [PubMed] [Google Scholar]
- 24.Benevides, J. M., and G. J. Thomas Jr. 2005. Local conformational changes induced in B-DNA by ethidium intercalation. Biochemistry. 44:2993–2999. [DOI] [PubMed] [Google Scholar]
- 25.Subramanian, E., J. Trotter, and C. E. Bugg. 1971. Crystal structure of ethidium bromide. J. Cryst. Mol. Struct. 1:3–15. [Google Scholar]
- 26.Thomas, G. J., Jr., J. M. Benevides, S. A. Overman, T. Ueda, K. Ushizawa, M. Saitoh, and M. Tsuboi. 1995. Polarized Raman spectra of oriented fibers of A-DNA and B-DNA: anisotropic and isotropic local Raman tensors of base and backbone vibrations. Biophys. J. 68:1073–1088. [DOI] [PMC free article] [PubMed] [Google Scholar]
- 27.Tsuboi, M., and G. J. Thomas Jr. 1997. Raman scattering tensors in biological molecules and their assemblies. Appl. Spectrosc. Revs. 32:263–299. [Google Scholar]
- 28.Gay, J., R. Kara, and J. P. Mathieu. 1961. Electrical and optical properties of crystallized phenanthrene. Bull. Soc. Franc. Mineral. Cryst. 84:187–190. [Google Scholar]
- 29.Sobell, H. M., C. C. Tsai, S. C. Jain, and S. G. Gilbert. 1977. Visualization of drug-nucleic acid interactions at atomic resolution. III. Unifying structural concepts in understanding drug-DNA interactions and their broader implications in understanding protein-DNA interactions. J. Mol. Biol. 114:333–365. [DOI] [PubMed] [Google Scholar]
- 30.Yuzaki, K., and H. Hamaguchi. 2004. Intercalation-induced structural change of DNA as studied by 1064 nm near-infrared multichanel Raman spectroscopy. J. Raman Spectrosc. 35:1013–1015. [Google Scholar]
- 31.Berman, H. M., W. K. Olson, D. L. Beveridge, J. Westbrook, A. Gelbin, T. Demeny, S. H. Hsieh, A. R. Srinivasan, and B. Schneider. 1992. The nucleic acid database. A comprehensive relational database of three-dimensional structures of nucleic acids. Biophys. J. 63:751–759. [DOI] [PMC free article] [PubMed] [Google Scholar]
- 32.Lu, X. J., Z. Shakked, and W. K. Olson. 2000. A-form conformational motifs in ligand-bound DNA structures. J. Mol. Biol. 300:819–840. [DOI] [PubMed] [Google Scholar]


