Abstract
We describe the development of a new methodology to probe the plasma membrane organization of living cells at the nanometric scale. Single nanometric apertures in a metallic film limit the observed membrane area below the optical diffraction barrier. The new approach performs fluorescence correlation spectroscopy with increasing aperture sizes and extracts information on the diffusion process from the whole set of data. In particular, transient diffusion regimes are clearly observed when the probed area comes close to the size of the confining structures. First, this strategy allows identification of the mechanism controlling the diffusion of various fluorescent lipid analogs and green fluorescent protein-tagged proteins. Second, it gives an estimate of the characteristic size of the nanometric membrane heterogeneities, allowing a quantitative study of membrane domains such as lipid rafts. Compared to other optical techniques, this method combines the advantages of high spatio-temporal resolution and direct statistical analysis.
INTRODUCTION
Understanding the cell membrane organization is a major biological issue, with implications in cell signaling, adhesion, and trafficking (1–3). Among the debated questions, most attention was paid to membrane heterogeneities, which are commonly investigated by monitoring the diffusion of lipids and membrane proteins. For years, most measurements of lateral diffusion have been made by fluorescence recovery after photobleaching (FRAP) (4,5), showing that membrane heterogeneities impede the diffusion of lipids and proteins (6). However, FRAP investigates an area at least ten times larger than the laser spot, so that it is therefore difficult to infer deviations from Brownian diffusion. Single particle tracking (SPT) offers a powerful alternative by tracking individual labeled molecules with a high spatial resolution of ∼10–30 nm (7,8). SPT was successfully applied to reveal membrane corrals (9) and domains (10), but it appears presently limited by a low temporal resolution (often in the millisecond range) and a tedious data analysis. Fluorescence correlation spectroscopy (FCS) is a third method, used to monitor the mobility of individual fluorescent probes across a well-defined observation volume (11). Compared to SPT, FCS allows a better temporal resolution and also an easier data analysis, as statistical averaging is directly carried out in FCS. The main limitation of standard FCS is its spatial resolution of ∼300 nm set by the diffraction of light. This drawback can be overcome by using nanometric apertures milled in a metallic film (12–14), but no quantitative application to the question of membrane organization has ever been demonstrated. Moreover, while performing FCS experiments with only a single nanoaperture size, it appears almost impossible to extract relevant information on membrane heterogeneities.
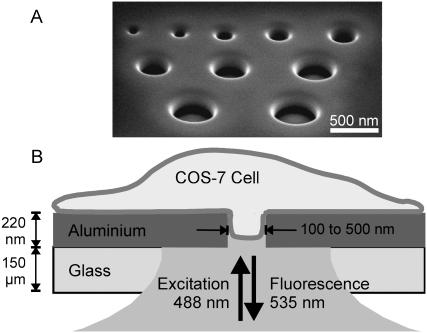
In this study, we describe the development of a methodology to probe the ultrafine organization of living cell membranes by combining FCS with single nanometric apertures of different sizes. The main innovation is that our strategy allows us to identify the mechanism controlling the diffusion of the different molecular components and also provides an estimate for the characteristic size of the nanometric membrane heterostructures. This yields a technique having both high spatial and temporal resolution together with a direct statistical analysis. Living cells with fluorescently labeled membrane components (lipid analogs and green fluorescent protein (GFP)-tagged proteins) are incubated over isolated nanoapertures milled in a metallic film with radii between 75 and 250 nm. The single apertures act as pinholes directly located under the cell membrane and restrict the observation area below the diffraction limit (this is illustrated in Fig. 1). Performing FCS experiments with increasing aperture sizes, we clearly demonstrate that transient regimes are observed when the probed area is close to the size of the confining structures, revealing nanometric membrane heterogeneities. Based on numerical simulations and previous theoretical work (15), we identify the mechanism controlling the diffusion and give an estimate of the characteristic size of the heterogeneities. To validate the method, we compare the diffusion behaviors of different membrane components. For every molecule that we probed, the data obtained within larger nanoholes agrees well with the results using diffraction-limited spots and extensive drug treatments (16). This further rules out the possibility that the observed regimes are artifactual.
FIGURE 1.
(A) Electron micrograph image of a set of nanoapertures of various diameters under oblique illumination. This set was only intended for display, as isolated apertures were used in this study. (B) Experimental arrangement of the sample.
MATERIALS AND METHODS
Plasmid constructs, cell culture, and transfection
The GFP- glycosylphophatidylinositol (GPI) (gifted from A. LeBivic, IBDML, Marseille) and human transferrin receptor (TfR)-GFP constructs were previously described (16). All experiments were carried out on COS-7 cells (ATCC, CRL-1657). Cells were grown at 37°C, 7% CO2, in DME supplemented with 10% fetal calf serum, glutamine, and sodium pyruvate. Transfections were performed with ExGen 500 as per the manufacturer's instructions (Euromedex, Souffelweyersheim, France) and stable expressing cells were cloned after selection for G418 resistance.
Cell culture over nanoapertures
Optically opaque aluminum films (thickness 220 nm) were deposited on standard microscope glass coverslips (thickness 150 μm). Focused ion beam technique (FIB) was then used to mill circular nanometric apertures with radii ranging from 75 to 250 nm. The samples were washed for 3 min in an ultrasonic cleaner before rinsing with diluted ethanol (70°) and evaporation of the alcohol residue. We placed a drop of culture medium containing trypsinized COS-7 (ATCC, CRL-1657) cells 40 h before the FCS experiments, to allow cell-substrate adhesion. Cells adhered to the metal surface and conformed to nanoapertures spontaneously.
Fluorescent staining with lipid analogs
Phosphatidylcholine (PC) and ganglioside (GM1) lipids were labeled with the 4,4-difluoro-5,7-dimethyl-4-bora-3a,4a-diaza-s-indacene (BODIPY) fluorophore (Molecular Probes, Leiden, The Netherlands). Equimolar complexes of 0.05 μM BODIPY phosphatidylcholine PC (FL-PC) or BODIPY ganglioside GM1 (FL-GM1) with defatted BSA were prepared in HBSS/HEPES buffer (Hanks' buffered salt solution containing 10 mM HEPES pH 7.4). Cell cultures were washed in HBSS/HEPES, incubated with the 0.05 μM lipid/BSA complex in HBSS/HEPES for 30 min at 20°C, rinsed and incubated subsequently in HBSS/HEPES at 37°C. FL-PC staining was done immediately previous to the FCS measurements and FL-GM1 staining at least 12 h before the measurements.
Cholesterol conversion
To modify the cholesterol composition of the plasma membrane, cells were treated with Streptomyces sp. cholesterol oxidase (COase, Calbiochem) in serum-free HBSS/HEPES buffer, incubated with COase at 1 U/mL for 60 min at 37°C and finally rinsed in HBSS/HEPES buffer. All FCS measurements were completed within 60 min after cellular treatments. In this condition, ∼20% of the total cell cholesterol was converted into cholestenone (16). We think that the effect of cholesterol oxidation on raft disorganization originates from a combined effect of cholesterol concentration decrease and production of cholestenone bearing antagonizing action to ordered domains (17).
FCS apparatus
FCS experiments were performed on a custom setup based on an Axiovert 200M microscope (Zeiss, Jena, Germany) with a Zeiss C-Apochromat 40×, numerical aperture 1.2 objective lens and a three-axis piezo-scanner (Physik Instrument, Karlsruhe, Germany). The laser power was lowered to 2.5 μW to avoid cell damage and dye photobleaching. Fluorescence was collected by the same objective, filtered by a dichroic mirror and a confocal pinhole before detection by two avalanche photodiodes through a 50/50 splitter and 535 ± 20 nm bandpass filters. Cross correlations using a hardware correlator (ALV-GmBH, Langen, Germany) between the two photodiodes was used to reduce artifacts. For each aperture diameter, FCS measurements were performed on a minimum of 6 different cells. Each measurement was obtained from 20 runs of 5 s duration. For experiments with diffraction-limited beams, the observation areas were calibrated using FCS measurements on rhodamine-6G in aqueous solution (the diffusion coefficient was taken as 280 μm2/s). Due to technical concerns with the microscope apparatus at the beginning of this study, FCS measurements on living cells were carried out at 27°C for lipid analogs and at 37°C for GFP-tagged proteins.
Fitting the autocorrelation functions
For free Brownian two-dimensional diffusion in the case of a Gaussian molecular detection efficiency, the fluorescence autocorrelation function (ACF) is given by
 |
(1) |
where N denotes the average number of molecules in the observation area and τd the diffusion time. τd is linked to the laser beam transversal waist w and the molecular diffusion coefficient D by  . In this case, τd also equals the ACF lag time at half-maximum.
For FCS measurements on lipids analogs, a single membrane component fit following Eq. 1 was implemented. Even for the smallest apertures used, this procedure efficiently fitted the experimental data, as shown on Fig. 2. In FCS experiments conducted on the chimeric proteins, two diffusive species were associated to the ACF, as already reported in (16). The faster component had diffusion times τfast of the order of 0.5–1 ms (linked to species diffusing in the intracellular pool), whereas the longer component experienced clearly distinct diffusion times τd of ∼20 ms (two-dimensional diffusion across the membrane). This is taken into account in the ACF numerical fits by introducing a supplementary free variable A to account for the relative weight of the slow (membrane-bound) species:
 |
(2) |
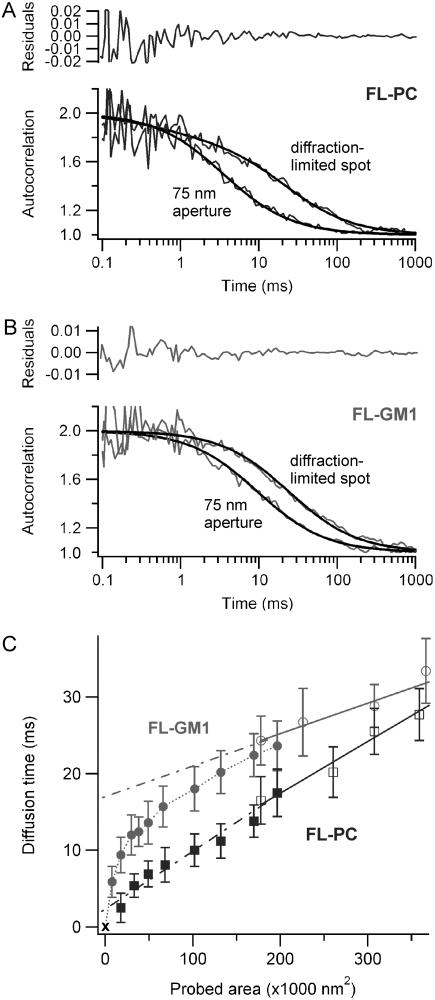
FIGURE 2.
(A) Normalized autocorrelation functions and numerical fits obtained for FL-PC using an open diffraction-limited beam (240-nm waist) or a 75-nm radius aperture. The upper graph shows the residuals of the fit for the 75-nm aperture case. (B) Same as A for the FL-GM1 lipid analog. (C) FCS diffusion laws for FL-PC (squares) and FL-GM1 (circles). The open markers correspond to open beam measurements, whereas the solid markers refer to the nanoaperture experiments (the dotted line is to guide the eyes). Solid lines are numerical fits to the open-beam experiments; these lines are extended below the diffraction limit by the dash-dotted lines. Errors bars represent the mean standard deviation.
In open-beam FCS experiments and for the wider apertures, A was found to be of the order of 65–70%. When the aperture radius was reduced, the depth of field was also restricted, which limited the influence of the cytosolic fluorescing species. Typically, for a 150-nm radius aperture, A was ∼75%. It increased to 85% for a 110-nm aperture, and to almost 100% for a 75-nm radius aperture. Thus for these smallest apertures, the diffusion time τd could be simply taken as the ACF lag time at half-maximum.
RESULTS
The method reveals different diffusion behaviors for lipid analogs FL-PC and FL-GM1, indicating either free-like or hindered diffusion
We first examine the diffusion of the fluorescent phosphatidylcholine FL-PC in a COS-7 cell membrane. Fig. 2 A shows two fluorescence ACFs obtained for FL-PC using a 75-nm radius nanohole and a diffraction-limited spot of 240-nm waist. The ACFs were numerically fitted to determine the diffusion time τd (see the Methods section for a description of the fitting procedure). The extracted diffusion times were then plotted against the aperture area and against the laser spot area (as in (15,16), this curve is referred to as FCS diffusion law, see Fig. 2 C). Aperture radii varied from 75 to 250 nm in radius, whereas diffraction-limited spot waists were set from 240 to 350 nm by changing the microscope objective's filling factor (15). Fig. 2 C shows that the diffusion time τd for FL-PC varies almost linearly with the observation area over the whole range being probed. A small slope change may be pointed out around r ∼ 125 nm (area ∼5 × 10⁴ nm2), but this comes close to the sensitivity of our apparatus, and appears a minor discrepancy compared to the transient regimes found for the other membrane components (see the discussion in the Supplementary Material online). Two conclusions can thus be drawn: i), FL-PC diffusion within the membrane is apparently unhindered by the nanoaperture; and ii), the observation volume is set by the aperture area.
Although cells, culture conditions and labeling methods were the same, ganglioside analogs FL-GM1 have a completely different diffusion behavior, as reported in Fig. 2 C. At aperture radii below 100 nm, τd increases almost linearly with the aperture area. FL-GM1 diffusion then experiences a marked transition at a characteristic radius of ∼100 nm, before taking an affine regime. From the slope at r < 80 nm, expressing τd as τd = area/(4πD), we estimate an effective coefficient D = 0.36 ± 0.10 μm2/s. For larger observation areas (r > 200 nm), τd can be written as τd = area/(4πD) + t0, with t0 = 16.3 ± 1.5 ms and D = 1.7 ± 0.2 μm2/s. The difference between these regimes enlightens the transition between the diffusion behaviors, even if D cannot be straightforwardly interpreted as the exact diffusion coefficients before and after the transition.
The relative change of diffusion behaviors measured for FL-PC and FL-GM1 guarantees the relevance of the method. These lipid analogs exhibit very different diffusion laws, indicating that our observations depend on the probed component. For the range of nanoaperture diameters tested, this rules out the possibility that the observed regimes are artifactual. This point is reinforced by the fact that for every marker the diffusion times within larger nanoholes (r > 200 nm) agrees nicely with those obtained using diffraction-limited spots. It is probable that the membrane area within nanoholes does not equal the aperture area, but the correction could only account for slight changes of diffusion laws but cannot explain the different behaviors (see the discussion in the Supplementary Material online). Hereafter, we will extract information on the heterogeneities hindering the diffusion of FL-GM1, but before we describe experimental data on the diffusion of GPI-anchored proteins.
The diffusion of GPI-anchored protein is hindered by cholesterol-dependent structures
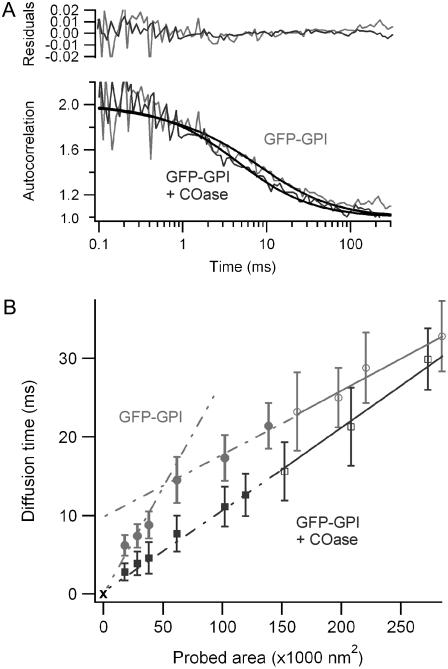
We investigated the diffusion of the green fluorescent protein (GFP) anchored to a glycosylphophatidylinositol (GPI). Fig. 3 summarizes the results, showing a typical ACF function obtained for a 95-nm radius nanoaperture together with the corresponding curve of the average diffusion time versus the aperture area. Fig. S2 of the Supplementary Material shows nonnormalized ACFs in nanoapertures of various radii. The FCS diffusion law of GFP-GPI displays a marked transition at a characteristic radius of ∼120 nm (Fig. 3 B). From the slope at r < 100 nm, we estimate an effective coefficient D = 0.30 ± 0.05 μm2/s, whereas for r > 140 nm, we get D = 0.9 ± 0.2 μm2/s, which is ∼3 times the value found for r < 100 nm (expressing τd = area/(4πD) + t0, with t0 = 8.7 ± 1.3 ms). Again, the results obtained for the largest apertures match well with those obtained using diffraction-limited beams, indicating that the probed area is defined by the aperture area and that the aperture does not strongly alter the diffusion process.
FIGURE 3.
(A) Normalized autocorrelation functions and numerical fits for GFP-GPI in a 95-nm radius aperture with (gray) or without (black) 1U/mL COase treatment. The upper graph displays the residuals of the fits. (B) FCS diffusion laws for untreated GFP-GPI (gray circles) and GFP-GPI with 1 U/mL COase (black squares). Open markers correspond to open beam measurements, and solid markers refer to the nanoaperture experiments. Solid lines are numerical fits to the open-beam data. Errors bars represent the mean standard deviation.
We next modified the cholesterol composition of the plasma membrane, since this component is likely to play a significant role in the formation and stability of lipid domains. To achieve this, cholesterol was converted into cholestenone by a cholesterol oxidase (COase) treatment at 1 U/mL. This treatment had a dramatic effect on the diffusion of GFP-GPI, as a linear behavior of the diffusion time versus the probed area was recovered after COase treatment (see Fig. 3 B). This free-like two-dimensional diffusion held true for every spot size from 75 to 380 nm, with an effective coefficient D = 0.72 ± 0.05 μm2/s and an almost null intercept time at origin t0 = 0.1 ± 0.3 ms consistent with unhindered diffusion (16). This effect confirms that the observed diffusion regimes are not induced by the nanoapertures. The diffusion of GFP-GPI is clearly shown to be cholesterol-dependent, which is consistent with previous studies (16,18).
Microdomain model simulations and estimates for the sizes of domains
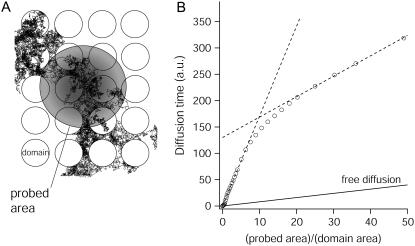
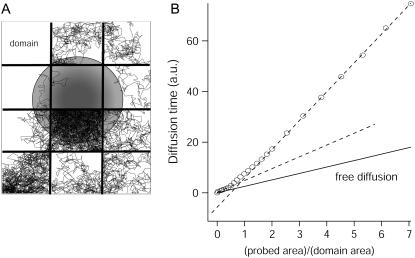
We recently developed numerical models of diffusion into a membrane with confinement structures (15). These structures are areas which confine molecules transiently: their boundaries are sufficiently impenetrable so that the confinement time within the corral is longer than the diffusion time across it. We first consider the case of isolated domains, as indicated in Fig. 4 A. In a previous theoretical study, we have shown that diffusion in a such landscape leads to FCS diffusion laws with a marked transition from linear to affine with a positive shift (15). Briefly, isolated domains are assumed to be circular with radius a, periodically spaced and static. In this model, molecules can diffuse in and out of the domains with a prescribed probability. The simulations do not depend on the position of the observation area relative to the confining domains, as we averaged the simulated data for the different positions of the beam area. The simulated average diffusion time τd is displayed in Fig. 4 B versus the normalized area 
FIGURE 4.
Simulated diffusion laws for isolated domains (A). The molecules diffuse inside and outside the domains, and are trapped transiently within them. Diffusion is measured by FCS within the probed area (gray disk), leading to the FCS diffusion law (B). Simulation parameters (15): domains density d = 0.55,  , Din/Dout = 1/5.
The features observed for FL-GM1 and GFP-GPI (slope change and transient regime) are nicely reproduced by this microdomain model, the transitions being understood as the crossover from confined to normal diffusion. The characteristic transition in our simulations occurs at an observation area corresponding to  . We can thus estimate the radii of the confining structures to be ∼40 nm for GFP-GPI and 30 nm for FL-GM1. These results come fully within the framework of lipid rafts (19,20).
Transferrin receptor TfR evidences that a cytoskeleton-mediated meshwork also contributes to the lateral compartmentalization in the cell membrane
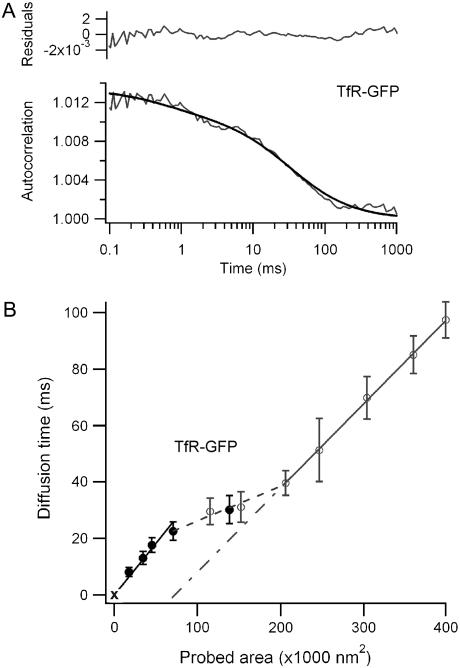
A cytoskeleton-mediated meshwork also plays a critical role in the membrane lateral organization (9,21). We thus investigated the diffusion of the human transferrin receptor TfR, a transmembrane protein was tagged with the fluorescent protein EGFP (TfR-GFP) whose diffusion is sensitive to the actin cytoskeleton. Fig. 5 displays a typical ACF function obtained for a 210-nm radius nanoaperture, together with the corresponding FCS diffusion law. The results for TfR-GFP clearly differ from the diffusion laws found for GFP-GPI and FL-GM1. Fig. 5 B shows two transitions, respectively at r ∼ 150 nm and r ∼ 230 nm. As the probed area increases, the diffusion time grows first with an apparent coefficient D = 0.23 ± 0.02 μm2/s, then levels off to D = 0.7 ± 0.1 μm2/s, before increasing again with an effective diffusion rate D = 0.27 ± 0.03 μm2/s and a negative time intercept at the origin t0 = -22 ± 2 ms.
FIGURE 5.
(A) Autocorrelation function and numerical fit for TfR-GFP in a 210-nm radius aperture, where the characteristic transition takes place. The upper graph displays the residuals of the fit. (B) FCS diffusion laws for TfR-GFP. The open markers correspond to open beam measurements, whereas the solid markers refer to the nanoaperture experiments (the dotted lines are to guide the eyes).
To describe the diffusion within the cytoskeleton-mediated meshwork, we developed a numerical model including a network of barriers, as displayed in Fig. 6 . Molecules diffuse within corrals and hop between domains with a prescribed probability. As indicated in Fig. 6 B, the transition observed at large area for TfR-GFP comes well within the barrier network model, confirming that fences play a critical role in the compartmentalization of transmembrane proteins. For the meshwork model, the characteristic transition in the FCS law occurs at  . From the measurements on TfR-GFP, the characteristic size of the network can be estimated to be ∼230 nm, which appears consistent with the mesh size found for the actin meshwork in rat kidney fibroblast (21).
FIGURE 6.
Simulated diffusion laws for a network of barriers defining contiguous corrals (A). Molecules diffuse within corrals and move from one domain to a neighbored one with a prescribed probability. Diffusion is measured by FCS within the probed area (gray disk), leading to the diffusion law (B). We considered  ; details of simulations can be found in Wawrezinieck et al. (15).
The shape of the FCS diffusion law in small radii nanoapertures suggests that confinement within discrete microdomains may also occur. This point is reinforced by previous studies using diffraction-limited laser beams (16), where it was shown that high cytochalasin D concentrations disrupted the actin meshwork and led to a positive y-axis intercept t0. When both actin-based fences and cholesterol were simultaneously modified, the diffusion time was found to be linear with the probed area, thus recovering free-like diffusion behavior. It thus seems likely that the effects of fences and microdomain confinement add each other. From the results displayed in Fig. 5 B for probed areas below 105 nm2 and the microdomain numerical model, we can thus estimate the radii of the microdomain confining structures to be ∼50 nm for TfR-GFP.
CONCLUSION
We described what we believe is a novel optical approach to explore the ultrafine organization of the plasma membrane. Combining single nanometric apertures of different sizes with FCS, we observe different diffusion regimes, which reveal the kind and the size of the nanometric membrane heterostructures. Compared to conventional FCS, our method has a high spatial resolution, necessary to quantify the size of membrane heterogeneities at the submicron scale. Alternatively to single particle tracking, our approach takes advantage of a high temporal resolution at the microsecond range together with a simple data analysis. Thanks to the recent technical progress in nanotechnology and the development of numerous nanofabrication facilities, the well-established method of FCS can be readily improved by this method. There is thus a high immediate practical relevance for the quantitative study of membrane domains and molecular interactions in membranes.
SUPPLEMENTARY MATERIAL
An online supplement to this article can be found by visiting BJ Online at http://www.biophysj.org.
Acknowledgments
We thank P. Sens, E. Popov, N. Bonod, and A. Talneau for fruitful discussions and E. Gallery for editing the English.
This work was supported by the “ACI Nanosciences” of the French Research ministry, specific grants from UE FEDER and institutional grants from CNRS and INSERM.
References
- 1.Edidin, M. 2003. Lipids on the frontier: a century of cell-membrane bilayers. Nat. Rev. Mol. Cell Biol. 4:414–418. [DOI] [PubMed] [Google Scholar]
- 2.Simons, K., and W. L. C. Vaz. 2004. Model systems, lipid rafts, and cell membranes. Annu. Rev. Biophys. Biomol. Struct. 33:269–295. [DOI] [PubMed] [Google Scholar]
- 3.Marguet, D., P. F. Lenne, H. Rigneault, and H.-T. He. 2006. Dynamics in the plasma membrane: how to combine fluidity and order. EMBO J. 25:3446–3457. [DOI] [PMC free article] [PubMed] [Google Scholar]
- 4.Axelrod, D., D. E. Koppel, J. Schlessinger, E. L. Elson, and W. W. Webb. 1976. Mobility measurement by analysis of fluorescence photobleaching recovery kinetics. Biophys. J. 16:1055–1069. [DOI] [PMC free article] [PubMed] [Google Scholar]
- 5.Meder, D., M. Joao Moreno, P. Verkade, W. L. C. Vaz, and K. Simons. 2006. Phase coexistence and connectivity in the apical membrane of polarized epithelial cells. Proc. Natl. Acad. Sci. USA. 103:329–334. [DOI] [PMC free article] [PubMed] [Google Scholar]
- 6.Yechiel, E., and M. Edidin. 1987. Micrometer-scale domains in fibroblast plasma membranes. J. Cell Biol. 105:755–760. [DOI] [PMC free article] [PubMed] [Google Scholar]
- 7.Saxton, M. J., and K. Jacobson. 1997. Single-particle tracking: applications to membrane dynamics. Annu. Rev. Biophys. Biomol. Struct. 26:373–399. [DOI] [PubMed] [Google Scholar]
- 8.Kusumi, A., C. Nakada, K. Ritchie, K. Murase, K. Suzuki, H. Murakoshi, R. S. Kasai, J. Kondo, and T. Fujiwara. 2005. Paradigm shift of the plasma membrane concept from the two-dimensional continuum fluid to the partitioned fluid: high-speed single-molecule tracking of membrane molecules. Annu. Rev. Biophys. Biomol. Struct. 34:351–378. [DOI] [PubMed] [Google Scholar]
- 9.Sako, Y., and A. Kusumi. 1994. Compartmentalized structure of the plasma membrane for receptor movements as revealed by a nanometer-level motion analysis. J. Cell Biol. 125:1251–1264. [DOI] [PMC free article] [PubMed] [Google Scholar]
- 10.Dietrich, C., B. Yang, T. Fujiwara, A. Kusumi, and K. Jacobson. 2002. Relationship of lipid rafts to transient confinement zones detected by single particle tracking. Biophys. J. 82:274–284. [DOI] [PMC free article] [PubMed] [Google Scholar]
- 11.Bacia, K., S. A. Kim, and P. Schwille. 2006. Fluorescence cross-correlation spectroscopy in living cells. Nat. Methods. 3:83–89. [DOI] [PubMed] [Google Scholar]
- 12.Levene, M. J., J. Korlach, S. W. Turner, M. Foquet, H. G. Craighead, and W. W. Webb. 2003. Zero-mode waveguides for single-molecule analysis at high concentrations. Science. 299:682–686. [DOI] [PubMed] [Google Scholar]
- 13.Edel, J. B., M. Wu, B. Baird, and H. G. Craighead. 2005. High spatial resolution observation of single-molecule dynamics in living cell membranes. Biophys. J. 88:L43–L45. [DOI] [PMC free article] [PubMed] [Google Scholar]
- 14.Wenger, J., H. Rigneault, J. Dintinger, D. Marguet, and P.-F. Lenne. 2006. Single-fluorophore diffusion in a lipid membrane over a subwavelength aperture. J. Biol. Phys. 32:SN1–SN4. [DOI] [PMC free article] [PubMed] [Google Scholar]
- 15.Wawrezinieck, L., H. Rigneault, D. Marguet, and P. F. Lenne. 2005. Fluorescence correlation spectroscopy diffusion laws to probe the submicron cell membrane organization. Biophys. J. 89:4029–4042. [DOI] [PMC free article] [PubMed] [Google Scholar]
- 16.Lenne, P. F., L. Wawrezinieck, F. Conchonaud, O. Wurtz, A. Boned, X.-J. Guo, H. Rigneault, H.-T. He, and D. Marguet. 2006. Dynamic molecular confinement in the plasma membrane by microdomains and the cytoskeleton meshwork. EMBO J. 25:3245–3256. [DOI] [PMC free article] [PubMed] [Google Scholar]
- 17.Xu, X., and E. London. 2000. The effect of sterol structure on membrane lipid domains reveals how cholesterol can induce lipid domain formation. Biochemistry. 39:843–849. [DOI] [PubMed] [Google Scholar]
- 18.Brown, D. A., and E. London. 1998. Functions of lipid rafts in biological membranes. Annu. Rev. Cell Dev. Biol. 14:111–136. [DOI] [PubMed] [Google Scholar]
- 19.Pike, L. J. 2006. Rafts defined: a report on the Keystone symposium on lipid rafts and cell function. J. Lipid Res. 47:1597–1598. [DOI] [PubMed] [Google Scholar]
- 20.Pralle, A., P. Keller, E. L. Florin, K. Simons, and J. K. Horber. 2000. Sphingolipid-cholesterol rafts diffuse as small entities in the plasma membrane of mammalian cells. J. Cell Biol. 148:997–1008. [DOI] [PMC free article] [PubMed] [Google Scholar]
- 21.Fujiwara, T., K. Ritchie, H. Murakoshi, K. Jacobson, and A. Kusumi. 2002. Phospholipids undergo hop diffusion in compartmentalized cell membrane. J. Cell Biol. 157:1071–1081. [DOI] [PMC free article] [PubMed] [Google Scholar]


