

Abstract
Pitch perception plays a critical role in identifying and segregating auditory objects1, especially in the context of music and speech. The perception of pitch is not unique to humans and has been experimentally demonstrated in several animal species2,3. Pitch is the subjective attribute of a sound’s fundamental frequency (f0), that is determined by both the temporal regularity and average repetition rate of its acoustic waveform. Spectrally dissimilar sounds can have the same pitch if they share a common f0. Even when the acoustic energy at f0 is removed (“missing fundamental”) the same pitch is still perceived1. Despite its importance for hearing, how pitch is represented in the cerebral cortex remains unknown. Here we show the existence of neurons in the auditory cortex of marmoset monkeys that respond to both pure tones and missing fundamental harmonic complex sounds (MFs) with the same f0, providing a neural correlate for pitch constancy1. These pitch-selective neurons are located in a restricted low-frequency cortical region near the anterolateral border of primary auditory cortex (AI), consistent with the location of a pitch-selective area identified in recent human imaging studies4,5.
Many natural sounds (or biologically significant sounds) have periodic acoustical waveforms. These sounds can be spectrally decomposed into a sinusoid at the frequency of periodicity (f0) and a series of sinusoids at frequencies that are integer multiples of f0 (harmonics). Although these spectral components are represented by the cochleotopic organization of the auditory system in a distributed fashion, they are perceptually grouped together into a single sound with a pitch equivalent to a pure tone at f01. In the auditory periphery, the f0 of complex sounds (such as MFs) is represented by a distributed neural code involving both the place and temporal firing patterns of auditory nerve fibers6,7. How this information is utilized to encode pitch within the central auditory system is poorly understood.
Pitch discrimination deficits have been observed in both animals8 and humans9,10 following auditory cortical lesions, indicating a cortical role in pitch perception. However, electrophysiological recordings in macaque monkeys suggest that primary auditory cortex does not contain a representation of pitch, as AI neurons do not respond to MFs with a pitch matching their characteristic frequency (CF)11,12. Alternatively, pitch may be processed in non-primary auditory cortex, as recent human imaging studies have revealed a cortical pitch processing region anterolateral to primary auditory cortex4,5. The organization of primary and secondary areas of auditory cortex is largely conserved across primate species13,14, and a similar “pitch center” may exist in nonhuman primate auditory cortex. To address this question, we searched for pitch-selective neurons in the auditory cortex of the common marmoset (Callithrix jacchus), a New World primate species sharing a similar hearing range with humans15. Using single-unit extracellular recordings, we found a restricted cortical region near the anterolateral low-frequency border of AI in the marmoset containing neurons that respond significantly to both pure tones and MFs with similar pitches.
In order for a neuron to be considered pitch-selective, we required that it satisfy the following criteria. First, the neuron had to respond significantly to both pure tones and MFs with a similar pitch. Second, all of the harmonics of the MF had to be outside the neuron’s excitatory frequency response area. An example of a neuron’s response to acoustic stimuli testing these criteria is shown in Fig.1 (see also Supplementary Fig.1). A total of 53 neurons from three marmosets met our criteria for pitch-selectivity. Fiftyone of these neurons were located within a low frequency restricted region near the anterolateral border of AI and neighbored by the low frequency regions of R (rostral field) and laterally situated non-primary areas (Fig.2a, Supplementary Fig.2a-c). These pitch-selective neurons accounted for 39% (51/131) of the neurons recorded in this region that responded to pure tones. Pitch-selective and non-pitch neurons in this area spanned a similar range of CFs (Fig.2b). Due to recording time constraints, we initially searched for MF responses using f0s near the neuron’s CF (determined by pure tone). In some pitch-selective neurons, we systematically varied an MF’s f0 in order to determine the neuron’s best fundamental frequency. Pitch-selective neurons were in general similarly tuned for their peak responses to pure tones and MFs (Fig.3b) and always overlapped in their frequency and fundamental frequency tuning for pure tone and MF responses, respectively (Fig.3a, Supplementary Fig.3a-b). We did not have any evidence from our experiments supporting the existence of neurons with MF and pure tone responses that failed to overlap along the frequency axis. An additional 50 neurons in this region were encountered that did not respond significantly to pure tones but did respond to narrowband or wideband stimuli such as harmonic complex tones, sinusoidally amplitude- or frequency-modulated tones (sAM, sFM), click trains, or bandpass noise. A subset of these neurons (n=10) only responded to harmonic complex and sAM tones with repetition rates similar in frequency to the CFs of neighboring neurons. These neurons may play a role in processing the pitch of complex sounds, however, they were not included in our analysis of pitch-selective neurons due to an insufficient sample size.
Figure 1.
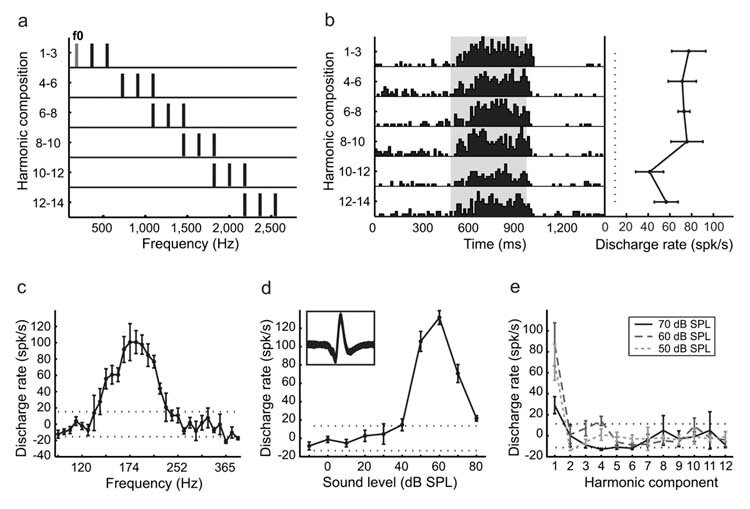
An example of a pitch-selective neuron (Unit M36n-532). Error bars represent standard error of the mean (SEM). The dotted black lines indicate the significance level for discharge rate (± 2 standard deviations away from the spontaneous discharge rate). a. Frequency spectra of a series of harmonic complex stimuli. The fundamental frequency component (f0) and its higher harmonics have an equal amplitude of 50 dB SPL. b. Peristimulus time histogram (left) and tuning curve (right) of the neuron’s response to the stimuli in a). c. Frequency tuning of the neuron derived from pure tones. d. Response of the neuron to a pure tone at CF (182 Hz) across sound levels (rate-level function). Inset plot shows an overlay of 2,434 digitized action potentials recorded from this neuron (displayed within a 2 ms window). e. The neuron’s responses to individual harmonics (number 1-12) at three sound levels, respectively. All the harmonics above the f0 component (1st harmonic) were outside the neuron’s excitatory frequency response area, and did not elicit significant responses.
Figure 2.
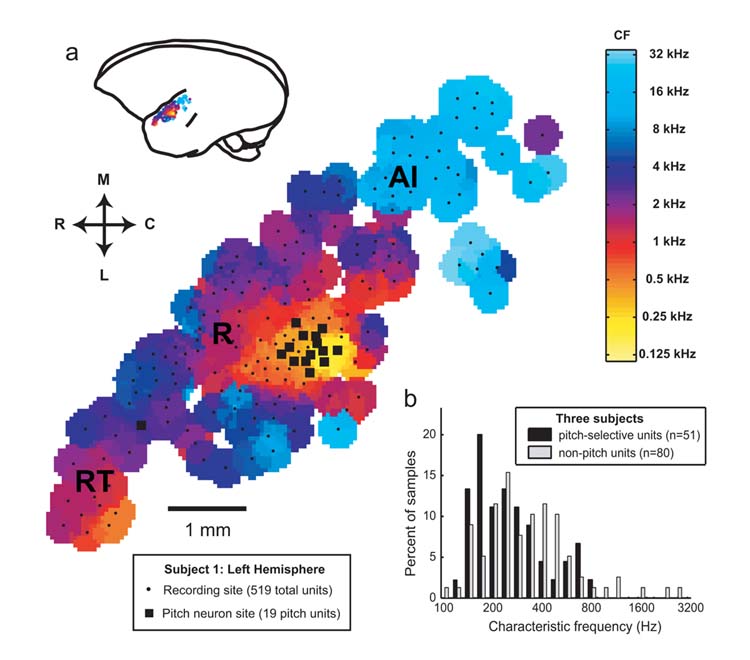
Location and characteristic frequency (CF) distribution of the pitch area in marmoset auditory cortex. a. CF topographical map from the left hemisphere of one marmoset (M2p). Pitch-selective neurons (black squares) were found clustered near the anterolateral border of AI. Frequency reversals indicate the borders between AI/R and R/RT (rostral temporal field). b. The CF distribution from pitch-selective and non-pitch neurons within the pitch area of three marmosets.
Figure 3.
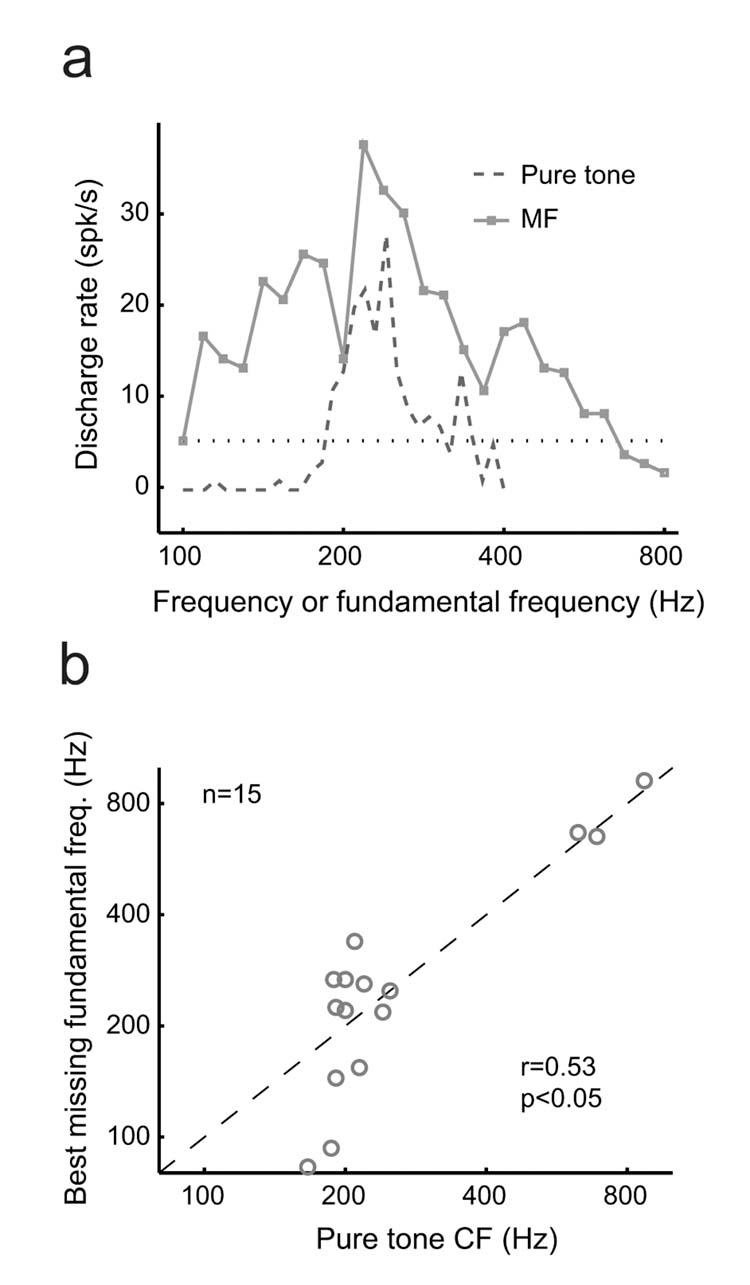
Pitch-selective neurons share a similar tuning for pure tones and MFs. a. An example of an individual pitch-selective neuron’s tuning to pure tone frequency and the fundamental frequency of MFs respectively. (Unit M2p-201) b. A comparison of the CF and best missing fundamental frequency responses from 15 pitch-selective neurons. The Spearman correlation coefficient (r) is displayed on the plot and is statistically significant (p<0.05).
Once we characterized neurons as pitch-selective, we further tested these cells with a variety of complex sounds whose pitch salience were parametrically varied. A click train has a pitch corresponding to its average repetition rate and a pitch salience determined by the regularity of the time intervals between successive clicks. When the timing of individual clicks is jittered to create an irregular click train, the pitch salience decreases with increasing irregularity16. We tested the effect of a click train’s temporal irregularity on neuronal responses in a subset of pitch-selective neurons and found an overall decrease in their discharge rates (Fig.4a, Supplementary Fig.4a-b). For another subset of pitch-selective neurons, we tested their sensitivity to pitch salience using iterated-ripple-noise stimuli (IRN), which were constructed by adding broadband noise iteratively to itself with a constant delay17. Because each iteration of this delay-and-add process increases the temporal regularity of the resulting sound, the pitch strength of the stimulus also increases. Overall, pitch-selective neurons increased their discharge rate as the strength of pitch in the IRN also increased (Fig.4b, Supplementary Fig.4c).
Figure 4.
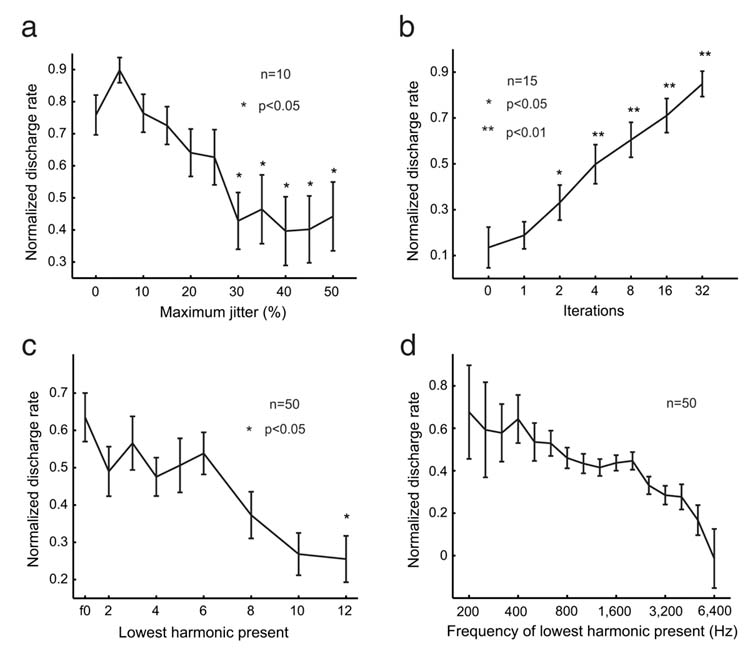
Pitch-selective neurons are sensitive to pitch salience. Error bars represent SEM. Statistical significance was determined using Wilcoxon rank sum test. Responses were normalized by the maximum response elicited within the stimulus set. a. Averaged population response of pitch-selective neurons to irregular click trains as a function of maximum jitter. The response to a regular click-train was used as a reference for statistical comparison at other jitter values. b. Averaged population response as a function of the iterations of IRN stimuli. The response to IRN stimuli with 0 iterations was used as a reference for statistical comparison at other iterations. c. Averaged population response as a function of the lowest harmonic presented in the MF stimuli. The reference for statistical comparsion was harmonic complex sounds with their fundamental frequency present. d. Averaged population response as a function of the frequency of the lowest harmonic presented in the MF stimuli.
Pitch salience is also dependent on the harmonic composition of an MF. Data from humans indicate that the salience of pitch is greater in MFs composed of lower order harmonics rather than those composed of higher order harmonics1. It is the 3rd to 5th harmonics of a harmonic complex tone that contribute most to its pitch1. However, it is unknown if this is also the case in marmosets. We observed that pitch-selective neurons usually responded most strongly to harmonic complex sounds containing lower order harmonics (1st to 6th) (Fig.4c).
Several important distinctions must be made between this study and previous reports of a neural representation of periodicity in the auditory cortex of the gerbil18,19. In the present study the pitch-selective neurons had CFs mostly below 800 Hz (Fig.2b), and given the correspondence between CF and preferred missing fundamental frequency (Fig.3b), this matches closely the human perceptual limit of missing fundamental pitch20. Responses at higher best modulation frequencies (2-3 kHz) were observed in previous studies investigating periodicity encoding in gerbil auditory cortex18,19. Another difference between these studies was the frequency range of harmonics to which neurons responded. In our study, only MFs containing harmonics below ∼5 kHz evoked significant responses in the majority of pitch-selective neurons (Fig.4d). This matches the upper frequency limit of an MF’s harmonics for its pitch to be perceivable by humans1. In contrast, the carrier frequencies of sAM tones used in previous studies investigating periodicity responses in gerbil auditory cortex18,19 were above 5 kHz. Finally, a crucial distinction between the present study and previous work was the sound level at which MF and sAM acoustic stimuli were delivered, respectively. When the ear is stimulated with two tones (f1 and f2), combination tones (2f1-f2, f2-f1, etc.) are generated by the nonlinear mechanics of the cochlea1. Psychophysical studies show that missing MFs with two components generate combination tones at the f0 that are 20-25 dB lower than the sound level of individual components21. The magnitude of this combination tone increases by 3 dB for every doubling of the number of components. Physiological studies in the inferior colliculus of guinea pigs22 suggest that combination tones at the f0 can be produced in the range of 17-34 dB below the sound level of the carrier of an amplitude-modulated tone. To avoid the confound of combination tones, we strictly limited the sound level of the individual components of MFs used in our experiments to be no more than 10 dB above the neuron’s tone response threshold at its CF. More than 75% of the pitch-selective neurons (40/53) responded significantly to an MF when the individual components were set at the neuron’s pure tone sound level threshold at its CF (Fig.5a), a situation where combinations tones at the neuron’s CF would be at least 20 dB below its response threshold as estimated by previous studies21,22. As such, the procedures implemented in the present study ensured that the MF responses reported here were not the result of combination tones. Previous studies18,19 employed sAM tones delivered at 30 dB or more above a neuron’s sound level threshold, making the interpretation of the reported periodicity representation difficult.
Figure 5.
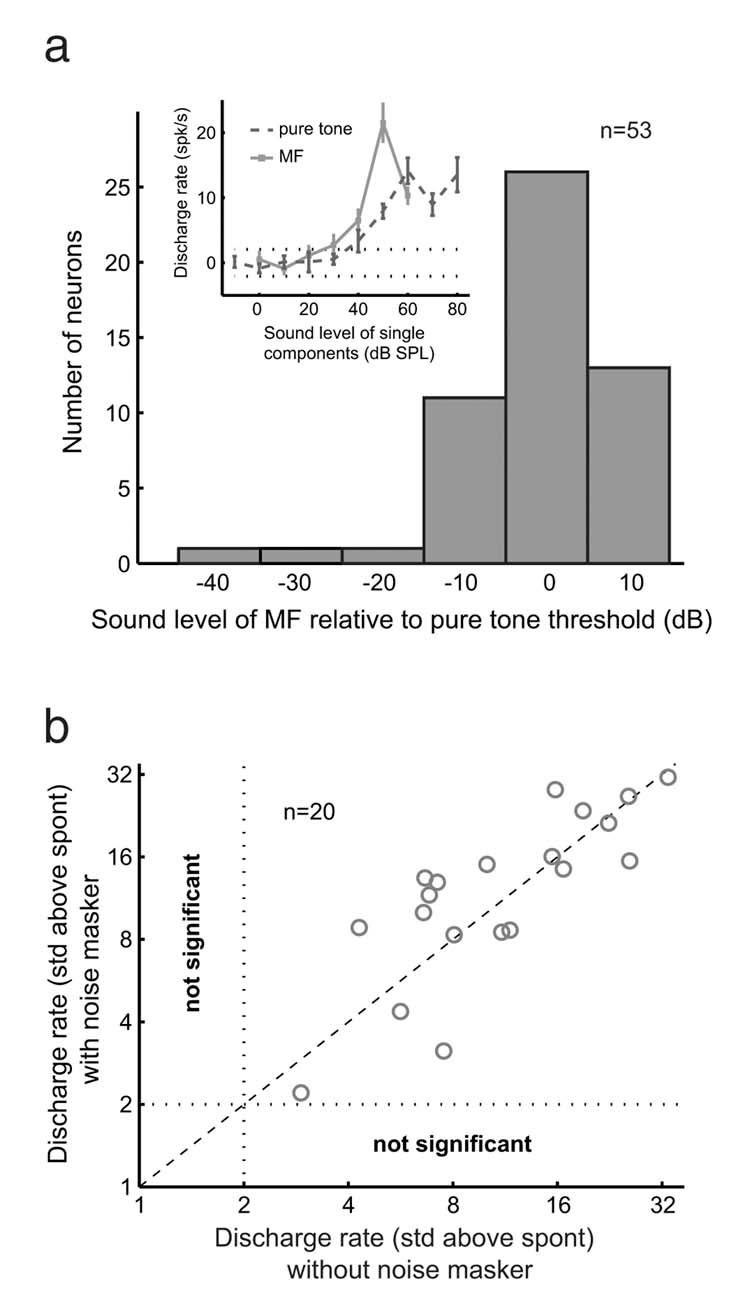
MF responses are not caused by combination tones. a. Distribution of sound level threshold for individual components of the MF response relative to the sound level threshold for a pure tone response at the neuron’s CF. Inset plot shows rate-level functions from a pitch-selective neuron (Unit M41o-294) for pure tones and MFs. The two dotted lines indicate two standard deviations from the spontaneous discharge rate. Error bars represent SEM. b. Scatter plot comparing responses to MFs with and without the presence of a noise masker for 20 pitch-selective neurons. All the neurons tested had significant discharge rates for both conditions. The two dotted lines parallel to the axes indicate two standard deviations from the spontaneous discharge rate. The diagonal line has a slope of 1.
Combination tones can be perceptually masked by spectrally overlapping bandpass noise1. We compared responses to MFs with and without a noise masker for a subset of pitch-selective neurons (n=20). The masker was generated using 1-2 octave bandpass noise centered at the f0 of the MF and at a sound level –10 to +10 dB relative to the levels of individual components of the MF. None of the pitch-selective neurons studied failed to respond significantly in the presence of the noise masker (Fig.5b). The roughly 50/50 split of neurons whose discharge rates increased or decreased in the presence of the noise masker may be due to the proximity of this cortical pitch area to both core and belt regions of auditory cortex that respectively show preferences for tonal or noisy sounds23. Less than half of the neurons from Fig.5b that were tested responded significantly to the noise masker when it was played alone (Supplementary Fig.5a-b).
Magnetoencephalography studies in humans suggest both a parallel24 and orthogonal25 topographical organization of pitch relative to the cochleotopic map in AI. In addition, a recent optical imaging study in gerbils19 has suggested a horseshoe-shaped topographical map for periodicity that is superimposed on a linear cochleotopic map. Due to the small size of the cortical area containing pitch-selective neurons (∼1 mm2) (Fig.2a, Supplementary Fig.2a-b), we could not determine any topographical arrangement of best pitch encoded by these neurons. Pitch-selective and non-pitch neurons within this region had CFs spanning the same frequency range (Fig.2b). However, given that non-pitch neurons encoding low frequencies are present in the same region of auditory cortex, these data support a parallel topographical representation of pitch and frequency. The two CF distributions were significantly different (p=0.0251 Wilcoxon rank-sum test) with pitch-selective neurons biased towards lower frequency CFs, however bandwidth and peak latency were not significantly different between these two groups of neurons. While the range of CFs encountered from pitch-selective neurons fell below the f0 of most marmoset vocalizations (4-8 kHz), marmosets produce several call types (e.g. egg call, f0∼800 Hz) that have f0s near the upper range of the CFs of pitch-selective neurons26. It is important to note that marmosets hear sounds containing harmonic structure from other animals and the environment in their natural habitat.
The cortical region containing pitch-selective neurons appears to be on the border of core areas AI and R and lateral belt areas AL (anterolateral) and ML (middle lateral) without spanning the entire tonotopic representation of any one of these four areas. This may be a frequency-specific and functionally specialized area of auditory cortex in primates, analogous to areas of mustached bat (Pteronotus parnellii) auditory cortex that contain combination-sensitive neurons27.
Lower order harmonics of a complex tone are resolved by the auditory system, and the estimates of the frequencies of these components can be used to determine the pitch28. However, when the harmonics of a complex tone are not resolved by the auditory system, only the temporal information (repetition rate) of the acoustic waveform can be used to determine the pitch29. How marmosets perceive these MFs and, more specifically, to what extent they use spectral and temporal pitch mechanisms remains to be studied in future behavioral and physiological experiments. Given that the size of the cochlea is smaller in marmosets than in humans, it is likely that some of the lower order harmonics resolved in the human are unresolved in the marmoset. As such, the MF responses that we observed were most likely evoked by both resolved and unresolved harmonics. Spectral and temporal processing strategies may ultimately be unified in auditory cortex, providing a single central neural correlate for the perception of pitch.
Methods
Details of experimental procedures can be found in recent publications from our laboratory30. Single-unit recordings were conducted in awake marmosets (subjects 1-3:M2p (left hemisphere), M36n (right hemisphere), M41o (left hemisphere)) sitting quietly in a semi-restraint device with their head immobilized, within a double-walled soundproof chamber (Industrial Acoustics Co., Inc., Bronx, NY) whose interior is covered by 3” acoustic absorption foam (Sonex, Illbruck, Inc.). Because the auditory cortex of the marmoset lies largely on the lateral surface of the temporal lobe, high impedance tungsten microelectrodes (3-5 MΩ) could be inserted perpendicular to the cortical surface. Electrodes were mounted on a micromanipulator (Narishige) and advanced by a manual hydraulic microdrive (Trent Wells Inc.). Action potentials were detected on-line using a template based spike sorter (MSD, Alpha Omega Engineering) and continuously monitored by the experimenter while data recording progressed. Typically 5-15 electrode penetrations were made within a miniature recording hole (diameter ∼ 1mm), after which the hole was sealed with dental cement and another hole was opened for new electrode penetrations. Neurons were recorded from all cortical layers, but most commonly from supragranular layers.
Generation of acoustic stimuli:
Acoustic stimuli were generated digitally and delivered by a free-field loudspeaker located one meter directly in front of the animal. All sound stimuli were generated at a 100 kHz sampling rate and low-pass filtered at 50 kHz. Harmonic aritifacts were at least 43 dB lower than the fundamental at 80 dB SPL. The difference grew as the sound level of the fundamental decreased. The sound level of individual frequency components used in this study was no higher than 80 dB SPL.
Frequency tuning curves and rate-level functions were generated using 200 ms long pure tone stimuli with >500 ms interstimulus intervals and had a minimum of 5 repetitions. MF, IRN, and click-train stimuli were 500 ms long with intertrial intervals at least 1 second long and had a minimum of 10 repetitions. All stimuli were presented in a randomly shuffled order. Pure tone stimuli intensity levels were generally 10-20 dB above threshold for neurons with monotonic rate-level functions or at preferred levels for non-monotonic neurons. Harmonic complex tones were composed of 3 or 9 components in either cosine or Schroeder negative phase. The individual components of all harmonic complex tone stimuli were presented at no more than 10 dB above the neuron’s sound level threshold at its CF. Components of the MF were considered outside the neuron’s excitatory frequency response area if each component, when played individually at 0,+10, and +20 dB relative to its sound level within the harmonic complex, did not evoke a significant response.
Noise maskers were typically 1-2 octave bandpass noise centered at the missing fundamental frequency (near the unit’s CF). The sound level of the noise masker ranged from +10 to –10 dB relative to the individual harmonics. Noise maskers were played simultaneously with MFs.
Regular click trains had inter-click intervals (ICI) equal to 1/f0 where f0 was the preferred fundamental frequency of the neuron. Rectangular clicks (broadband) or narrowband clicks made of brief pulses of white noise or a tone (at an integer multiple of the f0) were used to generate click trains. Rectangular click trains had a width of 0.1 ms while narrowband-clicks30 had each pulse windowed by a gaussian envelope with a sigma of 0.1-0.4. An irregular click train was constructed by shifting each click of a regular click train relative to a previous click by an amount of time proportional to the ISI and randomly selected from a uniform distribution Sx=[-J,J], where J equals the maximum possible jitter. The maximum jitter in the irregular click train stimulus set was varied between 5 to 50%.
Generation of cortical CF maps:
Single units with significant neuronal discharges to tones, bandpass noise, or other narrowband stimuli (sAM, sFM, etc.) were used to generate cortical CF maps. The CF of each location on the map is determined by the median CF of all electrode tracks within 0.25 mm. Electrode track CFs were calculated by computing the median CF of units within the track.
Data Analysis:
The mean spontaneous discharge rate was subtracted during the calculation of a neuron’s mean driven discharge rate over the entire duration of the stimulus. Mean driven discharge rates greater than 2 standard deviations above the spontaneous discharge rate were considered significant. The peak MF response from every pitch-selective neuron was also determined to be significant (p<0.05) using a Wilcoxon rank sum test.
Supplementary Material
Acknowledgements:
Support contributed by NIH grants DC 03180 (X.W.), F31 DC 006528 (D.B.). We thank B. Delgutte, D. McAlpine, E. Young, B. Moore, and members of the Laboratory of Auditory Neurophysiology for their valuable comments and suggestions related to this manuscript and A. Pistorio, E. Bartlett, and E. Issa for assistance with animal care. E. Issa contributed data to CF maps. D.B. and X.W. designed the experiment and co-wrote the paper. D.B. carried out the electrophysiological recordings and data analysis.
Footnotes
Supplementary Information accompanies the paper on www.nature.com/nature.
Competing interests statement The authors declare that they have no competing financial interests.
References
- 1.Moore BCJ. An introduction to the psychology of hearing. Academic Press; London: 2003. [Google Scholar]
- 2.Tomlinson RW, Schwarz DW. Perception of the missing fundamental in nonhuman primates. J Acoust Soc Am. 1988;84:560–5. doi: 10.1121/1.396833. [DOI] [PubMed] [Google Scholar]
- 3.Heffner H, Whitfield IC. Perception of the missing fundamental by cats. J Acoust Soc Am. 1976;59:915–9. doi: 10.1121/1.380951. [DOI] [PubMed] [Google Scholar]
- 4.Patterson RD, Uppenkamp S, Johnsrude IS, Griffiths TD. The processing of temporal pitch and melody information in auditory cortex. Neuron. 2002;36:767–76. doi: 10.1016/s0896-6273(02)01060-7. [DOI] [PubMed] [Google Scholar]
- 5.Penagos H, Melcher JR, Oxenham AJ. A neural representation of pitch salience in nonprimary human auditory cortex revealed with functional magnetic resonance imaging. J Neurosci. 2004;24:6810–5. doi: 10.1523/JNEUROSCI.0383-04.2004. [DOI] [PMC free article] [PubMed] [Google Scholar]
- 6.Cariani PA, Delgutte B. Neural correlates of the pitch of complex tones. I. Pitch and pitch salience. J Neurophysiol. 1996;76:1698–716. doi: 10.1152/jn.1996.76.3.1698. [DOI] [PubMed] [Google Scholar]
- 7.Cedolin L, Delgutte B.Pitch of Complex Tones: Rate-Place and Interspike-Interval Representation in the Auditory Nerve J Neurophysiol 2005. doi:10.1152 [DOI] [PMC free article] [PubMed] [Google Scholar]
- 8.Whitfield IC. Auditory cortex and the pitch of complex tones. J Acoust Soc Am. 1980;67:644–7. doi: 10.1121/1.383889. [DOI] [PubMed] [Google Scholar]
- 9.Zatorre RJ. Pitch perception of complex tones and human temporal-lobe function. J. Acoust. Soc. Am. 1988;84:566–72. doi: 10.1121/1.396834. [DOI] [PubMed] [Google Scholar]
- 10.Warrier CM, Zatorre RJ. Right temporal cortex is critical for utilization of melodic contextual cues in a pitch constancy task. Brain. 2004;127:1616–25. doi: 10.1093/brain/awh183. [DOI] [PubMed] [Google Scholar]
- 11.Schwarz DW, Tomlinson RW. Spectral response patterns of auditory cortex neurons to harmonic complex tones in alert monkey (Macaca mulatta) J Neurophysiol. 1990;64:282–98. doi: 10.1152/jn.1990.64.1.282. [DOI] [PubMed] [Google Scholar]
- 12.Fishman YI, Reser DH, Arezzo JC, Steinschneider M. Pitch vs. spectral encoding of harmonic complex tones in primary auditory cortex of the awake monkey. Brain Res. 1998;786:18–30. doi: 10.1016/s0006-8993(97)01423-6. [DOI] [PubMed] [Google Scholar]
- 13.Morel A, Kaas JH. Subdivisions and connections of auditory cortex in owl monkeys. J Comp Neurol. 1992;318:27–63. doi: 10.1002/cne.903180104. [DOI] [PubMed] [Google Scholar]
- 14.Morel A, Garraghty PE, Kaas JH. Tonotopic organization, architectonic fields, and connections of auditory cortex in macaque monkeys. J Comp Neurol. 1993;335:437–59. doi: 10.1002/cne.903350312. [DOI] [PubMed] [Google Scholar]
- 15.Fay RR. Hearing in Vertebrates: a Psychophysics Databook. Hill-Fay Associates; Winnetka: 1988. [Google Scholar]
- 16.Pollack I. Detection and relative discrimination of auditory "jitter". J. Acoust. Soc. Am. 1968;43:308–315. doi: 10.1121/1.1910780. [DOI] [PubMed] [Google Scholar]
- 17.Yost WA, Patterson R, Sheft S. The role of the envelope in processing iterated rippled noise. J Acoust Soc Am. 1998;104:2349–61. doi: 10.1121/1.423746. [DOI] [PubMed] [Google Scholar]
- 18.Schulze H, Langner G. Periodicity coding in the primary auditory cortex of the Mongolian gerbil (Meriones unguiculatus): two different coding strategies for pitch and rhythm? J Comp Physiol [A] 1997;181:651–63. doi: 10.1007/s003590050147. [DOI] [PubMed] [Google Scholar]
- 19.Schulze H, Hess A, Ohl FW, Scheich H. Superposition of horseshoe-like periodicity and linear tonotopic maps in auditory cortex of the Mongolian gerbil. Eur J Neurosci. 2002;15:1077–84. doi: 10.1046/j.1460-9568.2002.01935.x. [DOI] [PubMed] [Google Scholar]
- 20.Ritsma RJ. Existence region of the tonal residue. I. J Acoust Soc Am. 1962;34:1224–29. [Google Scholar]
- 21.Pressnitzer D, Patterson RD. Distortion products and the perceived pitch of harmonic complex tones. In: Breebart DJ, Houtsma AJM, Kohlrausch A, Prijs VF, Schoonoven R, editors. Physiological and Psychophysical Bases of Auditory Function. Shaker Publishing BV, Maastricht; The Netherlands: 2001. pp. 97–104. [Google Scholar]
- 22.McAlpine D. Neural sensitivity to periodicity in the inferior colliculus: evidence for the role of cochlear distortions. J Neurophysiol. 2004;92:1295–311. doi: 10.1152/jn.00034.2004. [DOI] [PubMed] [Google Scholar]
- 23.Rauschecker JP, Tian B. Processing of band-passed noise in the lateral auditory belt cortex of the rhesus monkey. J. Neurophysiol. 2004;91:2578–89. doi: 10.1152/jn.00834.2003. [DOI] [PubMed] [Google Scholar]
- 24.Pantev C, Hoke M, Lutkenhoner B, Lehnertz K. Tonotopic organization of the auditory cortex: pitch versus frequency representation. Science. 1989;246:486–8. doi: 10.1126/science.2814476. [DOI] [PubMed] [Google Scholar]
- 25.Langner G, Sams M, Heil P, Schulze H. Frequency and periodicity are represented in orthogonal maps in the human auditory cortex: evidence from magnetoencephalography. J Comp Physiol [A] 1997;181:665–76. doi: 10.1007/s003590050148. [DOI] [PubMed] [Google Scholar]
- 26.Epple G. Folia Primatol. 1968;8:140. doi: 10.1159/000155129. [DOI] [PubMed] [Google Scholar]
- 27.Suga N. Processing of auditory information carried by species-specific complex sounds. In: Gazzanica MS, editor. The Cognitive Neurosciences. MIT Press; Cambridge, Mass: 1994. pp. 295–313. [Google Scholar]
- 28.Goldstein JL. An optimum processor theory for the central formation of the pitch of complex tones. J. Acoust. Soc. Am. 1973;54:1496–1516. doi: 10.1121/1.1914448. [DOI] [PubMed] [Google Scholar]
- 29.Schouten JF. The residue and the mechanism of hearing. Proc. K. Ned. Akad. Wet. 1940;43:991–999. [Google Scholar]
- 30.Lu T, Liang L, Wang X. Temporal and rate representations of time-varying signals in the auditory cortex of awake primates. Nat Neurosci. 2001;4:1131–8. doi: 10.1038/nn737. [DOI] [PubMed] [Google Scholar]
Associated Data
This section collects any data citations, data availability statements, or supplementary materials included in this article.