

Abstract
Signaling through G-protein coupled receptors is modulated by a family of regulator of G protein signaling (RGS) proteins that have been implicated in several neurological and psychiatric disorders. Defining the detailed expression patterns and developmental regulation of RGS proteins has been hampered by an absence of antibodies useful for mapping. We have utilized bacterial artificial chromosome (BAC) methods to create transgenic mice that express GFP under the control of endogenous RGS4 enhancer elements. This report focuses on expression patterns in the developing and mature cerebral cortex. Based on reporter distribution, RGS4 is expressed by birth in neurons across all cortical domains, but in different patterns that suggest region- and layer-specific regulation. Peak expression typically occurs before puberty, with complex down-regulation by adulthood. Deep and superficial neurons, in particular, vary in their patterns across developmental age and region and, in primary sensory cortices, layer IV neurons exhibit low or no expression of the GFP reporter. These data suggest that altering RGS4 function will produce a complex neuronal phenotype with cell- and subdomain-specificity in the cerebral cortex.
Keywords: GFP, expression, development, G-protein, schizophrenia
Abbreviations: BAC, bacterial artificial chromosome; BSA, bovine serum albumin; cRNA, complementary ribonucleic acid; DAB, diaminobenzidine tetrahydrochloride; DNA, deoxyribonucleic acid; FLPe, FLP recombinase; GAP, GTPase activating protein; GENSAT, Gene expression nervous system atlas; GFP, green fluorescent protein; GPCR, G-protein coupled receptor; IRES2, internal ribosomal entry sequence version 2; M1, primary motor cortex; M2, secondary motor cortex; mRNA, messenger ribonucleic acid; PBS, phosphate buffered saline; PCR, polymerase chain reaction; RGS, regulator of G-protein signaling; RGS4, regulator of G-protein signaling 4; S1, primary somatosensory cortex; S2, secondary somatosensory cortex; UTR, untranslated region; V1, primary visual cortex; V2, secondary visual cortex
Transmembrane receptor-mediated signaling systems are the basis of much of the extracellular signaling that occurs within brain circuits. In particular, G protein coupled receptors (GPCRs) are a critical link in signal transduction pathways that utilize neuromodulators such as the biogenic amines, acetylcholine and opioids. GPCRs generally act to modulate a signal arriving via ionotropic pathways through either hyperpolarization of the pre- or post-synaptic membranes, influx of calcium, or by formation of chemical second messengers within the cell. An integral part of Gi/Go/Gq-coupled signaling complexes are the regulator of G protein signaling (RGS) proteins. RGS proteins were initially discovered based on their ability to regulate G protein signaling (Druey et al., 1996, Koelle and Horvitz, 1996). It was quickly realized that this regulation resulted from their activity as GTPase activating proteins (GAPs) for activated heterotrimeric G proteins (Berman et al., 1996). Accordingly, alteration of the expression or function of these proteins might be expected to have a significant effect on neuronal function. Currently, 30 RGS domain-containing proteins have been identified (Hollinger and Hepler, 2002), which is much less than the approximately 400 GPCRs that are expressed in the brain (Vassilatis et al., 2003). This indicates that each specific RGS protein likely regulates the function of multiple species of GPCRs. Whether RGS proteins exhibit absolute specificity in vivo is unclear. In vitro, however, it has been shown that some RGS proteins have a clear preference for particular receptor-G protein complexes (Xu et al., 1999), suggesting that a limited number of RGS proteins may act to modulate signaling from a particular receptor.
RGS proteins have been implicated in normal behavioral processes and in brain disorders. RGS4 expression changes in response to acute stress in a complex fashion, depending upon the brain region analyzed (Ni et al., 1999). In relation to human disease, we reported that, in subjects with schizophrenia, there is reduced expression of the mRNA encoding RGS4 in the dorsolateral prefrontal cortex, relative to normal controls (Mirnics et al., 2001). Subsequent studies by our and other laboratories have demonstrated association of non-coding single nucleotide polymorphism variants of RGS4 in individuals with schizophrenia (Chowdari et al., 2002, Chen et al., 2004, Morris et al., 2004, Williams et al., 2004b, Prasad et al., 2005). Whereas the data from human studies suggest that dysregulation of RGS4 expression may be an underlying risk factor for schizophrenia, a basic understanding of how this or any other RGS protein is regulated differentially in the brain is lacking. Previous studies have demonstrated expression of RGS4 in the adult mouse and rat using in situ hybridization or western blot (Gold et al., 1997, Nomoto et al., 1997, Ingi and Aoki, 2002, Grillet et al., 2003). These studies, however, lack the developmental and cellular resolution necessary to identify the neuronal populations and subtypes that express RGS4, particularly in relation to specific signaling systems and functional circuits. As currently available anti-RGS4 antibodies do not demonstrate specificity in immunocytochemical assays (SJ Gold, Department of Psychiatry, University of Texas Southwestern Medical Center at Dallas, personal communication, and PJ Ebert, unpublished observations), we have used bacterial artificial chromosome (BAC) technology (Heintz, 2001) to generate transgenic mice that contain an IRES2-GFP inserted into the 3′ untranslated region (UTR) of the RGS4 gene. The resulting expression of GFP provides a sensitive reporter of normal RGS4 expression patterns by filling the entire extent of the cellular architecture, including neuronal dendrites and axons. We have analyzed RGS4-GFP expression in these mice in both cortical and subcortical domains throughout the postnatal period, and have identified dynamic spatial and temporal expression patterns. The current paper focuses on RGS4-GFP expression in the cerebral cortex. An accompanying paper (Ebert et al, co-submitted) provides a detailed analysis of RGS4-GFP expression in subcortical brain structures.
Experimental procedures
Generation of RGS4 transgenic lines
C57Bl/6J-derived bacterial artificial chromosomes (BAC) containing the RGS4 locus were identified via the Celera discovery system (Applera Corporation, Rockville, MD), obtained from the BACPAC Resources Center, and extensively mapped by restriction digest and subsequent field inversion gel electrophoresis. BAC # RPCI-23-82i24 was chosen for transgenic production due to its size (~225 kb) and the relatively central position of the RGS4 gene within the BAC. BAC DNA was isolated via miniprep and transformed into EL250 cells (kind gift of Dr. Neal Copeland, NCI, Frederick, MD) via electroporation. EL250 cells contain heat-shock inducible recombination genes and an arabinose inducible FLP-recombinase (Lee et al., 2001). An IRES2-GFP recombination construct was generated by flanking an IRES2-eGFP expression construct (BD Biosciences Clontech, Palo Alto, CA) and floxed kanamycin resistance cassette (derived from pICGN-21, kind gift of Dr. Neal Copeland) with 2, approximately 200 bp adjacent regions from the RGS4 3′ UTR. Homologous recombination of the IRES2-GFP recombination construct into the BAC was performed as previously described (Lee et al., 2001). Briefly, overnight cultures containing the BAC were grown, subcultured by diluting 0.5 ml of the culture into 25 ml of LB medium, and grown to an OD600 of 0.6. Ten ml of the culture was then induced by shifting the cells to 42°C for 15 min followed by chilling on ice for 20 min. Ten ml of induced and uninduced cells were centrifuged for 5 min at 3000g at 4°C and washed with 1.5 ml of ice-cold sterile water three times. Water was removed to a volume of 100 μl (including cells), cells were resuspended and mixed with approximately 300 ng of targeting vector and electroporated in cuvettes (0.1cm) using a Bio-Rad Gene Pulser (Biorad, Hercules, CA) set at 1.75 kV, 25 μF with a pulse controller set at 200 ohms. One ml of LB medium was added after electroporation. Cells were incubated at 32°C for 1.5 h with shaking and spread on selective media containing 12.5 μg/ml chloramphenicol and 25 μg/ml kanamycin. Following confirmation of correct integration via PCR and restriction mapping, the kanamycin resistance cassette was excised by diluting overnight cultures 1:50 in LB medium and growing them until the OD600 = 0.5. FLPe expression was induced by incubating the cultures with 0.1% L-arabinose for 1 h. The bacterial cells were subsequently diluted 10-fold in LB medium, grown for an additional hour, and spread on chloramphenicol plates (12.5 μg/ml). Individual colonies were selected, analyzed by PCR, extensively restriction mapped and sequenced across the integration regions (Fig 1). BAC DNA was amplified and purified by anion-exchange (ACGT Inc, Wheeling, IL). Supercoiled DNA was injected at approximately 1 ng/μl in injection buffer (30 mM Tris-HCl, pH 7.5, 0.1 mM EDTA, 100 mM NaCl) into C57Bl/6J X DBA F1 embryos by the Vanderbilt Transgenic Mouse/Embryonic Stem Cell Shared Resource. Founder animals were genotyped by PCR using primers 5′CTGACCCTGAAGTTCATCTGCACC3′ and 5′TGGCTGTTGTAGTTGTACTCCAGC3′ (Nakada et al., 2004). Five separate founder lines were identified, four of which expressed GFP.
Figure 1.

Generation of RGS4-BAC transgenic construct. A targeting construct containing a FRT-flanked neomycin resistance cassette, GFP proceeded by an internal ribosomal entry site and homology regions of the RGS4 3′ UTR was introduced (via homologous recombination) into a bacterial artificial chromosome (BAC) containing a centrally-located RGS4. The neomycin cassette was subsequently removed by FLP-mediated recombination.
Neuroanatomical Mapping
All animal experiments were approved by the Vanderbilt University Institutional Animal Care and Use Committee and were conducted following the Guide for the Care and Use of Laboratory Animals (National Institutes of Health Publications No. 80–23, revised 1996). All efforts were made to reduce animal suffering and minimize the total number of animals used. Animals utilized for immunocytochemical analyses were perfused with 4% paraformaldehyde in phosphate buffer, followed by dissection of the brain and immersion fixation overnight. Following equilibration in 30% sucrose/PBS, brains were sectioned on a freezing microtome, and sections stored in freezing medium (45% PBS, 30% ethylene glycol, 25% glycerol) at −20°C. Endogenous GFP is visible in unfixed whole brain and tissue sections, but fades following fixation. Thus, GFP was visualized by incubation with anti-GFP antibody (Molecular Probes, Eugene, OR Cat # 11122) at 1:1000 dilution in 2% BSA/0.2% Tween-20/PBS, followed by biotinylated donkey anti-rabbit IgG (1:1000; Jackson Immunoresearch, West Grove, PA) and HRP amplification of DAB staining using the Elite ABC staining kit (Vector labs, Burlingame, CA). GFP immunohistochemistry with non-transgenic littermates revealed no staining at any age examined. All lines were analyzed for expression at postnatal day (P)0, P7, P21 and P60 (at least 3 animals at each age), with virtually identical patterns of RGS4-GFP expression noted (except for intensity of GFP) across lines. (P0 was defined as the day of birth.) This paper reports the detailed mapping of RGS4-GFP in one line (R4BAC3). We operationally defined rostral, mid-rostral, middle and caudal levels of the cerebral cortex for ease of organizing the expression patterns across multiple ages and cytoarchitectonic areas.
In Situ Hybridization
To verify that the distribution of GFP in the transgenic animals matched known patterns of RGS4 transcript expression in the adult, wild type and transgenic animals were prepared for in situ hybridization. Brains were extracted from anesthetized mice, fresh frozen in isopentane and sectioned at 20–25 μm. RGS4 in situ hybridization was completed as previously described (Campbell and Levitt, 2003) using a 911 bp, radiolabeled cRNA probe, corresponding to nucleotides 1298-2208 of the mouse RGS4 gene (GenBank accession number NM 009062.2).
Image Collection
Images were collected using a Zeiss Axioplan 2 with 1.25 X, 5X, 10X and 40X objectives and DIC filters (Zeiss, Jena, Germany). Images were acquired with a Zeiss AxioCam HRc camera in Axiovision 4.1 software (Zeiss), with minor contrast and brightness adjustments. Images were assembled with Adobe Photoshop 7.0. Delineation of anatomical regions was based on Paxinos and Franklin (Paxinos and Franklin, 2001).
RESULTS
Comparison of patterns of GFP immunolabeling in adult brains across all four RGS4 BAC transgenic lines revealed virtually identical spatio-temporal patterns of expression, indicating that the patterns of expression observed were not due to features of the sites of insertion into the host mouse genome. Analysis of RGS4 in situ hybridization showed that the pattern of expression of the RGS4 transcript was the same in wild type and RGS4-GFP transgenic animals (compare Fig 2, left and center columns). However, diffusion of the cytoplasm-localized GFP throughout the neuropil of RGS4-expressing cells results in a broader region of GFP-immunolabeling (Fig 2, right column) than the RGS4 transcript labeling of somata revealed by in situ hybridization (Fig 2, center column). Thus, while the cellular resolution of the RGS4-GFP immunostaining of cell bodies and processes is far more detailed than can be obtained from riboprobe localization (which has allowed us to investigate cellular morphology in these studies and could potentially be utilized in single-cell marker analysis in future studies), the subcellular localization of GFP cannot be assumed to be identical to that of RGS4.
Figure 2.
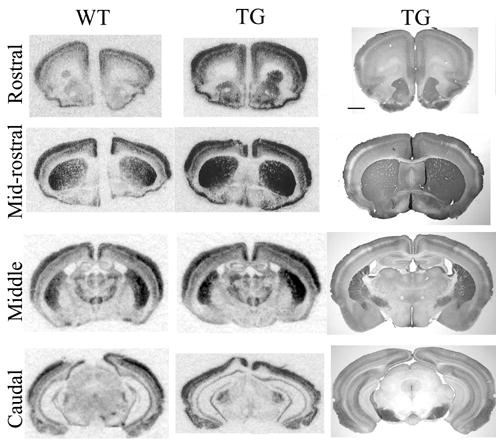
Expression of RGS4 and RGS4-GFP in transgenic mice. In situ hybridization with a RGS4-specific riboprobe in wild-type (left) and RGS4-GFP P60 transgenic mice (center) demonstrates that the transgene faithfully reproduces endogenous RGS4 expression. Immunohistochemistry with an anti-GFP antibody further confirms the overall specificity of the GFP reporter in P60 transgenic mice (right). This is most evident in the caudate putamen (CP) and in the bilaminar appearance of staining in the cerebral cortex (CC), in which the absence of cRNA labeling and anti-GFP staining in layer IV is evident across sections. The immunostaining also demonstrates extensive neuropil labeling in the septum (SEP), which is derived from RGS4-GFP+ cells. Scale bar in C is 1mm; images in A and B are unscaled, but are of same age as in C.
In all cortical regions, and at all ages examined, gray matter exhibited more intense labeling compared to white matter. Axonal, but not cell somata, labeling is evident in subcortical white matter (Fig 3A). This indicates that glial cells do not express RGS4, which is consistent with the lack of white matter labeling in our in situ hybridization material. In the gray matter, RGS4-GFP staining, which is particularly dense at P7, facilitated the visualization of apical dendrites and neuropil (Fig 3B). A summary figure displaying low-magnification representative images from all levels and ages examined follows the high-resolution images (Fig 11).
Figure 3.
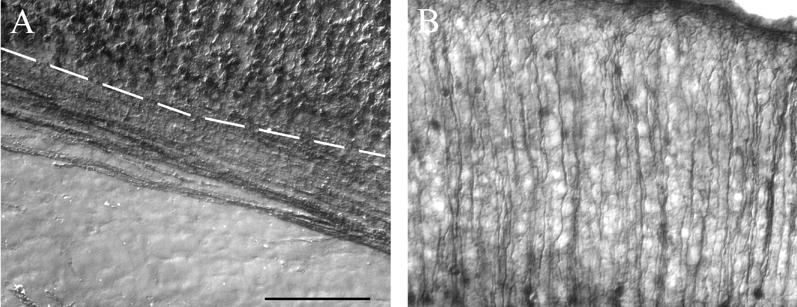
RGS4-GFP labels cell bodies in gray, but not white, matter. A) Image of the corpus callosum of a P0 RGS4-GFP transgenic mouse, with the dashed line indicating the boundary between the white and gray matter. In the white matter, axons but not glial cell bodies are labeled. Note that cell bodies are labeled in the cortex. B) Individual apical dendrites of pyramidal neurons can be resolved in the both images.
Figure 11.
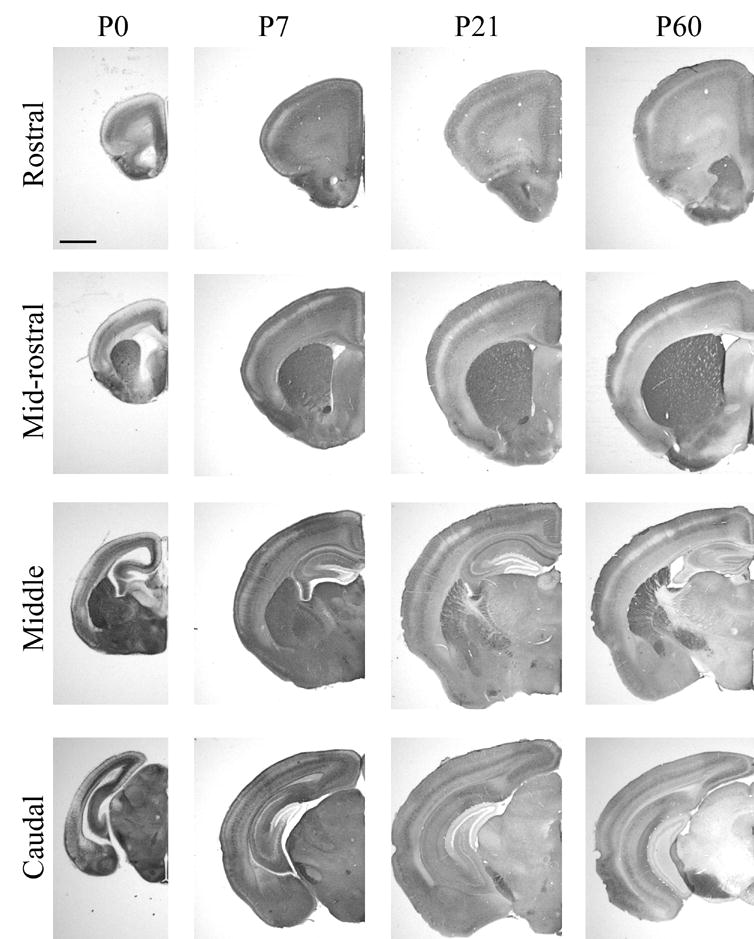
RGS4-GFP expression across ages and levels. Expression at P0, P7, P21 and P60 across rostral, mid-rostral, middle and caudal cortical areas following immunohistochemical visualization with an anti-GFP antibody and DAB staining. Scale bar = 1 mm for all images.
Rostral Cortical Areas
This level of cerebral cortex is defined as extending from +3.6 mm to −0.8 mm relative to Bregma (Paxinos and Franklin, 2001). Expression of RGS4-GFP in the mouse cortex is complex, developing differentially in multiple dimensions and domains. At P0, frontal regions of the cortex display somal RGS4-GFP expression in layer VI of the secondary motor cortex (M2) as well as in cingulate, prelimbic and infralimbic cortices (Fig 4A). Interestingly, RGS4-GFP somal labeling is far less robust in layer VI of more lateral regions of the rostral cortex, including lateral primary motor cortex (M1) and primary and secondary somatosensory cortex (S1/S2); these regions instead contain diffuse RGS4-GFP neuropil labeling. Coincident with the transition in layer VI is the appearance of substantial somal RGS4-GFP expression in layer V in these lateral regions, which is absent in more medial regions. At this level, there is moderate somal expression of RGS4-GFP in granular/dysgranular insular cortices and low levels in agranular insular cortices, claustrum and the dorsal endopiriform nucleus (Fig 4B). The piriform cortex displays prominent somal RGS4-GFP expression at this level (Fig 4B), and the olfactory tubercle displays substantial levels of RGS4-GFP expression (PJ Ebert, unpublished observations). Slightly more caudally, at the level of the septum, the transition between primarily layer VI versus layer V labeling is now seen at the S1/M1 boundary (Fig 4C). There continues to be moderate somal expression of RGS4-GFP in granular/dysgranular insular cortices and low levels in agranular insular cortex in both layer V and VI, as well as low levels of expression in the claustrum and dorsal endopiriform nucleus (Fig 4D). The piriform cortex continues to display prominent somal RGS4-GFP expression (Fig 4D), whereas the olfactory tubercle displays substantially decreased RGS4-GFP expression relative to more rostral levels (PJ Ebert, unpublished observations).
Figure 4.
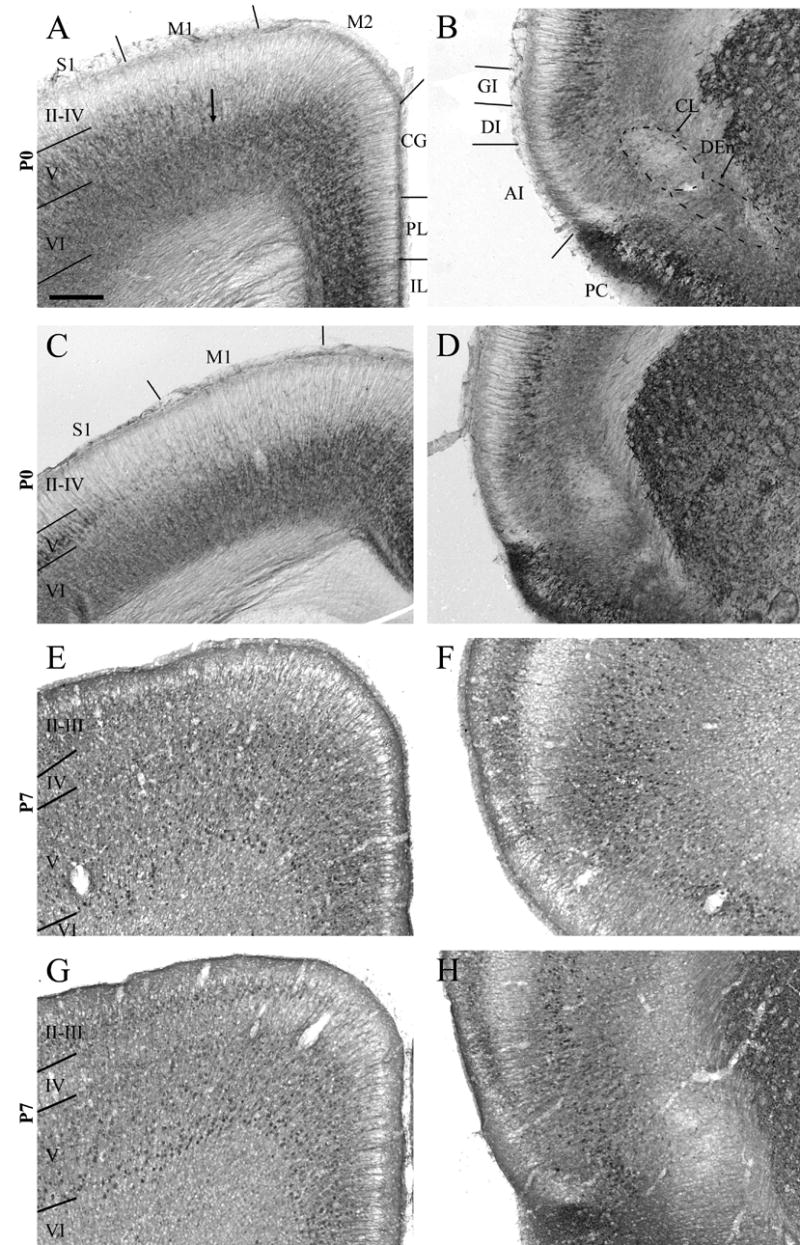
RGS4-GFP expression in the P0 and P7 rostral cortex. This region is bordered anteriorly by the end of the olfactory bulb and posteriorly by the beginning of the septal hippocampus. Dorsal (A,C,E,G) and ventral (B,D,F,H) views of the P0 (A–D) and P7 (E–H) cortex following immunohistochemical visualization with an anti-GFP antibody and DAB staining. Cortical layers II–VI are labeled. At both ages, the laminar distribution of immunolabeling is region-specific. Note the substantial change in expression of RGS4-GFP in supragranular layers (II–IV) between P0 and P7. AI, agranular insular cortex; CG, cingulate cortex; CL, claustrum; DEn, dorsal endopiriform nucleus; DI, dysgranular insular cortex; GI, granular insular cortex; IL, infralimbic cortex; M1, primary motor cortex; M2, secondary motor cortex; PL, prelimbic cortex; PC, piriform cortex; S1, primary somatosensory cortex. Scale bar in A = 200 μm for all images.
Analysis of rostral cortical areas at P7 reveals interesting differences in expression patterns relative to P0. The full extent of laminar development is evident at this age, and facilitates the visualization of differential RGS4-GFP expression across layers in different cortical areas. In the frontal cortex, RGS4-GFP expression in prelimbic/cingulate cortices and M2 is extensive, with layer VI displaying scattered somal expression, layer V revealing a substantially greater number of RGS4-GFP+ cells than were noted at P0, and layers II-IV displaying neuropil but little somal labeling (Fig 4E). M1, S1/S2 and granular/dysgranular insular cortices exhibit scattered RGS4-GFP expression in layer VI, concentrated mostly superficially in this layer (Fig 4E,F). Layer V in M1 displays robust somal labeling (Fig 4E), whereas RGS4-GFP somal expression in S1/S2 and granular/dysgranular insular cortices appears less numerous than in M1 (Fig 4F); as in more medial cortical areas, greater numbers of cells in this layer are RGS4-GFP+ at P7 than were noted at P0. The thin layer IV in M1 at this level appears to contain scattered labeling (Fig 4E). Somal RGS4-GFP labeling is now noted in layer II–III in M1, decreasing laterally through S1/S2 to only scattered cells in granular/dysgranular insular cortices (Fig 4E,F).
At the same age (P7), but slightly more caudally (at the rostral end of the septum), layer VI continues to display scattered RGS4-GFP labeling. RGS4-GFP expression is dense throughout layer V in cingulate cortex and M1/M2 (Fig 4G), but appears concentrated superficially in this layer in the somatosensory and granular/dysgranular insular cortices (Fig 4H). Somal RGS4-GFP expression in layer IV is evident in M1 but mostly absent in M2 and S1/S2 (Fig 4G,H). RGS4-GFP expression in somata of layers II–III differs regionally at P7, with prominent expression in S1 and M1, decreasing levels of expression noted with progression into S2 and M2, and little if any expression in cingulate and granular/dysgranular insular cortices (Fig 4G,H). Robust somal RGS4-GFP expression in the olfactory tubercle is restricted to very rostral regions (Fig 4F), with expression at somewhat more caudal regions located mostly in neuropil (Fig 4H). Expression of RGS4-GFP in the claustrum and dorsal endopiriform nucleus also is mostly in neuropil, with some scattered somal labeling (Fig 4H).
The patterns of RGS4-GFP in rostral cortical areas are similar at P21 (Fig 5A–D) and P60 (Fig 5E–H). RGS4-GFP staining remains strong throughout all layers of infralimbic/prelimbic/cingulate and granular/dysgranular insular cortices (Fig 5). While M1 displays high levels of expression in layer VI (Fig 5A,C,E,G), S1 contains only moderate numbers of RGS4-GFP+ cells in this layer (Fig 5B,D,F,H). Similar to P7, RGS4-GFP expression in motor cortex is heavy in layer V, with expression spanning the entire layer (Fig 5A,C,E,G). In contrast to P7, in S1 RGS4-GFP expression is restricted to deep layer V at P21 (Fig 5B,D), then broadens to span the entire layer by P60 (Fig 5F,H). At both ages, RGS4-GFP is expressed in a moderate number of cells in layer IV of M1, but is mostly excluded from this layer in S1 (Fig 5B,D,F,H). Interestingly, RGS4-GFP+ columns of cells spanning layer IV are evident in the region of S1 that receives thalamic fore- and hind-limb representations in the mouse (PJ Ebert, unpublished observations) (Paxinos and Franklin, 2001). RGS4-GFP expression is widespread in layer II–III of both M1 and S1 cortices (Fig 5).
Figure 5.
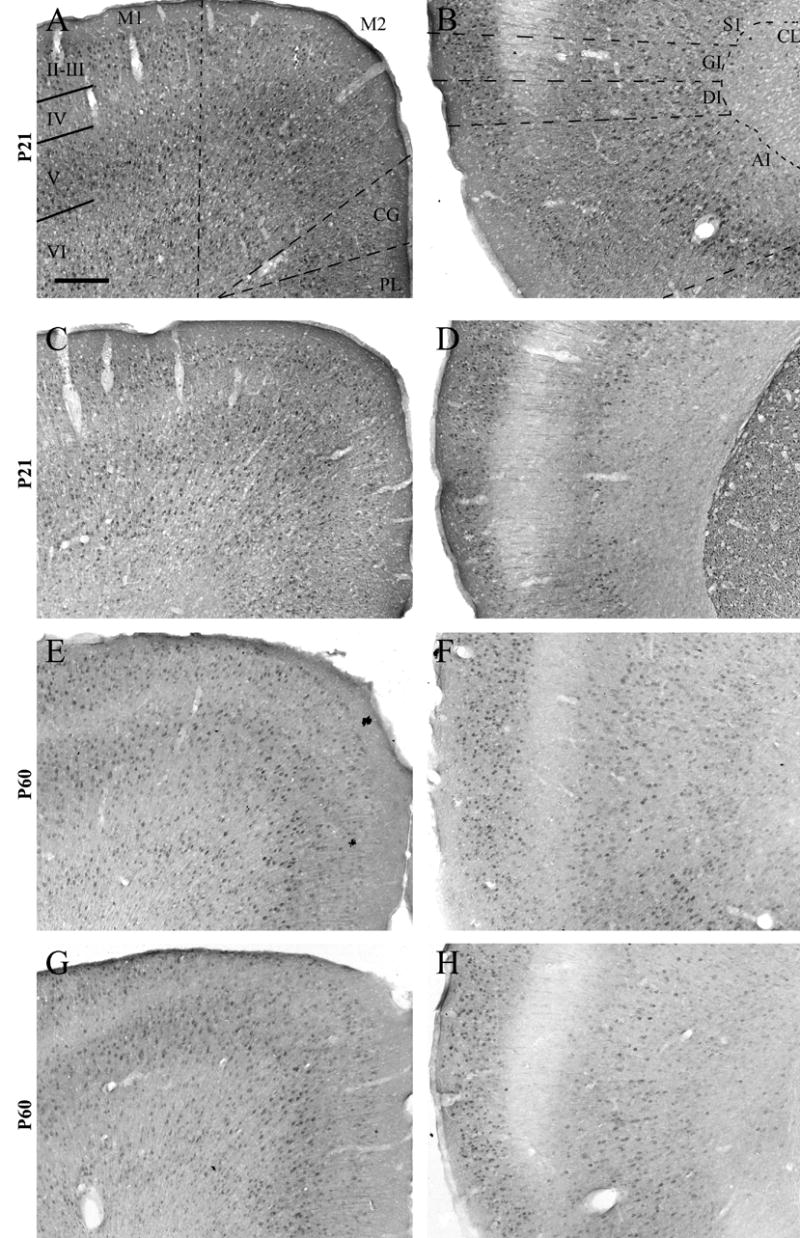
RGS4-GFP expression in the P21 and P60 rostral cortex. This region is bordered anteriorly by the end of the olfactory bulb and posteriorly by the beginning of the septal hippocampus. Dorsal (A,C,E,G) and ventral (B,D,F,H) views of the P21 (A–D) and P60 (E–H) cortex following immunohistochemical visualization with an anti-GFP antibody and DAB staining. Cortical layers II–VI are labeled. Note the lack of expression of RGS4-GFP in the soma of layer IV neurons. AI, agranular insular cortex; CG, cingulate cortex; CL, claustrum; DI, dysgranular insular cortex; GI, granular insular cortex; M1, primary motor cortex; M2, secondary motor cortex; PL, prelimbic cortex; S1, primary somatosensory cortex. Scale bar in A = 200 μm for all images.
Middle Cortical Areas
This cortical level extends from −0.8 mm to −2.5 mm relative to Bregma (Paxinos and Franklin, 2001). At birth, the laminar distribution of RGS4-GFP at this level is similar to more rostral cortical areas. Intense RGS4-GFP staining is noted in the somata of neurons situated in layer VI of granular and agranular retrosplenial, M1 and dorsal S1 cortices (Fig 6A). While neuropil staining in this layer is more intense in S2, perirhinal and ectorhinal cortices relative to retrosplenial cortices and S1, RGS4-GFP somal expression decreases in more ventral cortical areas; thus, moderate levels of staining are noted in somata of layer VI in S2, whereas lower levels are observed in layer VI soma of perirhinal and ectorhinal cortices (Fig 6B). In layer V, RGS4-GFP is expressed prominently in S1 cortex, with little to no expression in parietal association or retrosplenial cortical regions (Fig 6A). Piriform cortex displays robust somal and neuropil RGS4-GFP expression at this age, whereas expression of RGS4-GFP in both somata and neuropil of the claustrum and dorsal endopiriform nucleus is relatively low (Fig 6B). Cell body labeling is not evident in presumptive layers II–IV of the cortical plate at this age.
Figure 6.

RGS4-GFP expression in the P0-P60 middle cortical areas. These regions begin rostrally with the appearance of the septal end of the hippocampus and terminate with the disappearance of the striatum. Dorsal (A,C,E,G) and ventral (B,D,F,H) views of the P0 (A,B), P7 (C,D) P21 (E,F), and P60 (G,H) cortex following immunohistochemical visualization with an anti-GFP antibody and DAB staining. Cortical layers II–VI are labeled. Note the loss of RGS4-GFP expression between P0 and P7 in layer VI of dorsal and ventral cortex, and the reappearance of this immunoreactivity at P21 (A,C,E). Also note the numerous, although less intensely labeled soma in the S1 region of layer IV at P21 (E). DEn, dorsal endopiriform cortex; Ect, ectorhinal cortex; M1, primary motor cortex; PA, parietal association cortex; PC, piriform cortex; PRh, perirhinal cortex; RSA, agranular retrosplenial cortex; RSG, granular retrosplenial cortex; S1, primary somatosensory cortex; S2, secondary somatosensory cortex. Scale bar in A = 200 μm for all images.
At P7 in layer VI, somal expression of RGS4-GFP is noted in scattered cells in S2/retrosplenial/M1/parietal association and granular/dysgranular insular cortices (Fig 6C,D), and more numerously in S1 cortex (Fig 6C). RGS4-GFP is expressed throughout layer V at this level, although somal staining is more intense in neurons located deep within the layer (Fig 6C,D). Layer IV is mostly devoid of expression throughout most cortical regions, with a few scattered RGS4-GFP+ cells noted in granular retrosplenial cortex (Fig 6C). Layer II–III RGS4-GFP expression is notable in M1, parietal association, and S1 cortices (Fig 6C), but decreases ventrolaterally into granular/dysgranular insular cortices and dorsomedially into posterior cingulate/retrosplenial cortices (Fig 6C,D). Little to no somal RGS4-GFP expression is noted in the claustrum or dorsal endopiriform nucleus, but neuropil labeling is observed (Fig 6D).
Expression patterns are similar at P21 and P60 in this mid-level region of the cerebral cortex, but in general, staining intensity decreases with age. At the rostral boundary of the hippocampus at these ages, however, expression of RGS4-GFP in layer VI is different relative to that noted at P7, with substantial somal RGS4-GFP expression in S1/S2, M1/M2 and granular/dysgranular insular cortices, and scattered expression in posterior cingulate and retrosplenial cortices (Fig 6E–H). Neurons of layer V broadly express RGS4-GFP, but, as observed at P7, expression is more robust deeper in the layer (Fig 6E–H). In layer IV, RGS4-GFP expression in granular cortical regions is more abundant than observed more rostrally, with numerous RGS4-GFP+ cells noted in the dorsal S1 cortex at P21 (Fig 6E), although many fewer are evident at P60 (Fig 6G). Retrosplenial cortices also display numerous RGS4-GFP+ cells in layer IV at P21 (Fig 6E), albeit at lower levels of expression than in the neighboring layer V; expression in layer IV of the retrosplenial cortices is not detectable at P60 (Fig 6G). Although few RGS4-GFP+ cells are noted in layers II-III of the P21 and P60 retrosplenial cortices (Fig 6E,G), layers II–III in S1/S2, ectorhinal and perirhinal cortices are extensively populated with RGS4-GFP+ cells at these ages (Fig 6E–H).
Caudal Cortical Areas
This cortical level extends from −2.5 mm to −5.2 mm relative to Bregma (Paxinos and Franklin, 2001). The pattern of RGS4-GFP immunostaining caudal to the caudate-putamen (CP) is distinct from the more rostral and middle regions of the hemisphere. At P0, RGS4-GFP expression is prominent in both retrosplenial cortices and primary and secondary visual cortical areas (V1/V2), labeling both superficial and deep layer VI (Fig 7A). With ventro-lateral progression into regions that include auditory and temporal association cortices, the number of neurons in layer VI that express RGS4-GFP decreases (Fig 7B), although staining intensity in individual cells does not appear to differ. RGS4-GFP expression in layer V is moderate, lower in cell number and intensity relative to layer VI. Layer V staining is most prominent in V1/V2 (Fig 7A), with decreased labeling in retrosplenial cortical areas and non-detectable levels in auditory cortices (Fig 7A,B). RGS4-GFP expression is absent in layers II–IV at this A/P level. The medial and lateral entorhinal cortices display robust somal labeling at this age (Fig 8A).
Figure 7.
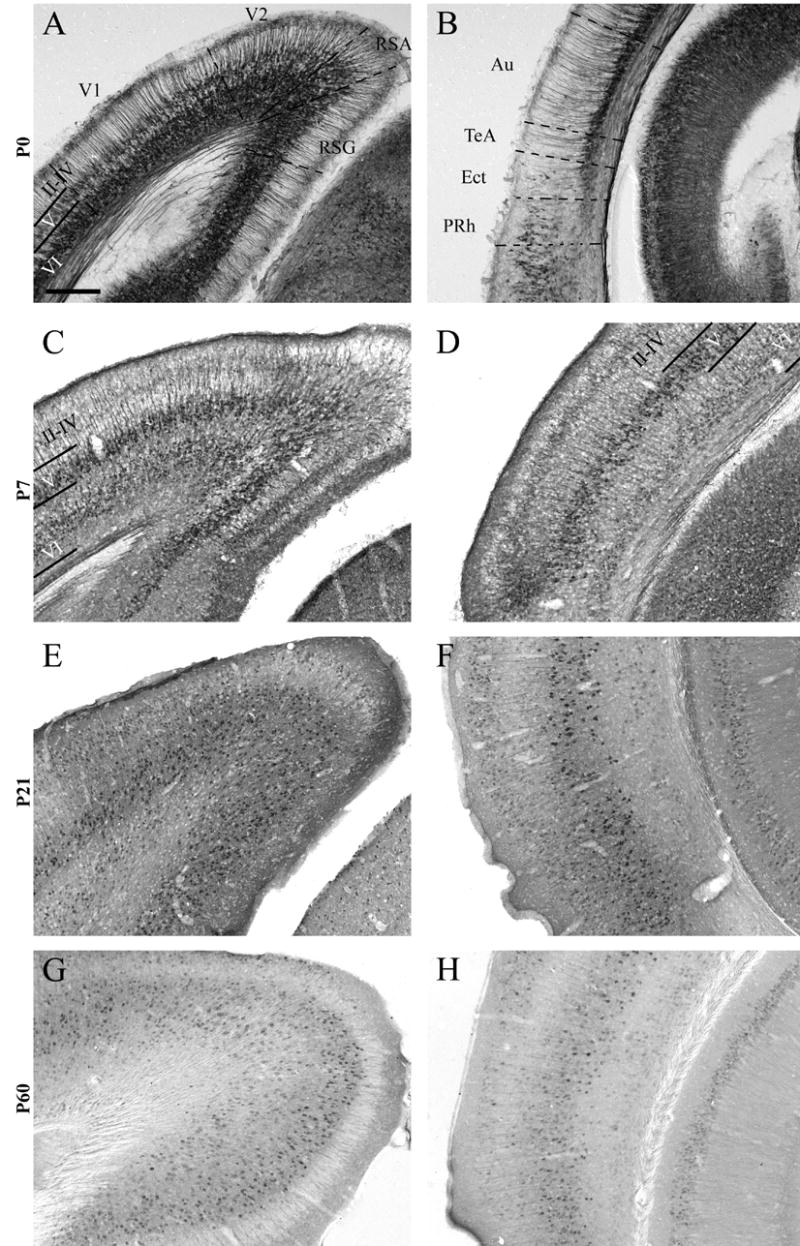
RGS4-GFP expression in the P0-P60 caudal cortex. This region is bordered rostrally by the striatum and caudally by the end of the cortex. Dorsal (A,C,E,G) and ventral (B,D,F,H) views of the P0 (A,B), P7 (C,D) P21 (E,F), and P60 (G,H) cortex following immunohistochemical visualization with an anti-GFP antibody and DAB staining. Cortical layers II–VI are labeled. Note the initial expression of RGS4-GFP throughout lateral regions of the cortex in layer VI at P0, and the maintenance of this expression in deep layer VI but not superficial layer VI (B, D, F, H), albeit at reduced levels at P21/P60. Au, auditory cortex; Ect, ectorhinal cortex; PRh, perirhinal cortex; RSA, agranular retrosplenial cortex; RSG, granular retrosplenial cortex; Te, temporal association cortex; V1, primary visual cortex; V2, secondary visual cortex. Scale bar in A = 200 μm for all images.
Figure 8.
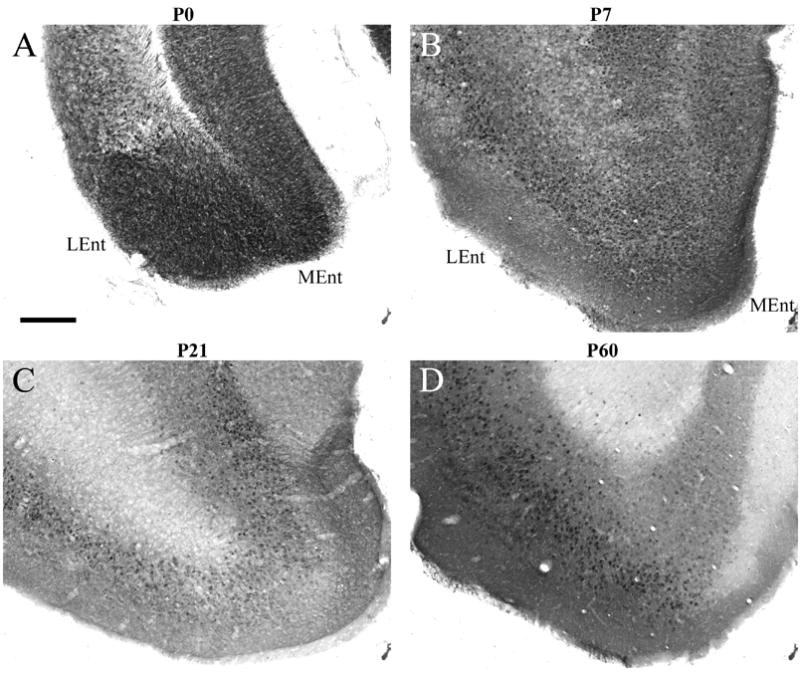
RGS4-GFP expression in the P0-P60 entorhinal cortex. Expression of RGS4-GFP in the entorhinal cortex at P0 (A), P7 (B), P21 (C), P60 (D) following immunohistochemical visualization with an anti-GFP antibody and DAB staining. Note the decreased expression of RGS4 in the medial entorhinal cortex at P60. LEnt, lateral entorhinal cortex; MEnt, medial entorhinal cortex. Scale bar in A = 200 μm for all images.
At P7, RGS4-GFP expression is notable throughout the full extent of layer VI (Fig 7C, D). The highest levels of somal RGS4-GFP expression are evident in deep layer VI (Fig 7D), in contrast to the more intense labeling noted superficially in layer VI at this age in more rostral regions of the cortex. In addition, throughout this layer there is substantial neuropil labeling with RGS4-GFP. Prominent somal and neuropil RGS4-GFP expression is noted throughout the full extent of layer V (Fig 7C,D). In layer IV of auditory (Fig 7D) and medial regions of secondary visual (V2) cortices, dense neuropil and scattered somal labeling are observed (PJ Ebert, unpublished observations). Layers II–III exhibit differential expression across cortical subdomains, with little to no RGS4-GFP staining in retrosplenial cortices and primary visual (V1) or V2 cortices (Fig 7C); low levels of expression are noted in auditory and temporal association cortices (Fig 7D). In contrast, RGS4-GFP staining within medial and lateral entorhinal cortices continues to be intense at this age (Fig 8B).
At P21/P60, immunostaining of RGS4-GFP in layer VI is maintained throughout retrosplenial, V1/V2 and auditory cortices (Fig 7E–H), and continues to label deep layer VI somewhat more strongly than superficial layer VI, particularly at P21 (Fig 7E,F). Expression of RGS4-GFP in layer V is abundant throughout caudal cortex at both ages (Fig 7E-H). RGS4-GFP+ cells are also numerous in layer IV of the P21 auditory and V1/V2 cortices (Fig 7E,F), with generally greater numbers of RGS4-GFP+ cells noted more caudally than rostrally. Expression in this layer at P60, however, is much decreased relative to P60. At this caudal level, RGS4-GFP+ neurons are present in layers II/III throughout the cortex (Fig 7E–H), except in retrosplenial regions where few cells express RGS4-GFP (Fig 7E,G). RGS4-GFP expression in medial and lateral entorhinal cortices is maintained at high levels at these later ages (Fig 8C,D), although expression in medial entorhinal cortex is slightly lower relative to lateral entorhinal cortex at P60 (Fig 8D).
Hippocampus
Expression of RGS4-GFP in the rostral hippocampus changes in a complex spatial and temporal manner. At P0, somal RGS4-GFP expression appears in the superficial (dorsal) stratum pyramidale at the septal end of the hippocampus, with modest neuropil labeling noted in stratum radiatum and oriens (Fig 9A). At P7 the expression of RGS4-GFP expands to include increasing numbers of cells in the stratum pyramidale at the septal end of the hippocampus, whereas expression in neuropil staining of the stratum radiatum and oriens is intense (Fig 9C). Expression of RGS4-GFP in the stratum pyramidale is similar at P21 and P60. Specifically, most cells in the CA1 region of the stratum pyramidale of the rostral hippocampus are RGS4-GFP+, and staining in the neuropil of the stratum radiatum and oriens is maintained at robust levels (Fig 9E,G). At all ages, the stratum pyramidale of CA3 displays numerous RGS4-GFP+ neurons. The stratum lucidem (SLu) is essentially devoid of expression at all time points analyzed (Fig 9B,D,F,H).
Figure 9.

RGS4-GFP expression in the P0-P60 hippocampus. Medial (A,C,E,G) and lateral (B,D,F,H) views of the P0 (A,B), P7 (C,D) P21 (E,F), and P60 (G,H) hippocampus following immunohistochemical visualization with an anti-GFP antibody and DAB staining. Note the gradual increase in pyramidal cell staining in CA1 regions and the lack of staining in the stratum lucidem. Or, stratum oriens; Pyr, stratum pyramidale; Rad, stratum radiatum; SLu, stratum lucidem; Sub, subiculum. Scale bar in A = 200 μm for all images.
Dentate Gyrus
The developmental pattern of RGS4-GFP expression in the dentate gyrus is somewhat different than that seen in the hippocampus proper. RGS4-GFP expression is essentially absent in the dentate gyrus at P0, including the polymorphic hilar, granule cell and molecular layers (Fig 10A). By P7, neuropil labeling is evident in multiple regions of the dentate gyrus, and somal labeling is noted in the external (dorsal) blade of the granule cell layer (Fig 10B). At P21, greater numbers of RGS4-GFP+ soma are noted in both internal and external blades of the granule cell layer relative to earlier ages, but this labeling still does not include the vast majority of cells of this region (Fig 10C). In addition, numerous, intensely stained neurons that express RGS4-GFP are noted in the hilus at this age. Strikingly, projections innervating the inner molecular layer (presumably commissural and association) are RGS4-GFP+, giving rise to a pronounced immunoreactive lamina (Fig 10C). Low levels of RGS4-GFP neuropil expression are also noted in the outer molecular layer, presumably representing axons arriving via the perforant pathway. At P60, expression within multiple domains of the dentate gyrus is expanded relative to that seen at P21. At this age both the outer and inner molecular layers exhibit intense RGS4-GFP neuropil labeling, whereas neuropil staining in the middle one-third of the molecular layers is low (Fig 10D). Greater numbers of RGS4-GFP+ cells are noted in the granule cell layer at P60 relative to earlier ages; however this expression fails to include all cells of this layer, with more cells adjacent to the molecular layer expressing RGS4-GFP (Fig 10D). Notably, in most cortical regions induction of RGS4-GFP expression is coincident with elaboration of afferent processes, with afferent ingrowth to the dentate gyrus occuring before P0 (Makuch et al., 2001); however RGS4-GFP expression is not noted until P7. It is also noteworthy that early RGS4-GFP labeling in the granule cell layer is concentrated in superficial regions (relative to the polymorphic hilar layer), a chronologically older population than those closer to the hilus (Altman and Das, 1965).
Figure 10.
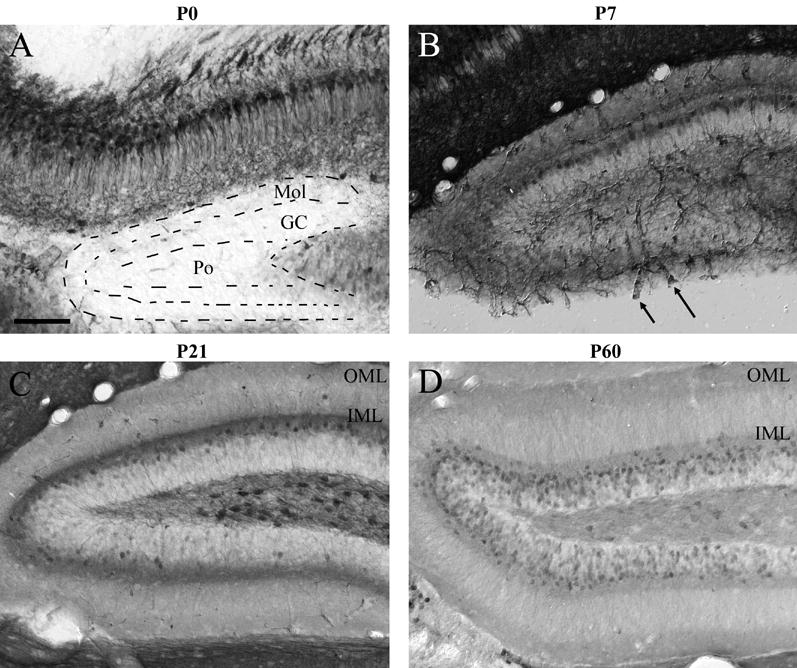
RGS4-GFP expression in the P0-P60 dentate gyrus. Expression of RGS4-GFP in the dentate gyrus at P0 (A), P7 (B), P21 (C), P60 (D) following immunohistochemical visualization with an anti-GFP antibody and DAB staining. Note the labeling of blood vessels at P7 (B, arrows) and the lack of staining in the majority of cells of the granule cell layer until P60. Also note the labeling of the inner and outer molecular layer at P60 relative to P21 (C and D, OML vs IML). GC, granule cell layer of dentate gyrus; IML, inner molecular layer; Mol, molecular layer of dentate gyrus; OML, outer molecular layer; Po, polymorphic hilar layer of dentate gyrus. Scale bar in A = 200 μm for all images.
Discussion
The method of using BAC transgenesis to map dynamic expression patterns of proteins of interest has been validated by a number of studies, including those analyzed in the GENSAT project (Heintz, 2004). In particular, this approach appears to be ideal for proteins that are members of large families and whose sequence homologies and levels of expression may pose particular problems in generating and using monospecific antibodies in tissue sections. While in situ hybridization provides an excellent representation of populations that express a particular transcript, the lack of information on expression in elements of the neuropil and fiber tracts leaves a substantial information gap. Here, we generated several BAC transgenic lines expressing RGS4-GFP and show that, during postnatal cortical development, there are complex patterns of expression that exhibit regional and laminar specificity. Such information is essential for understanding the function and physiological nature of disrupted RGS4 function in over- and under-expression genetic models, and in relation to neuropsychiatric disorders, such as schizophrenia (Mirnics et al., 2001), Alzheimers (Emilsson et al., 2005) and Huntingtons disease (Luthi-Carter et al., 2005), in which altered RGS4 expression has been associated with the disease. The dynamic patterns of RGS4-GFP expression indicate that, like neurotransmitter receptors, extrapolating adult expression patterns to developmental time periods is not feasible.
RGS4-GFP displays lamina/region-specific expression during development
RGS4-GFP expression is dynamically modulated during development. Expression initiates in an inside-out pattern, correlating with the general progression of cortical development. Supra- and infragranular layers exhibit dense labeling. We found that the most striking aspect of the expression pattern is the relative absence of labeling of neurons in layer IV at all ages in rostral and middle cortical areas. This is not absolute, as caudally, particularly in auditory regions, numerous RGS4-GFP+ cells are noted from P7 through to adulthood in this layer. Layer IV is the primary layer of termination of thalamocortical afferents. The differences in RGS4-GFP expression in layer IV across areas suggest that RGS4 is in position to modulate thalamic input in very selective sensory and association domains. In layers II–III and VI, we also noted a dichotomous pattern of RGS4-GFP expression in rostral versus caudal cortex, suggesting fundamental differences in the role of RGS4 in regulating corticothalamic feedback (layer VI) and corticocortical communication (layers II–III) in visual versus somatosensory domains.
Regional Differences in Laminar Expression Parallel Other Signaling Systems
One of the most striking observations from these studies is the concordance of patterns of RGS4 expression with previously demonstrated acetylcholinesterase staining (Paxinos and Franklin, 2001), suggesting a role for RGS4 in the regulation of cholinergic signaling via muscarinic GPCRs. The patterns of RGS4-GFP expression compare closely to those of M1 and M3 muscarinic receptors in the cortex, including the relative absence of expression in layer IV and lower levels of expression in deep layers relative to superficial layers (M1), and M1/M4 muscarinic receptors in the hippocampus (Brann et al., 1988, Buckley et al., 1988, Levey et al., 1991, Levey et al., 1995). Moreover, it has been shown previously that RGS4 preferentially attenuated muscarinic receptors relative to bombesin and cholecystokinin receptors in isolated pancreatic acinar cells (Xu et al., 1999). In addition, it was recently demonstrated that RGS4 physically associates with the third intracellular loop of M1, M4 and M5 muscarinic receptors (Bernstein et al., 2004), and Surmeier and colleagues have demonstrated RGS4-dependent modulation of M4-regulated calcium currents in cholinergic interneurons of the striatum (Ding, in press). Further experiments examining the function of muscarinic signaling systems in RGS4-deficient and RGS4-overexpressing mice will aid in determining the role of RGS4 in regulation of cholinergic function in the mouse cortex. In addition, analysis of the expression of RGS4 in the absence of specific muscarinic receptors may illuminate cross-regulatory interactions between RGS4 and G-protein coupled cholinergic signaling.
Mature Laminar Patterns of RGS4 expression – Phylogenetic Influences
Based on current data from our BAC transgenic mice and previous RGS4 in situ hybridization studies (Gold et al., 1997, Nomoto et al., 1997, Ingi and Aoki, 2002), expression in the rodent frontal cortex displays laminar differences, such that infragranular layers of the cortex, particularly layer VI, express less RGS4 than supragranular regions. Supra- and infragranular expression of RGS4 mRNA in the monkey and human prefrontal cortex, however, appears to be equivalent (Mirnics et al., 2001, Erdely et al., 2004). This could reflect differential laminar expression of a subset of receptors in primates compared to rodents. Binding analysis of M1 and M2 class muscarinic receptors reveals a relatively consistent expression of muscarinic receptor binding sites across the lamina of the monkey prefrontal cortex and human temporal cortex (Mash et al., 1988, Piggott et al., 2002), while radiolabeled muscarinic antagonist binding (quinuclidinyl benzilate/N-methylscopolamine/pirenzepine) and muscarinic antibody immunoreactivity in the mouse cortex (Levey et al., 1991, Tien et al., 2004) strongly resembles the pattern of disproportionate deep and superficial expression that we report for RGS4-GFP. Dopamine D1- and D2-like receptors are expressed at relatively similar levels across both the rodent and primate cortex, inconsistent with differential RGS4 expression between rodent and primate in deep layers of the cortex (Liskowsky and Potter, 1985, Lidow et al., 1989b, Lidow et al., 1991, Weiner et al., 1991, Goldman-Rakic et al., 1992, Ongali et al., 2000). 5-HT1-type receptor binding is noted throughout the cortex but tends to be enriched superficially in monkey and human, whereas 5-HT2 type receptors, though expressed throughout, appear enriched in layers III-V in the monkey and human cortex (Biegon et al., 1986, Hoyer et al., 1986a, Hoyer et al., 1986b, Pazos et al., 1987a, Pazos et al., 1987b, Lidow et al., 1989a). In the rat, 5-HT1 receptor binding is expressed higher infragranularly and 5-HT2 receptor binding is enriched in layer III and IV (Pazos et al., 1985, Pazos and Palacios, 1985), while in the mouse 5-HT1 receptors are expressed relatively equally across all lamina and 5-HT2 receptors are generally similar across all lamina with decreased labeling of layer VI (Farisse et al., 2000). Whereas these data are generally consistent with a role for RGS4 in modulating serotonin receptor function in the mouse, the rat data suggest a disparity, as RGS4 expression in the mouse and rat cortex are quite similar (Gold et al., 1997). Further experiments examining the subcellular localization of RGS4 in the mouse cortex, in particular focusing on colocalization of RGS4 with muscarinic and serotonergic receptors will be helpful in beginning to resolve the question of RGS4-receptor specificity.
Influences Related to the Timing of Appearance of RGS4
Examination of the induction of RGS4-GFP expression in the developing cortex reveals a generalized deep to superficial developmental gradient during the first postnatal week, consistent with the order of birth of neurons within this region. However, RGS4-GFP expression is restricted to the deep cortical plate at P0 and is not expressed in the embryonic ventricular zone (PJ Ebert, unpublished observations), inconsistent with RGS4 regulating cell cycle exit or cell migration from the ventricular zone to more superficial regions within the cortical plate. Induction of RGS4 expression in the cortex is also delayed relative to neurotransmitter receptor populations such as muscarinic, dopaminergic, serotonergic or metabotropic glutamate receptors. Specific family members of all of these major receptor types are expressed at or before birth throughout the tangential extent of the cortical plate (Roth et al., 1991, Kinzie et al., 1995, Shearman et al., 1997, Di Giorgi Gerevini et al., 2004, Williams et al., 2004a). However, the pattern of RGS4 expression during the first postnatal week is consistent with afferent input directing the initial expression of RGS4 during development through activation of neurotransmitter receptors. Although the primary axons from neuromodulatory projection neurons in the basal forebrain (cholinergic), locus coeruleus (noradrenergic), ventral tegmental area (dopaminergic) and raphe (serotonergic) arrive pre- or perinatally, their influence may be greatest during the first postnatal weeks, when an extensive elaboration of afferents occurs (Levitt and Moore, 1979, Lidov and Molliver, 1982, Kalsbeek et al., 1988, Mechawar and Descarries, 2001). Previous studies have demonstrated that peripheral administration of drugs that alter the levels of endogenous neuromodulators (such as dopamine) dynamically regulates RGS4 mRNA expression (Burchett et al., 1999, Bishop et al., 2002, Geurts et al., 2003, Gold et al., 2003, Taymans et al., 2003, Taymans et al., 2004). Manipulating these neuromodulatory systems developmentally may allow a better understanding of the mechanisms mediating dynamic regulation of RGS4 expression and provide clues to the identity of the receptor systems RGS4 endogenously modulates.
Conclusions
The neuroanatomical specificity with which RGS4-GFP is expressed during postnatal development is consistent with a role for this protein in the modulation of a subset of GPCRs. Expression of RGS4-GFP in afferents and target neurons, a pattern which is not amenable to detection using in situ hybridization methods, also indicates that autoreceptor and post-synaptic signaling are likely to be influenced by RGS4 during specific time periods of development. The differences in expression patterns across cortical areas provide valuable information for determining the impact of manipulating RGS4 expression in identified, developing cortical circuits.
Acknowledgments
The authors would like to thank Chaohui Tang and Angela Sanders for excellent technical assistance. We are grateful for comments on the manuscript provided by Drs. Kathie Eagleson and Gregg Stanwood. Support provided by MH45156 (PL), NICHD Core Grant P30 HD15052 (PL), McKnight Foundation Neuroscience of Brain Disorders Award (PL), Young Investigator Award from the National Alliance for Research on Schizophrenia and Depression (PE), Postdoctoral Training in Neurogenomics T32 MH065215 (PE).
Footnotes
Attention Section Editor: Dr. John L.R. Rubenstein
References
- Altman J, Das GD. Autoradiographic and histological evidence of postnatal hippocampal neurogenesis in rats. J Comp Neurol. 1965;124:319–335. doi: 10.1002/cne.901240303. [DOI] [PubMed] [Google Scholar]
- Berman DM, Wilkie TM, Gilman AG. GAIP and RGS4 are GTPase-activating proteins for the Gi subfamily of G protein alpha subunits. Cell. 1996;86:445–452. doi: 10.1016/s0092-8674(00)80117-8. [DOI] [PubMed] [Google Scholar]
- Bernstein LS, Ramineni S, Hague C, Cladman W, Chidiac P, Levey AI, Hepler JR. RGS2 binds directly and selectively to the M1 muscarinic acetylcholine receptor third intracellular loop to modulate Gq/11alpha signaling. J Biol Chem. 2004;279:21248–21256. doi: 10.1074/jbc.M312407200. [DOI] [PubMed] [Google Scholar]
- Biegon A, Kargman S, Snyder L, McEwen BS. Characterization and localization of serotonin receptors in human brain postmortem. Brain Res. 1986;363:91–98. doi: 10.1016/0006-8993(86)90661-x. [DOI] [PubMed] [Google Scholar]
- Bishop GB, Cullinan WE, Curran E, Gutstein HB. Abused drugs modulate RGS4 mRNA levels in rat brain: comparison between acute drug treatment and a drug challenge after chronic treatment. Neurobiol Dis. 2002;10:334–343. doi: 10.1006/nbdi.2002.0518. [DOI] [PubMed] [Google Scholar]
- Brann MR, Buckley NJ, Bonner TI. The striatum and cerebral cortex express different muscarinic receptor mRNAs. FEBS Lett. 1988;230:90–94. doi: 10.1016/0014-5793(88)80648-3. [DOI] [PubMed] [Google Scholar]
- Buckley NJ, Bonner TI, Brann MR. Localization of a family of muscarinic receptor mRNAs in rat brain. J Neurosci. 1988;8:4646–4652. doi: 10.1523/JNEUROSCI.08-12-04646.1988. [DOI] [PMC free article] [PubMed] [Google Scholar]
- Burchett SA, Bannon MJ, Granneman JG. RGS mRNA expression in rat striatum: modulation by dopamine receptors and effects of repeated amphetamine administration. J Neurochem. 1999;72:1529–1533. doi: 10.1046/j.1471-4159.1999.721529.x. [DOI] [PubMed] [Google Scholar]
- Campbell DB, Levitt P. Regionally restricted expression of the transcription factor c-myc intron 1 binding protein during brain development. J Comp Neurol. 2003;467:581–592. doi: 10.1002/cne.10958. [DOI] [PubMed] [Google Scholar]
- Chen X, Dunham C, Kendler S, Wang X, O’Neill FA, Walsh D, Kendler KS. Regulator of G-protein signaling 4 (RGS4) gene is associated with schizophrenia in Irish high density families. Am J Med Genet B Neuropsychiatr Genet. 2004;129:23–26. doi: 10.1002/ajmg.b.30078. [DOI] [PubMed] [Google Scholar]
- Chowdari KV, Mirnics K, Semwal P, Wood J, Lawrence E, Bhatia T, Deshpande SN, B KT, Ferrell RE, Middleton FA, Devlin B, Levitt P, Lewis DA, Nimgaonkar VL. Association and linkage analyses of RGS4 polymorphisms in schizophrenia. Hum Mol Genet. 2002;11:1373–1380. doi: 10.1093/hmg/11.12.1373. [DOI] [PubMed] [Google Scholar]
- Di Giorgi Gerevini VD, Caruso A, Cappuccio I, Ricci Vitiani L, Romeo S, Della Rocca C, Gradini R, Melchiorri D, Nicoletti F. The mGlu5 metabotropic glutamate receptor is expressed in zones of active neurogenesis of the embryonic and postnatal brain. Brain Res Dev Brain Res. 2004;150:17–22. doi: 10.1016/j.devbrainres.2004.02.003. [DOI] [PubMed] [Google Scholar]
- Ding J, Guzman JN, Tkatch T, Chen S, Goldberg JA, Ebert PJ, Levitt P, Wilson CJ, Hamm HE, Surmeier DJ. RGS4-dependent attenuation of M4 autoreceptor function in striatal cholinergic interneurons following dopamine depletion. Nat Neuroscience. doi: 10.1038/nn1700. in press. [DOI] [PubMed] [Google Scholar]
- Druey KM, Blumer KJ, Kang VH, Kehrl JH. Inhibition of G-protein-mediated MAP kinase activation by a new mammalian gene family. Nature. 1996;379:742–746. doi: 10.1038/379742a0. [DOI] [PubMed] [Google Scholar]
- Ebert PJ, Campbell DB, Levitt P. BAC Transgenic Analysis of Dynamic Expression Patterns of Regulator of G-Protein Signaling 4 (RGS4) During Development. II. Subcortical Regions. doi: 10.1016/j.neuroscience.2006.08.012. co-submitted. [DOI] [PubMed] [Google Scholar]
- Emilsson L, Saetre P, Jazin E. Alzheimer’s disease: mRNA expression profiles of multiple patients show alterations of genes involved with calcium signaling. Neurobiol Dis. 2005 doi: 10.1016/j.nbd.2005.09.004. [DOI] [PubMed] [Google Scholar]
- Erdely HA, Lahti RA, Lopez MB, Myers CS, Roberts RC, Tamminga CA, Vogel MW. Regional expression of RGS4 mRNA in human brain. Eur J Neurosci. 2004;19:3125–3128. doi: 10.1111/j.0953-816X.2004.03364.x. [DOI] [PubMed] [Google Scholar]
- Farisse J, Hery F, Barden N, Hery M, Boulenguez P. Central 5-HT(1) and 5-HT(2) binding sites in transgenic mice with reduced glucocorticoid receptor number. Brain Res. 2000;862:145–153. doi: 10.1016/s0006-8993(00)02104-1. [DOI] [PubMed] [Google Scholar]
- Geurts M, Maloteaux JM, Hermans E. Altered expression of regulators of G-protein signaling (RGS) mRNAs in the striatum of rats undergoing dopamine depletion. Biochem Pharmacol. 2003;66:1163–1170. doi: 10.1016/s0006-2952(03)00447-7. [DOI] [PubMed] [Google Scholar]
- Gold SJ, Han MH, Herman AE, Ni YG, Pudiak CM, Aghajanian GK, Liu RJ, Potts BW, Mumby SM, Nestler EJ. Regulation of RGS proteins by chronic morphine in rat locus coeruleus. Eur J Neurosci. 2003;17:971–980. doi: 10.1046/j.1460-9568.2003.02529.x. [DOI] [PubMed] [Google Scholar]
- Gold SJ, Ni YG, Dohlman HG, Nestler EJ. Regulators of G-protein signaling (RGS) proteins: region-specific expression of nine subtypes in rat brain. J Neurosci. 1997;17:8024–8037. doi: 10.1523/JNEUROSCI.17-20-08024.1997. [DOI] [PMC free article] [PubMed] [Google Scholar]
- Goldman-Rakic PS, Lidow MS, Smiley JF, Williams MS. The anatomy of dopamine in monkey and human prefrontal cortex. J Neural Transm Suppl. 1992;36:163–177. doi: 10.1007/978-3-7091-9211-5_8. [DOI] [PubMed] [Google Scholar]
- Grillet N, Dubreuil V, Dufour HD, Brunet JF. Dynamic expression of RGS4 in the developing nervous system and regulation by the neural type-specific transcription factor Phox2b. J Neurosci. 2003;23:10613–10621. doi: 10.1523/JNEUROSCI.23-33-10613.2003. [DOI] [PMC free article] [PubMed] [Google Scholar]
- Heintz N. BAC to the future: the use of bac transgenic mice for neuroscience research. Nat Rev Neurosci. 2001;2:861–870. doi: 10.1038/35104049. [DOI] [PubMed] [Google Scholar]
- Heintz N. Gene expression nervous system atlas (GENSAT) Nat Neurosci. 2004;7:483. doi: 10.1038/nn0504-483. [DOI] [PubMed] [Google Scholar]
- Hollinger S, Hepler JR. Cellular regulation of RGS proteins: modulators and integrators of G protein signaling. Pharmacol Rev. 2002;54:527–559. doi: 10.1124/pr.54.3.527. [DOI] [PubMed] [Google Scholar]
- Hoyer D, Pazos A, Probst A, Palacios JM. Serotonin receptors in the human brain. I Characterization and autoradiographic localization of 5-HT1A recognition sites Apparent absence of 5-HT1B recognition sites. Brain Res. 1986a;376:85–96. doi: 10.1016/0006-8993(86)90902-9. [DOI] [PubMed] [Google Scholar]
- Hoyer D, Pazos A, Probst A, Palacios JM. Serotonin receptors in the human brain. II Characterization and autoradiographic localization of 5-HT1C and 5-HT2 recognition sites. Brain Res. 1986b;376:97–107. doi: 10.1016/0006-8993(86)90903-0. [DOI] [PubMed] [Google Scholar]
- Ingi T, Aoki Y. Expression of RGS2, RGS4 and RGS7 in the developing postnatal brain. Eur J Neurosci. 2002;15:929–936. doi: 10.1046/j.1460-9568.2002.01925.x. [DOI] [PubMed] [Google Scholar]
- Kalsbeek A, Voorn P, Buijs RM, Pool CW, Uylings HB. Development of the dopaminergic innervation in the prefrontal cortex of the rat. J Comp Neurol. 1988;269:58–72. doi: 10.1002/cne.902690105. [DOI] [PubMed] [Google Scholar]
- Kinzie JM, Saugstad JA, Westbrook GL, Segerson TP. Distribution of metabotropic glutamate receptor 7 messenger RNA in the developing and adult rat brain. Neuroscience. 1995;69:167–176. doi: 10.1016/0306-4522(95)00244-d. [DOI] [PubMed] [Google Scholar]
- Koelle MR, Horvitz HR. EGL-10 regulates G protein signaling in the C. elegans nervous system and shares a conserved domain with many mammalian proteins. Cell. 1996;84:115–125. doi: 10.1016/s0092-8674(00)80998-8. [DOI] [PubMed] [Google Scholar]
- Lee EC, Yu D, Martinez de Velasco J, Tessarollo L, Swing DA, Court DL, Jenkins NA, Copeland NG. A highly efficient Escherichia coli-based chromosome engineering system adapted for recombinogenic targeting and subcloning of BAC DNA. Genomics. 2001;73:56–65. doi: 10.1006/geno.2000.6451. [DOI] [PubMed] [Google Scholar]
- Levey AI, Edmunds SM, Koliatsos V, Wiley RG, Heilman CJ. Expression of m1-m4 muscarinic acetylcholine receptor proteins in rat hippocampus and regulation by cholinergic innervation. J Neurosci. 1995;15:4077–4092. doi: 10.1523/JNEUROSCI.15-05-04077.1995. [DOI] [PMC free article] [PubMed] [Google Scholar]
- Levey AI, Kitt CA, Simonds WF, Price DL, Brann MR. Identification and localization of muscarinic acetylcholine receptor proteins in brain with subtype-specific antibodies. J Neurosci. 1991;11:3218–3226. doi: 10.1523/JNEUROSCI.11-10-03218.1991. [DOI] [PMC free article] [PubMed] [Google Scholar]
- Levitt P, Moore RY. Development of the noradrenergic innervation of neocortex. Brain Res. 1979;162:243–259. doi: 10.1016/0006-8993(79)90287-7. [DOI] [PubMed] [Google Scholar]
- Lidov HG, Molliver ME. An immunohistochemical study of serotonin neuron development in the rat: ascending pathways and terminal fields. Brain Res Bull. 1982;8:389–430. doi: 10.1016/0361-9230(82)90077-6. [DOI] [PubMed] [Google Scholar]
- Lidow MS, Goldman-Rakic PS, Gallager DW, Rakic P. Quantitative autoradiographic mapping of serotonin 5-HT1 and 5-HT2 receptors and uptake sites in the neocortex of the rhesus monkey. J Comp Neurol. 1989a;280:27–42. doi: 10.1002/cne.902800104. [DOI] [PubMed] [Google Scholar]
- Lidow MS, Goldman-Rakic PS, Gallager DW, Rakic P. Distribution of dopaminergic receptors in the primate cerebral cortex: quantitative autoradiographic analysis using [3H]raclopride, [3H]spiperone and [3H]SCH23390. Neuroscience. 1991;40:657–671. doi: 10.1016/0306-4522(91)90003-7. [DOI] [PubMed] [Google Scholar]
- Lidow MS, Goldman-Rakic PS, Rakic P, Innis RB. Dopamine D2 receptors in the cerebral cortex: distribution and pharmacological characterization with [3H]raclopride. Proc Natl Acad Sci U S A. 1989b;86:6412–6416. doi: 10.1073/pnas.86.16.6412. [DOI] [PMC free article] [PubMed] [Google Scholar]
- Liskowsky DR, Potter LT. D-2 dopamine receptors in the frontal cortex of rat and human. Life Sci. 1985;36:1551–1559. doi: 10.1016/0024-3205(85)90379-0. [DOI] [PubMed] [Google Scholar]
- Luthi-Carter R, Hodges A, Strand A, Aragaki A, Sengstag T, Hughes G, Regulier E, Zala G, Hollingsworth Z, Synek B, Aebischer P, Young AB, Wexler N, Delorenzi M, Deglon N, Kooperberg C, Augood SJ, Faull RLM, Olson J, Jones L. Gene expression changes in human Huntington’s disease brain: regional specificity and evidence for cell autonomous polyglutamine toxicity. Proceedings of the Society for Neuroscience; Washington, DC. 2005. Program No. 89.13, 2005 Abstract Viewer/Itinerary Planner., pp. [Google Scholar]
- Makuch R, Baratta J, Karaelias LD, Lauterborn JC, Gall CM, Yu J, Robertson RT. Arrival of afferents and the differentiation of target neurons: studies of developing cholinergic projections to the dentate gyrus. Neuroscience. 2001;104:81–91. doi: 10.1016/s0306-4522(01)00067-7. [DOI] [PubMed] [Google Scholar]
- Mash DC, White WF, Mesulam MM. Distribution of muscarinic receptor subtypes within architectonic subregions of the primate cerebral cortex. J Comp Neurol. 1988;278:265–274. doi: 10.1002/cne.902780209. [DOI] [PubMed] [Google Scholar]
- Mechawar N, Descarries L. The cholinergic innervation develops early and rapidly in the rat cerebral cortex: a quantitative immunocytochemical study. Neuroscience. 2001;108:555–567. doi: 10.1016/s0306-4522(01)00389-x. [DOI] [PubMed] [Google Scholar]
- Mirnics K, Middleton FA, Stanwood GD, Lewis DA, Levitt P. Disease-specific changes in regulator of G-protein signaling 4 (RGS4) expression in schizophrenia. Mol Psychiatry. 2001;6:293–301. doi: 10.1038/sj.mp.4000866. [DOI] [PubMed] [Google Scholar]
- Morris DW, Rodgers A, McGhee KA, Schwaiger S, Scully P, Quinn J, Meagher D, Waddington JL, Gill M, Corvin AP. Confirming RGS4 as a susceptibility gene for schizophrenia. Am J Med Genet B Neuropsychiatr Genet. 2004;125:50–53. doi: 10.1002/ajmg.b.20109. [DOI] [PubMed] [Google Scholar]
- Nakada Y, Parab P, Simmons A, Omer-Abdalla A, Johnson JE. Separable enhancer sequences regulate the expression of the neural bHLH transcription factor neurogenin 1. Dev Biol. 2004;271:479–487. doi: 10.1016/j.ydbio.2004.04.021. [DOI] [PubMed] [Google Scholar]
- Ni YG, Gold SJ, Iredale PA, Terwilliger RZ, Duman RS, Nestler EJ. Region-specific regulation of RGS4 (Regulator of G-protein-signaling protein type 4) in brain by stress and glucocorticoids: in vivo and in vitro studies. J Neurosci. 1999;19:3674–3680. doi: 10.1523/JNEUROSCI.19-10-03674.1999. [DOI] [PMC free article] [PubMed] [Google Scholar]
- Nomoto S, Adachi K, Yang LX, Hirata Y, Muraguchi S, Kiuchi K. Distribution of RGS4 mRNA in mouse brain shown by in situ hybridization. Biochem Biophys Res Commun. 1997;241:281–287. doi: 10.1006/bbrc.1997.7802. [DOI] [PubMed] [Google Scholar]
- Ongali B, Ase AR, Hebert C, Amdiss F, Reader TA. Dopamine D(1) and D(2) receptors in the forebrain of dystonia musculorum mutant mice: an autoradiographic survey in relation to dopamine contents. Synapse. 2000;37:1–15. doi: 10.1002/(SICI)1098-2396(200007)37:1<1::AID-SYN1>3.0.CO;2-9. [DOI] [PubMed] [Google Scholar]
- Paxinos G, Franklin K. The mouse brain in stereotaxic coordinates. Academic Press; San Diego: 2001. [Google Scholar]
- Pazos A, Cortes R, Palacios JM. Quantitative autoradiographic mapping of serotonin receptors in the rat brain. II Serotonin-2 receptors Brain Res. 1985;346:231–249. doi: 10.1016/0006-8993(85)90857-1. [DOI] [PubMed] [Google Scholar]
- Pazos A, Palacios JM. Quantitative autoradiographic mapping of serotonin receptors in the rat brain. I Serotonin-1 receptors Brain Res. 1985;346:205–230. doi: 10.1016/0006-8993(85)90856-x. [DOI] [PubMed] [Google Scholar]
- Pazos A, Probst A, Palacios JM. Serotonin receptors in the human brain--III. Autoradiographic mapping of serotonin-1 receptors. Neuroscience. 1987a;21:97–122. doi: 10.1016/0306-4522(87)90326-5. [DOI] [PubMed] [Google Scholar]
- Pazos A, Probst A, Palacios JM. Serotonin receptors in the human brain--IV. Autoradiographic mapping of serotonin-2 receptors. Neuroscience. 1987b;21:123–139. doi: 10.1016/0306-4522(87)90327-7. [DOI] [PubMed] [Google Scholar]
- Piggott M, Owens J, O’Brien J, Paling S, Wyper D, Fenwick J, Johnson M, Perry R, Perry E. Comparative distribution of binding of the muscarinic receptor ligands pirenzepine, AF-DX 384, (R,R)-I-QNB and (R,S)-I-QNB to human brain. J Chem Neuroanat. 2002;24:211–223. doi: 10.1016/s0891-0618(02)00066-2. [DOI] [PubMed] [Google Scholar]
- Prasad KM, Chowdari KV, Nimgaonkar VL, Talkowski ME, Lewis DA, Keshavan MS. Genetic polymorphisms of the RGS4 and dorsolateral prefrontal cortex morphometry among first episode schizophrenia patients. Mol Psychiatry. 2005;10:213–219. doi: 10.1038/sj.mp.4001562. [DOI] [PubMed] [Google Scholar]
- Roth BL, Hamblin MW, Ciaranello RD. Developmental regulation of 5-HT2 and 5-HT1c mRNA and receptor levels. Brain Res Dev Brain Res. 1991;58:51–58. doi: 10.1016/0165-3806(91)90236-c. [DOI] [PubMed] [Google Scholar]
- Shearman LP, Zeitzer J, Weaver DR. Widespread expression of functional D1-dopamine receptors in fetal rat brain. Brain Res Dev Brain Res. 1997;102:105–115. doi: 10.1016/s0165-3806(97)00091-6. [DOI] [PubMed] [Google Scholar]
- Taymans JM, Kia HK, Claes R, Cruz C, Leysen J, Langlois X. Dopamine receptor-mediated regulation of RGS2 and RGS4 mRNA differentially depends on ascending dopamine projections and time. Eur J Neurosci. 2004;19:2249–2260. doi: 10.1111/j.0953-816X.2004.03336.x. [DOI] [PubMed] [Google Scholar]
- Taymans JM, Leysen JE, Langlois X. Striatal gene expression of RGS2 and RGS4 is specifically mediated by dopamine D1 and D2 receptors: clues for RGS2 and RGS4 functions. J Neurochem. 2003;84:1118–1127. doi: 10.1046/j.1471-4159.2003.01610.x. [DOI] [PubMed] [Google Scholar]
- Tien LT, Fan LW, Sogawa C, Ma T, Loh HH, Ho IK. Changes in acetylcholinesterase activity and muscarinic receptor bindings in mu-opioid receptor knockout mice. Brain Res Mol Brain Res. 2004;126:38–44. doi: 10.1016/j.molbrainres.2004.03.011. [DOI] [PMC free article] [PubMed] [Google Scholar]
- Vassilatis DK, Hohmann JG, Zeng H, Li F, Ranchalis JE, Mortrud MT, Brown A, Rodriguez SS, Weller JR, Wright AC, Bergmann JE, Gaitanaris GA. The G protein-coupled receptor repertoires of human and mouse. Proc Natl Acad Sci U S A. 2003;100:4903–4908. doi: 10.1073/pnas.0230374100. [DOI] [PMC free article] [PubMed] [Google Scholar]
- Weiner DM, Levey AI, Sunahara RK, Niznik HB, O’Dowd BF, Seeman P, Brann MR. D1 and D2 dopamine receptor mRNA in rat brain. Proc Natl Acad Sci U S A. 1991;88:1859–1863. doi: 10.1073/pnas.88.5.1859. [DOI] [PMC free article] [PubMed] [Google Scholar]
- Williams BP, Milligan CJ, Street M, Hornby FM, Deuchars J, Buckley NJ. Transcription of the M1 muscarinic receptor gene in neurons and neuronal progenitors of the embryonic rat forebrain. J Neurochem. 2004a;88:70–77. doi: 10.1111/j.1471-4159.2004.02117.x. [DOI] [PubMed] [Google Scholar]
- Williams NM, Preece A, Spurlock G, Norton N, Williams HJ, McCreadie RG, Buckland P, Sharkey V, Chowdari KV, Zammit S, Nimgaonkar V, Kirov G, Owen MJ, O’Donovan MC. Support for RGS4 as a susceptibility gene for schizophrenia. Biol Psychiatry. 2004b;55:192–195. doi: 10.1016/j.biopsych.2003.11.002. [DOI] [PubMed] [Google Scholar]
- Xu X, Zeng W, Popov S, Berman DM, Davignon I, Yu K, Yowe D, Offermanns S, Muallem S, Wilkie TM. RGS proteins determine signaling specificity of Gq-coupled receptors. J Biol Chem. 1999;274:3549–3556. doi: 10.1074/jbc.274.6.3549. [DOI] [PubMed] [Google Scholar]