Abstract
The Protein Folding Database (PFD) is a publicly accessible repository of thermodynamic and kinetic protein folding data. Here we describe the first major revision of this work, featuring extensive restructuring that conforms to standards set out by the recently formed International Foldeomics Consortium. The database now adopts standards for data acquisition, analysis and reporting proposed by the consortium, which will facilitate the comparison of folding rates, energies and structure across diverse sets of proteins. Data can now be easily deposited using a rich set of deposition tools. Enhanced search tools allow sophisticated searching and graphical data analysis affords simple data analysis online. PFD can be accessed freely at http://www.foldeomics.org/pfd/.
INTRODUCTION
The Protein Folding Database (PFD) is a relational database that collects thermodynamic and kinetic data for the folding of proteins into a searchable, structured repository (1). The aims of the initial release in 2004 were 2-fold. First, to fulfill the need for an archive of folding data that was not being met by standard methods of publication. Providing a freely accessible, centralized data repository was the key task in this effort. Second, to allow rudimentary data analysis such as the investigation of the relationship between protein structure and folding characteristics [e.g. the relationship between topology and folding rate (2,3)].
Recently, Maxwell et al. (4) outlined a comprehensive strategy for the standardization of data reporting, acquisition and analysis, and as a result the International Foldeomics Consortium was formed. This is a multidisciplinary alliance of >35 researchers, spanning eight countries, with the aim of initiating the collection, validation and analysis of protein folding data on a global basis. A main goal of these efforts is to set uniform standards for the experimental community and to initiate a self-consistent dataset that will aid ongoing efforts to understand the folding process. There is significant interest in using empirical and theoretical relationships to predict the rates at which proteins fold (5–9), but this is non-trivial due to a variety of difficulties associated with the comparison of folding rates, energies and structures across diverse sets of proteins (4). Such comparative studies are onerous due to several factors; the large variability in experimental conditions and methodology; uncertainty of the structural details of the characterized protein; no standard method of data analysis, error estimation, or reporting; and no standard units. In order to address these limitations, we rebuilt the PFD such that it conforms to the proposals set out in Maxwell et al. (4).
RESTRUCTURING AND NEW FEATURES
Database structure
A main aim of the database is to allow the investigation of the empirical and theoretical relationships between folding rates and structural characteristics of a protein, such as topology. Therefore new tables were added to the database in order to capture information such as construct length, sequence, expression tags, disordered regions and the PDB identifier. Additional tables also allow the deposition of raw kinetic data (see below), and errors for all numerical data are now recorded.
Data deposition and validation
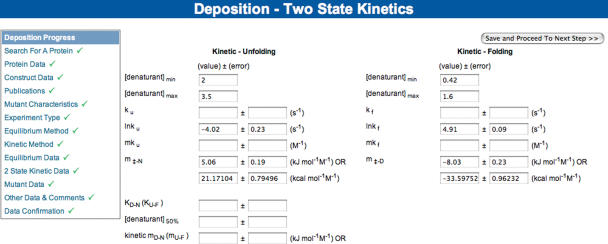
We have built a set of deposition tools that allow a registered user to deposit their folding data (Figure 1). This is achieved using a forms-based system via a web-browser. In order to expedite this process and remove redundancy new depositions can be based upon existing entries, and the process may be paused and resumed at a later date, without losing data. The data deposition process is structured into several logical sections and the user is guided carefully through the process. Once data are deposited, an annotator is automatically alerted by email, who then performs editing and further annotation using a similar set of web forms. Once this process is complete the entry is made available on the website.
Figure 1.
A typical data deposition form, here showing kinetic data. User progress is shown on the left-hand side, which can be used to navigate back and forth through the complete deposition process, in order to check the data before submission.
The deposition form is divided into several logical sections: Protein, Construct, Publication, Mutations, Equilibrium Method, Kinetic Method, Equilibrium Data, Kinetic Data and Other Data and Comments. Depending on the format of data required, the form provides a mixture of text or number entry boxes and drop-down menus, often with the capacity to add new details if none of the existing options are applicable. In addition to allowing deposition of a complete set of equilibrium and kinetics folding data (e.g. kinetic rates of folding and unfolding, equilibrium free energies), particular emphasis is placed on recording experimental details and methods [e.g. spectroscopic technique (probe), method of perturbation (e.g. denaturant), instrument details, temperature, pH, buffers and additives]. Where possible some data fields are derived automatically in the web form, e.g. molecular weight from sequence, kcal–kJ unit conversion and folding rate from ln(folding rate). Relevant links to other knowledge databases such as the UniProt (10), SCOP (11) and NCBI PubMed databases are also established through the data entry form. In addition to specified details, fields are provided for supplementary notes that may be useful to other users.
Mutant datasets
The deposition of mutant data are considerably more challenging because it often involves large datasets for several mutants, and the ability to deposit these data in one step is clearly important. To achieve this we have developed an EXCEL spreadsheet that also serves to calculate derived equilibrium and kinetic values. For example, this allows the deposition of values such as the logs of folding rates, ‘m’ values, ΔG and ΔΔG values, βT and Φ values. This spreadsheet is therefore useful in its own right, and is freely available for download.
Raw data
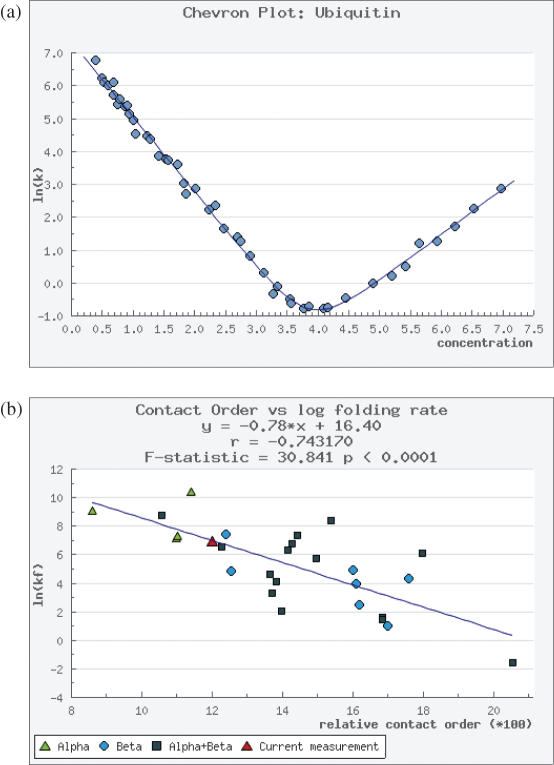
Much of the folding data reported in publications is derived from raw data, which goes unpublished. Such raw, unanalyzed data are often useful at a later date when more advanced tools become available, or in the light of new methods. A particularly good example is the Chevron plot [ln (kobs) versus denaturant concentration]. In cases where the arms of the chevron plot are linear, a simple linear fit can be used to estimate rate constants in the absence of denaturant (12). However, there are many examples of where the presence of intermediates or aggregation results in non-linear chevron plots (so called ‘kinetic-rollover’). Since there are several approaches to fitting these data, and new approaches may be developed in the future, making available the raw kinetic data will allow future researchers to refit the data using different models. Similarly, capturing the raw equilibrium data (e.g. spectroscopic signal versus denaturant concentration) is also important. As such we allow raw chevron and equilibrium data to be deposited in the database, again using an EXCEL spreadsheet format. Once deposited and validated, both datasets can be visualized graphically (see below).
Data visualization
Raw equilibrium and chevron data can be visualized graphically (Figure 2A). Accordingly we have developed data fitting algorithms using the open source statistics package ‘R’ (www.r-project.org) which fits the data graphically, and provides estimates of folding and unfolding rates and associated errors (Figure 2A). We have also developed graphical means of visualizing relationships between structural parameters, such as contact order and folding rates (2). This graphical representation of data are displayed automatically and elements of the graph are hyperlinked directly to the data such that a mouse-click on a data point will retrieve the data in the standard text format. We currently supply contact order plots (Figure 2B), and further work is planned allowing the graphical visualization of relationships between structural and folding characteristics of wild type and mutant proteins.
Figure 2.
(A) Raw data, such as ln(kobs) versus denaturant concentration can be deposited and automatically plotted (the chevron plot is shown) and (B) the contact order plot shown here is automatically calculated from the database contents. Each data point represents a protein, and can be selected directly from the plot.
Advanced searching and reporting
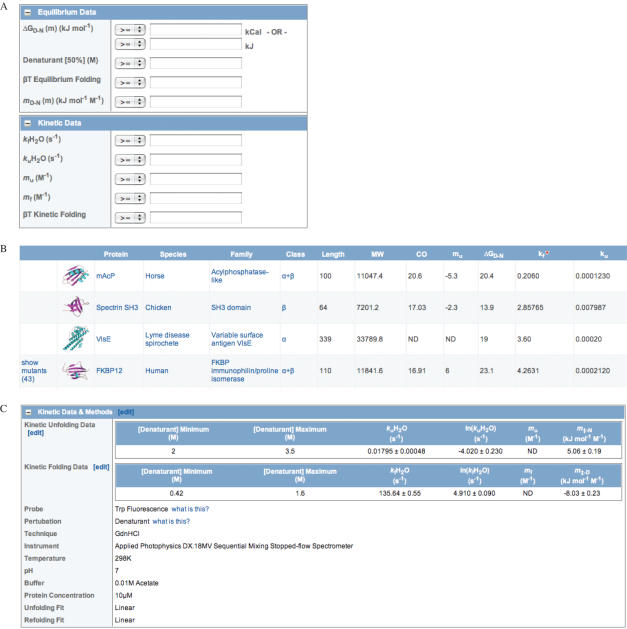
For most purposes the search box can be used to search by obvious parameters such as protein name. However, more stringent searching can be performed using the advanced search feature (Figure 3A). The database can be queried by numerous parameters. These include text searches of protein names, and literature references, searches of experimental details, and searches of construct and structure type. More complex mathematical searches can be made on a wide range of protein descriptive and folding characteristics. In this way proteins may be retrieved on the basis of length, folding intermediates, folding rates, and various derived terms such as Φ or βT values. Search results are presented in a tabular fashion (Figure 3B), and various data types can be selected for display and can be sorted on any heading (this proves useful for fast visualization of trends). Individual records are structured logically in sections as in data deposition (Figure 3C).
Figure 3.
(A) Advanced searching, e.g. by kinetic and equilibrium data; (B) typical results of a search, shown here sorted by folding rate. This is a summarized table, containing most of the important folding data and (C) part of a full folding entry.
METHODS
PFD was created using open-source MySQL relational database server software (version 4.1.18; www.mysql.com), Apache web server (version 1.3.33; www.apache.org), running on an Apple Dual 2.0 GHz G5/OS X Server (version 10.4.7). The database consists of 38 tables. All web-based forms and query interfaces to the database were created using a multi-tier web site written in PHP (version 5.1.2; www.php.net) and PEAR database abstraction classes. Numerical fitting was done using the open source statistics package ‘R’ (version 2.2.01; http://www.r-project.org), and the algorithms used for chevron and equilibrium fitting are available on the web site.
AVAILABILITY AND SUBMISSIONS
PFD is freely available at http://www.foldeomics.org/pfd/. Enquiries should be emailed to Ashley.Buckle@med.monash.edu.au
CONCLUSIONS AND FUTURE EXTENSIONS
The PFD has been rebuilt according to the guidelines set out by the International Foldeomics Consortium. New deposition tools will encourage growth of the database, and novel means of representing the data graphically will enhance its use in the field of protein science. Future work will focus predominantly on the development of further graphical representations of the folding data. This will be extended as much as possible such that the database is not just a data archive, but becomes a powerful analytical tool in folding research.
Acknowledgments
We would like to thank Robert Tipping, Daniel Brain, John Derrick and Ben Brumm for initial programming assistance and database design. We would like to thank Abdullah A. Amin and James C. Whisstock for computing support and advice. This work was funded by an Australian Research Council eResearch SRI grant. K.F.F. is an NHMRC Peter Doherty Fellow. A.M.B. is an NHMRC Senior Research Fellow. Funding to pay the Open Access publication charges for this article was provided by the Australian Research Council.
Conflict of interest statement. None declared.
REFERENCES
- 1.Fulton K.F., Devlin G.L., Jodun R.A., Silvestri L, Bottomley S.P., Fersht A.R., Buckle A.M. PFD: a database for the investigation of protein folding kinetics and stability. Nucleic Acids Res. 2005;33:D279–D283. doi: 10.1093/nar/gki016. [DOI] [PMC free article] [PubMed] [Google Scholar]
- 2.Plaxco K.W., Simons K.T., Baker D. Contact order, transition state placement and the refolding rates of single domain proteins. J. Mol. Biol. 1998;277:985–994. doi: 10.1006/jmbi.1998.1645. [DOI] [PubMed] [Google Scholar]
- 3.Plaxco K.W., Simons K.T., Ruczinski I., Baker D. Topology, stability, sequence, and length: defining the determinants of two-state protein folding kinetics. Biochemistry. 2000;39:11177–11183. doi: 10.1021/bi000200n. [DOI] [PubMed] [Google Scholar]
- 4.Maxwell K.L., Wildes D., Zarrine-Afsar A., De Los Rios M.A., Brown A.G., Friel C.T., Hedberg L., Horng J.C., Bona D., Miller E.J., et al. Protein folding: defining a ‘standard’ set of experimental conditions and a preliminary kinetic data set of two-state proteins. Protein Sci. 2005;14:602–616. doi: 10.1110/ps.041205405. [DOI] [PMC free article] [PubMed] [Google Scholar]
- 5.Ejtehadi M.R., Avall S.P., Plotkin S.S. Three-body interactions improve the prediction of rate and mechanism in protein folding models. Proc. Natl Acad. Sci. USA. 2004;101:15088–15093. doi: 10.1073/pnas.0403486101. [DOI] [PMC free article] [PubMed] [Google Scholar]
- 6.Gromiha M.M., Thangakani A.M., Selvaraj S. FOLD-RATE: prediction of protein folding rates from amino acid sequence. Nucleic Acids Res. 2006;34:W70–W74. doi: 10.1093/nar/gkl043. [DOI] [PMC free article] [PubMed] [Google Scholar]
- 7.Ma B.G., Guo J.X., Zhang H.Y. Direct correlation between proteins’ folding rates and their amino acid compositions: An ab initio folding rate prediction. Proteins. 2006;65:362–372. doi: 10.1002/prot.21140. [DOI] [PubMed] [Google Scholar]
- 8.Zhang L., Sun T. Folding rate prediction using n-order contact distance for proteins with two- and three-state folding kinetics. Biophys. Chem. 2005;113:9–16. doi: 10.1016/j.bpc.2004.07.036. [DOI] [PubMed] [Google Scholar]
- 9.Zhou H., Zhou Y. Folding rate prediction using total contact distance. Biophys. J. 2002;82:458–463. doi: 10.1016/S0006-3495(02)75410-6. [DOI] [PMC free article] [PubMed] [Google Scholar]
- 10.Wu C.H., Apweiler R., Bairoch A., Natale D.A., Barker W.C., Boeckmann B., Ferro S., Gasteiger E., Huang H., Lopez R., et al. The Universal Protein Resource (UniProt): an expanding universe of protein information. Nucleic Acids Res. 2006;34:D187–D191. doi: 10.1093/nar/gkj161. [DOI] [PMC free article] [PubMed] [Google Scholar]
- 11.Andreeva A., Howorth D., Brenner S.E., Hubbard T.J., Chothia C., Murzin A.G. SCOP database in 2004: refinements integrate structure and sequence family data. Nucleic Acids Res. 2004;32:D226–D229. doi: 10.1093/nar/gkh039. [DOI] [PMC free article] [PubMed] [Google Scholar]
- 12.Fersht A. Structure and Mechanism in Protein Science: A guide to Enzyme Catalysis and Protein Folding. New York: W. H. Freeman and Co.; 1999. [Google Scholar]


