Abstract
The Mouse Phenome Database (MPD; http://www.jax.org/phenome) is a repository of phenotypic and genotypic data on commonly used and genetically diverse inbred strains of mice. Strain characteristics data are contributed by members of the scientific community. Electronic access to centralized strain data enables biomedical researchers to choose appropriate strains for many systems-based research applications, including physiological studies, drug and toxicology testing and modeling disease processes. MPD provides a community data repository and a platform for data analysis and in silico hypothesis testing. The laboratory mouse is a premier genetic model for understanding human biology and pathology; MPD facilitates research that uses the mouse to identify and determine the function of genes participating in normal and disease pathways.
INTRODUCTION
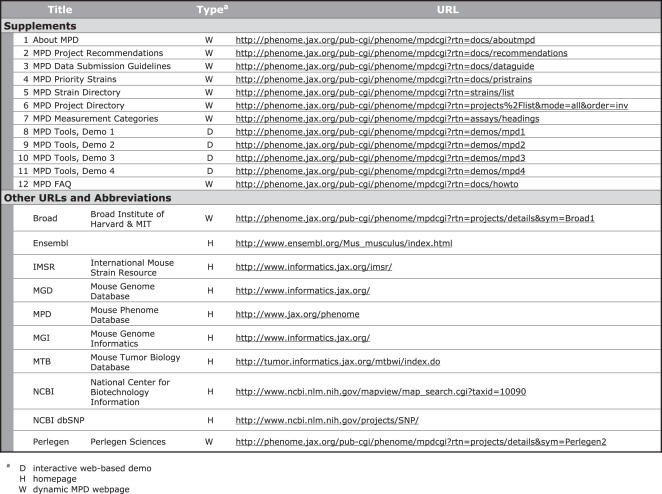
Refer to Table 1 for a list of Supplements, URLs and abbreviations.
Table 1.
Supplements, URLs, and Abbreviations
There are many challenges to using the laboratory mouse for identifying genes underlying complex human diseases. The past several years have seen major advancements essential to achieving this goal: reliable genomic sequence is available from multiple strains and extraordinary efforts are underway to annotate these data; genotyping methods are more inexpensive and scalable; large-scale phenotype characterization projects are supported through more substantial funding mechanisms; and significant groundwork has been laid for the development of research resources and community databases to accommodate large quantities of data generated from these efforts. Now the focus is turning to an even bigger challenge—linking genotype and phenotype through computational methods that minimize the expense and long timeframes associated with traditional genetic approaches to complex trait analysis.
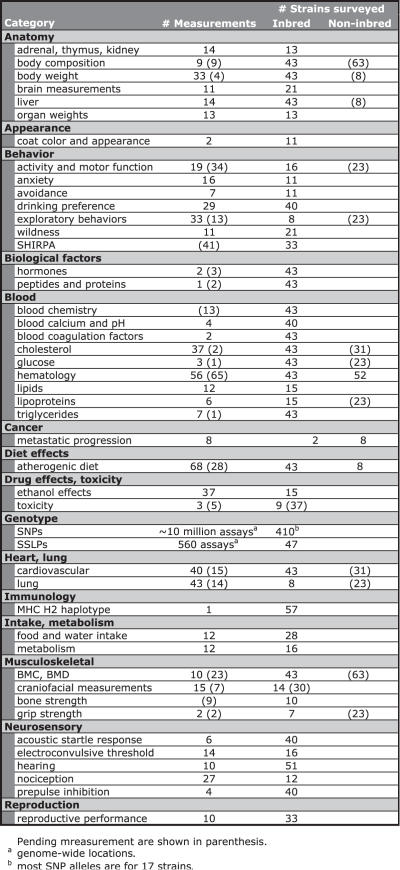
The Mouse Phenome Project was launched as an international collaboration to complement the mouse genome sequencing effort. One of the major goals of the project is to collect phenotypic data generated under standardized conditions on a defined set of genetically diverse inbred strains of mice and to make the data available in a central, web-accessible database (1). The Mouse Phenome Database (MPD; http://www.jax.org/phenome), housed at The Jackson Laboratory, is a data repository and facility for query, data retrieval and analysis (2). Directories of MPD content are accessible through the MPD homepage (see also Table 2). MPD contains diverse data types from many sources which are organized into a standard framework conducive to efficient processing and data sharing. The data structures are flexible and accommodate genomic and biological annotations and are scalable for managing large quantities of data from different biological levels (molecular, cellular, organ-system and whole-animal). MPD is linked to other biological databases such as MGD (3), NCBI dbSNP (4) and Ensembl (5). Additional information about MPD can be found in Supplementary Data 1.
Table 2.
MPD Directories
The Mouse Phenome Project takes advantage of the natural genetic variation and phenotypic diversity of inbred strains of mice. Inbred strains have distinct, fixed genotypes and are effectively homozygous at every location. High-quality phenotypic data from 30 to 40 sufficiently genotyped strains will facilitate efforts to map function to the genome. To standardize testing across laboratories and over time, the project promotes and facilitates phenotyping and genotyping projects following a set of recommendations proposed by members of the research community (Supplementary Data 2). Strains are systematically characterized under controlled conditions by experts in their fields who typically are funded through peer-reviewed mechanisms. Per-animal data are collected, curated and deposited in MPD. (Data submission guidelines are posted on the MPD website, Supplementary Data 3.)
The Mouse Phenome Project focuses on a large set of phenotypically diverse inbred mouse strains. These so-called Priority Strains are carefully chosen by the research community and are periodically reviewed and updated depending on community input and research trends. The Priority Strain list is maintained and kept current on the MPD website (Supplementary Data 4). As data are collected, phenotype and genotype data are indexed for each strain and made available through a strain's directory page. The directory contains links to other databases, such as IMSR (6) and MTB (7) (see URLs and abbreviations in Table 1). Directories for individual strains can be accessed through strain name hyperlinks (on MPD web pages) and through the full listing of strains accessed from the MPD homepage (Supplementary Data 5).
PROJECTS, MEASUREMENTS AND CATEGORIES
We use the term ‘project’ to refer to a dataset submitted by an investigator along with all its associated documentation (detailed protocols and environmental conditions of test animals). A project contains a set of measurements that have been captured under controlled conditions using defined protocols. A project includes tabular per-animal data that can be downloaded in flat file or Excel format. Summary statistics are computed from per-animal data and are stored as part of the project. Projects are issued accession numbers (e.g. MPD: 99) and are identified by a mnemonic based on the principal investigator's name such as ‘Smith1’. The project directory is accessible from the MPD homepage (Supplementary Data 6).
A ‘measurement’ refers to a collection of data points gathered: (i) as part of a particular project, (ii) according to a specific detailed protocol and (iii) under identical experimental conditions. Data are collected on multiple strains (survey format), where there are sufficient numbers of individual mice for statistical significance (10 per strain for each sex are recommended). A measurement has a short name, description, units designator and supplemental information (e.g. age of animals at testing, treatment regimen or phenotyping platform). An example of a measurement and its annotations follows:
| MPD meas accession number | MPD:9901 (for this example, MPD: 99 is the project's accession number) |
| Short name | BP |
| Description | systolic blood pressure (Hg pressure) |
| Units | mm |
| Project symbol | Smith1 |
| Supplemental | Age: 9–10 weeks; 1% NaCl in drinking water; non-invasive tail-cuff method |
| Category | Cardiovascular |
| Subcategory | Blood pressure, sodium intake. |
Measurements are catalogued by project and category. ‘Measurement categories’ are collections of measurements that are relevant to one physiological, anatomical or behavioral area. Standardized vocabularies and ontologies [Mammalian Phenotype (MP), Gene Ontology (GO) and Unified Medical Language System (UMLS)] are used as sources for annotation terms. Measurement categories are accessed through the MPD homepage (Supplementary Data 7). Measurements within a category are often supplied by multiple unaffiliated projects and may involve a variety of methods, protocols, animal ages and other differences. This information is specified in measurement annotations and should be taken into account when using MPD data.
MPD CONTENTS
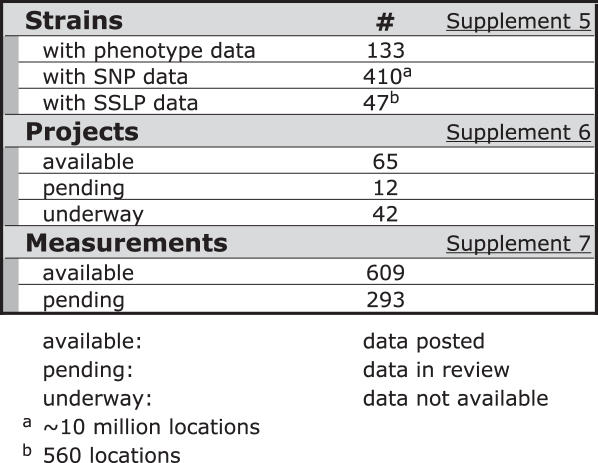
Table 3 shows a snapshot of MPD content, including pending datasets currently under various stages of review. Data for a wide range of parameters are annotated and stored in MPD along with submitter's contact information, detailed protocols and environmental parameters. Currently MPD contains more than 900 phenotypic measurements (including pending data); most are relevant to human health and disease, including atherosclerosis, blood disorders, cancer susceptibility, infectious disease susceptibility, neurological and behavioral disorders, sensory function defects, gallstone susceptibility, pulmonary responsiveness, hypertension, osteoporosis and obesity. New data pertaining to these and other disease areas will be incorporated as it becomes available.
Table 3.
MPD Current Contents (Aug 2006)
MPD also contains extensive genotypic data, including a large set of SNPs for ∼10 million genome-wide locations consolidated from large-scale genotyping consortia. The most recent collection includes the NIEHS-Perlegen SNPs for 16 inbred strains (this includes C57BL/6J reference data) and the Broad SNPs for 49 inbred strains. (These two datasets alone have allele calls for 8+ million and 138+ thousand genome-wide locations, respectively.) Parallel gene feature and function annotations are merged from NCBI, dbSNP and Ensembl, and each SNP location links to MGI's Mouse Gbrowse and dbSNP (see URLs and abbreviations in Table 1).
MPD FEATURES, TOOLS AND DISPLAYS
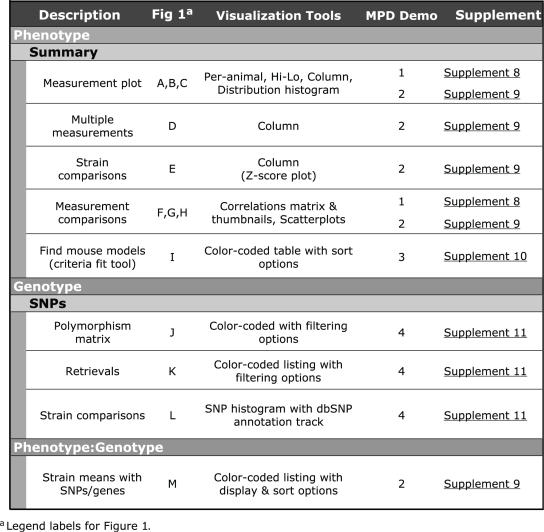
In addition to providing downloads of phenotype and genotype data, MPD provides a number of analysis tools to support exploratory data analysis and discovery. The ability to choose strains for a specific experiment by accessing and analyzing existing phenotype data can bypass the need for investigators to invest time and resources (re)characterizing strains. This functionality, in turn, accelerates research and leverages existing community resources. To assist researchers in data analysis, summary statistics are computed from submitted per-animal data and are available in tabular format. Tools are provided for visualizing measurement data, comparing strains and correlating measurements across all submitted datasets. Researchers can also use MPD to create customized datasets of phenotype measurements. Table 4 contains a description of selected MPD tools with reference to thumbnail views shown in Figure 1. Four demos have been prepared to illustrate these tools and other MPD features and displays (Supplementary Data 8–11, indexed in Table 4).
Table 4.
MPD Tools and Displays
Figure 1.

MPD displays and graphics from selected tools. Thumbnail images illustrate a variety of MPD visualization and analysis tools. The key for A through M is shown in Table 4. Learn more about these tools and graphic output options in MPD Demos 1–4 (Supplementary Data 8–11, Table 1).
In addition to the standard statistical analysis tools, MPD provides a number of more advanced user tools. Find Mouse Models, a powerful criteria-fit tool, enables the identification of those strains best matching a set of user-defined criteria [Figure 1 (I), Table 4]. Using the best mouse model for a particular research application helps optimize phenotype-driven approaches to functionally define the genome. Figure 2 illustrates the power of the Find Mouse Models tool (see more details in MPD Demo 3, Supplementary Data 10). This tool aids in finding mouse strains with certain traits or complex phenotypes, and further, it helps choose control strains for specific applications. As the power of this tool is data-dependent (quantity and quality), data representing other medically relevant phenotypic domains and data from additional levels of comprehensive phenotyping are needed to identify new, possibly improved, mouse models that more accurately emulate human disease.
Figure 2.
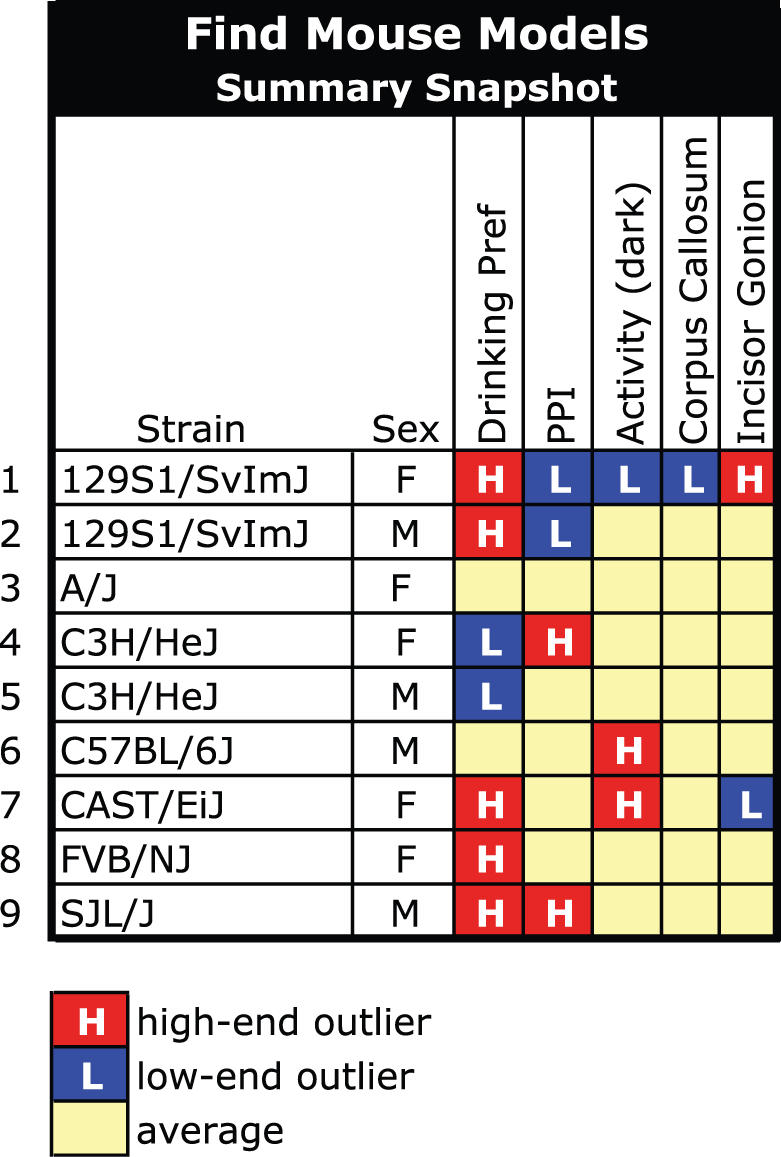
Find mouse models—criteria fit tool. This tool helps identify strains best matching user-specified criteria. Users choose measurements of interest and specify criteria for each. A search is issued across the entire MPD and the strains giving the best fit are returned in a results table of statistical information, ranked by an overall best fit score. We provide an example to illustrate the power of this tool (see Supplementary Data 10 for more details). The data in our example are real and are available in MPD. The syndrome in our example is hypothetical. This figure is not an MPD display but is used to summarize our findings. For example, a new syndrome has been identified that involves several independent complex traits. The syndrome is most severe in females exhibiting a higher than average drinking preference for NaCl, a lower than average prepulse inhibition (PPI), lower than average activity levels, a smaller than average corpus callosum, and a greater than average distance between the mandible infradentale and gonion. Less severe cases of this syndrome are observed where only some of the syndrome traits are expressed. For this example, we have to identify the best mouse model for studying this syndrome and its prevention, diagnosis and treatment. First, we choose MPD measurements that quantify the five traits of interest. These measurements are gathered from five different projects that tested overlapping strain sets. We then apply our criteria to each measurement and issue a search across the entire MPD. The returned results are in tabular form and rank strains in order of best match. For this particular example, we find 129S1/SvImJ females are the only strain (by sex) that meet all criteria. To find other strains that may exhibit milder forms of the syndrome, we highlight high- and low-end ouliers in our online results table to help quickly identify strains with unique complex phenotypes across the five traits [illustrated in Figure 1(I)]. Supplementary Data 10 shows the MPD results table for this query. The illustration in our figure here simplifies the results: there are nine distinct genotypes (strain/sex) which exhibit nine distinct complex phenotypes. 129S1/SvImJ females are an excellent match for modeling this syndrome. The other eight genotypes may exhibit milder forms of the syndrome, or none at all. These strains represent diversity in the population and would, for example, be excellent to include in drug studies to identify particular genotypes that react adversely to a test drug, or not at all.
An important goal of the Mouse Phenome Project is to provide online tools to help researchers link genotype and phenotype. MPD recently updated a data display whereby phenotypic data may be viewed alongside SNPs from specified genes or regions. This interactive tool, illustrated in Figure 1 (M) and MPD Demo 2 (Supplementary Data 9) is useful for a quick assessment of possible phenotype–genotype associations and for selecting strains harboring specific polymorphisms in candidate genes or regions of interest. Strains identified this way are valuable for hypothesis testing, candidate gene validation and follow-on research. More sophisticated tools for in silico haplotype association mapping will be developed when a consensus is determined regarding the most effective algorithms to accurately associate genotype and phenotype.
Additional information about MPD tools and features can be found in the FAQ (Supplementary Data 12).
SIGNIFICANCE AND USAGE
Research groups are demonstrating powerful in silico methods of correlating phenotypes and genotypes—the ultimate aim being to identify genes or regulatory regions contributing to complex traits [e.g. see (8–15)]. These studies demonstrate the power of the phenomic approach, which captures complexities of entire pathways simply not accessible through conventional approaches, thus underscoring the utility and potential of MPD. The importance of the MPD to the research community is demonstrated by the steady increase in its use.
COLLABORATIONS
The Mouse Phenome Project seeks to establish new collaborations representing a wide variety of phenotypic domains. The NIH and other funding agencies support experts in their fields of study both for primary phenotyping and for more in-depth, domain-specific characterization. Toxicogenomics, pharmacogenomics and comparative genomic hybridization approaches are producing powerful datasets. Investigators are using new technologies for detailed characterization of behavioral phenotypes, embryo morphology and drug efficacy. Several projects are underway to quantitatively define complex phenotypes for arthritis, cancer, infectious diseases, alcohol sensitivity, sleep disorders, epilepsy, aging, osteoporosis, metabolic syndrome, anxiety and other behavioral disorders.
COMMUNITY OUTREACH AND USER SUPPORT/FEEDBACK
MPD provides user support through online documentation and via email (phenome@jax.org). PHENOME-LIST is a moderated electronic bulletin board http://phenome.jax.org/phenome/list.html. We welcome user input and suggestions.
Researchers interested in contributing data to MPD or in collaborating on new phenotyping projects should contact us at phenome@jax.org. Data submission guidelines are accessible through the MPD homepage, Supplementary Data 3.
HIGH-LEVEL OVERVIEW
The MPD and software system was first released in 2001, and runs on a Solaris computing platform at The Jackson Laboratory data center. MPD implementation is an open source web-based system that includes integrated dynamic HTML page generation, data graphing and SQL database components. Graphical data presentation is used whenever possible. Investigator protocols and other supporting documentation are stored as HTML documents. Data accession and updates are performed centrally by MPD staff. A variety of Unix utilities and custom-written programs are used in this process.
Phenotypic data
Phenotypic data are assigned accession IDs by ‘measurement’ [e.g. per-animal data—from a red blood cell (RBC) count assay performed by Smith1 under a defined protocol and controlled conditions—are assigned to a unique measurement called RBC, which is accessioned as an entity]. Measurements are tabulated by strain and sex. Strain means, standard deviation and error, Z-scores, coefficient of variation and other statistics are computed which are then added to the database. For most MPD queries, the unit of analysis is a strain/sex/measurement (female and male mice are always analyzed separately). Incoming measurement values are correlated against all other measurement values in the database (each data point is a strain/sex mean) and all correlation coefficients are stored.
Genotypic data
SNP data are assembled by merging four sources:
allele tables from source laboratories or NCBI dbSNP,
genomic location and annotation information from dbSNP,
genomic annotation from the NCBI mouse genome assembly and
genomic annotation from Ensembl.
MPD does not retain flanking sequence or attempt to compute locations for SNPs; instead dbSNP is used as the authoritative source for genomic location. For this reason, dual submission to dbSNP is strongly encouraged so that ongoing genomic location and annotation can be maintained there. Source laboratories are also encouraged to submit allele tables directly to MPD for better efficiency in merging the data. Each source dataset is stored in a separate MPD table. This approach is necessary to efficiently handle the wildly divergent SNP volumes (anywhere from 28 genome-wide locations to 8.2+ million locations per dataset) and number of mouse strains assayed (95% of SNPs are for 17 strains but 400+ strains are present to a sparser degree); users can retrieve SNPs from all sources or a single source with equal performance.
Submitted datasets, computed summary statistics and database tables are freely downloadable as flat files. Access the MPD download center (http://www.jax.org/phenome/download.html).
Items of interest to developers
URL interface for linking to specific MPD database views (http://phenome.jax.org/pub-cgi/phenome/mpdcgi?rtn=docs/linktous); Database documentation/data model/schema (http://phenome.jax.org/pub-cgi/phenome/mpdcgi?rtn=datamodel/datamodel); and MPD SNP interface—developer notes and URL interface (http://phenome.jax.org/pub-cgi/phenome/mpdcgi?rtn=snps/help#developers).
CITING MPD
The following citation format is suggested when referring to datasets stored in MPD: Investigators. Project Title. MPDnnn accession number. MPD website, The Jackson Laboratory, Bar Harbor, Maine, USA (URL: http://www.jax.org/phenome, month and year of download). (Update logs are maintained for each project, so download dates are important.)
For general citation of the MPD, cite this article.
SUPPLEMENTARY DATA
Supplementary Data are available at NAR Online.
Acknowledgments
We thank Cynthia Smith and Debbie Krupke for reviewing this manuscript. We thank Mouse Phenome Project collaborators for participating and contributing data for worldwide access. The MPD is supported by The Jackson Laboratory and NIH HG003057, HL66611 and MH071984. MPD data are available through projects funded by the following 35 funding agencies and organizations. NIH, National Cancer Institute, National Eye Institute, National Heart, Lung, and Blood Institute, National Institute of Child Health & Human Development, National Institute on Deafness and other Communication Disorders, National Institute of Dental and Craniofacial Research, National Institute of Diabetes & Digestive & Kidney Diseases, National Institute of Environmental Health Sciences, National Institute of General Medical Sciences, National Institute of Mental Health, National Institute of Neurological Disorders and Stroke, National Institute on Alcohol Abuse and Alcoholism, National Institute on Drug Abuse, Andrew Mellon Foundation, AstraZeneca, Aventis, BD Biosciences, Bristol-Myers Squibb, Burroughs Wellcome Fund, Canadian Institutes for Health Research, Common wealth of Pennsylvania Health Research Formula Grant, Department of Defense, Department of Veterans Affairs, Fonds pour la Formation de Chercheurs et l'Aide a la Recherche of Quebec, Hoffmann-LaRoche, Howard Hughes Medical Institute, The Jackson Laboratory, Medical Research Council of Canada, Merck Genome Research Institute, Millennium Pharmaceuticals, National Science Foundation, Natural Sciences and Engineering Research Council of Canada, Novartis, Pfizer, Thyssen Stiftung and the Hebrew University Center for Research on Pain. Funding to pay the Open Access publication charges for this article was provided by HG003057.
Conflict of interest statement. None declared.
REFERENCES
- 1.Bogue M. Mouse Phenome Project: understanding human biology through mouse genetics and genomics. J. Appl. Physiol. 2003;95:1335–1337. doi: 10.1152/japplphysiol.00562.2003. [DOI] [PubMed] [Google Scholar]
- 2.Grubb S.C., Churchill G.A., Bogue M.A. A collaborative database of inbred mouse strain characteristics. Bioinformatics. 2004;20:2857–2859. doi: 10.1093/bioinformatics/bth299. [DOI] [PubMed] [Google Scholar]
- 3.Blake J.A., Eppig J.T., Bult C.J., Kadin J.A., Richardson J.E., the Mouse Genome Database Group The Mouse Genome Database (MGD): updates and enhancements. Nucleic Acids Res. 2006;34:D562–D567. doi: 10.1093/nar/gkj085. [DOI] [PMC free article] [PubMed] [Google Scholar]
- 4.Wheeler D.L., Barrett T., Benson D.A., Bryant S.H., Canese K., Chetvernin V., Church D.M., DiCuccio M., Edgar R., Federhen S., et al. Database resources of the National Center for Biotechnology Information. Nucleic Acids Res. 2006;34:D173–D180. doi: 10.1093/nar/gkj158. [DOI] [PMC free article] [PubMed] [Google Scholar]
- 5.Birney E., Andrews D., Caccamo M., Chen Y., Clarke L., Coates G., Cox T., Cunningham F., Curwen V., Cutts T., et al. Ensembl 2006. Nucleic Acids Res. 2006;34:D556–D561. doi: 10.1093/nar/gkj133. [DOI] [PMC free article] [PubMed] [Google Scholar]
- 6.Strivens M., Eppig J.T. Visualizing the laboratory mouse: capturing phenotype information. Genetica. 2004;122:89–97. doi: 10.1007/s10709-004-1435-7. [DOI] [PubMed] [Google Scholar]
- 7.Krupke D., Naf D., Vincent M., Allio T., Mikaelian I., Sundberg J., Bult C., Eppig J. The mouse tumor biology database: integrated access to mouse cancer biology data. Exp. Lung. Res. 2005;31:259–270. doi: 10.1080/01902140490495633. [DOI] [PubMed] [Google Scholar]
- 8.McClurg P., Pletcher M.T., Wiltshire T., Su A.I. Comparative analysis of haplotype association mapping algorithms. BMC Bioinformatics. 2006;7:61. doi: 10.1186/1471-2105-7-61. [DOI] [PMC free article] [PubMed] [Google Scholar]
- 9.Pletcher M.T., McClurg P., Batalov S., Su A.I., Barnes S.W., Lagler E., Korstanje R., Wang X., Nusskern D., Bogue M.A., et al. Use of a dense single nucleotide polymorphism map for in silico mapping in the mouse. PLoS Biol. 2004;2:e393. doi: 10.1371/journal.pbio.0020393. [DOI] [PMC free article] [PubMed] [Google Scholar]
- 10.Cervino A.C., Li G., Edwards S., Zhu J., Laurie C., Tokiwa G., Lum P.Y., Wang S., Castellini L.W., Lusis A.J., et al. Integrating QTL and high-density SNP analyses in mice to identify Insig2 as a susceptibility gene for plasma cholesterol levels. Genomics. 2005;86:505–517. doi: 10.1016/j.ygeno.2005.07.010. [DOI] [PubMed] [Google Scholar]
- 11.Cervino A.C., Darvasi A., Fallahi M., Mader C.C., Tsinoremas N.F. Genetics. 2006. An integrated in silico gene mapping strategy in inbred mice. [Epub ahead of print] [DOI] [PMC free article] [PubMed] [Google Scholar]
- 12.Hillebrandt S., Wasmuth H.E., Weiskirchen R., Hellerbrand C., Keppeler H., Werth A., Schirin-Sokhan R., Wilkens G., Geier A., Lorenzen J., et al. Complement factor 5 is a quantitative trait gene that modifies liver fibrogenesis in mice and humans. Nature Genet. 2005;37:835–843. doi: 10.1038/ng1599. [DOI] [PubMed] [Google Scholar]
- 13.DiPetrillo K., Wang X., Stylianou I.M., Paigen B. Bioinformatics toolbox for narrowing rodent quantitative trait loci. Trends Genet. 2005;21:683–692. doi: 10.1016/j.tig.2005.09.008. [DOI] [PubMed] [Google Scholar]
- 14.Fenske T.S., McMahon C., Edwin D., Jarvis J.C., Cheverud J.M., Minn M., Mathews V., Bogue M.A., Province M.A., McLeod H.L., et al. Identification of candidate alkylator-induced cancer susceptibility genes by whole genome scanning in mice. Cancer Res. 2006;66:5029–5038. doi: 10.1158/0008-5472.CAN-05-3404. [DOI] [PubMed] [Google Scholar]
- 15.Wang X., Ria M., Kelmenson P.M., Eriksson P., Higgins D.C., Samnegard A., Petros C., Rollins J., Bennet A.M., Wiman B., et al. Positional identification of TNFSF4, encoding OX40 ligand, as a gene that influences atherosclerosis susceptibility. Nature Genet. 2005;37:365–372. doi: 10.1038/ng1524. [DOI] [PubMed] [Google Scholar]


