Abstract
The Definitive Haplotype Database (D-HaploDB) is a web-accessible resource of genome-wide definitive haplotypes determined from a collection of Japanese complete hydatidiform moles (CHMs), each of which carries a genome derived from a single sperm. Currently, the database contains genotypes for 281 439 common SNPs from 74 CHMs which were determined by a high-throughput array-based oligonucleotide hybridization technique. The database also presents maps of haplotype blocks and linkage disequilibrium bins together with tagSNPs that might prove useful for association studies of disease genes. Cryptic relatedness among the samples in this study is unlikely, because the formation of a CHM is a maternal event of rare sporadic occurrence, and its genotype is that of the incoming sperm. This is demonstrated by the absence of long extended shared haplotypes (ESHs). The D-HaploDB is freely accessible via the Internet at http://orca.gen.kyushu-u.ac.jp
INTRODUCTION
There is a great interest in elucidating the relationship between common genetic variation and heritable risk for common diseases. Case-control association studies have been extensively carried out to identify the genetic variants that contribute to such human diseases by employing SNPs as markers. Many SNPs show correlated genotypes (haplotypes) because of their shared evolutionary history, and so, only a subset of SNPs, also known as tagSNPs (1), need to be genotyped in order to detect the haplotype that bears the disease mutation.
The International HapMap Project (IHMP) (2) has determined fundamental new information about the haplotype structures of four populations, namely, African (YRI), Caucasian (CEU), Chinese (CHB) and Japanese (JPT). However, in the IHMP, the haplotype structures were inferred computationally using genotypes obtained from diploid starting materials. Although various algorithms have been developed to estimate haplotypes from diploid genotype data, errors in the inference process remain unresolved (3). Especially, the haplotypes of Asians were inferred without family data, and were less accurate than those for Europeans or Africans, which were determined using trio data (genotype data of parents and a child).
Complete hydatidiform moles (CHMs) offer a unique opportunity to determine definitive haplotypes at a genome-wide level (4,5). The haplotypes are definitive because they are directly determined using haploid genomes, in contrast to those in the other databases, e.g. the HapMap database, in which the haplotypes are computationally inferred from diploid data. The D-HaploDB presented here contains a genome-wide map of haplotypes which was obtained by genotyping 281 439 common SNPs in 74 CHM samples that were collected throughout Japan. This project was carried out independent of the IHMP (2).
DATA SOURCE
CHM samples were collected on a nationwide scale, and the effort was supported by the Japan Association of Obstetricians & Gynecologists. Both the female donors of the CHM tissues and their male partners were Japanese. Use of these samples in the present work was approved by the Ethical Committee of Kyushu University. The purity of the CHM DNA samples was confirmed by genotyping with 17 highly variable microsatellite markers (6). These high-quality CHM samples served as materials for high-throughput genotyping using high-density oligonucleotide arrays. The SNPs have been chosen to represent all of the linkage disequilibrium (LD) bins in both the European and Han Chinese populations detected in a previous study (7). Appropriate filters were applied to control the genotyping quality as described previously (6). In brief, we initially typed 75 CHM samples using 358 550 SNPs. We then removed SNPs with a call rate of <80% and ‘singleton’ SNPs. The overall number of SNPs passed through these quality filters was 281 561. Of these SNPs, 281 439 (CHMSNPs) were mapped on the human reference sequence (NCBI Build 35). The data of one CHM sample were removed as its call rate (of SNPs) was low (71.6%). For the remaining 74 CHMs, the lowest and average call rates were 92.9 and 98.2% of the SNPs, respectively. We also genotyped 10 CHMs using an independent platform, the Affymetrix 100K Array, to evaluate the quality of the genotype data. The concordance rate between the two platforms was 99.91%. The average and the median distance between CHMSNPs were 10.0 and 5.5 kb, respectively. Some detailed statistics can be found in Supplementary Data.
The HapMap SNP genotype data and their phased version (HapMap Public Release #16c.1) were obtained from the web site of the IHMP (http://www.hapmap.org/genotypes/2005-06_16c.1_phaseI/ and http://www.hapmap.org/downloads/phasing/2005-03_phaseI/, respectively) (15). Cytoband and transcript information using the coordinates of human reference sequence, NCBI Build 35.1, were downloaded from UCSC (http://hgdownload.cse.ucsc.edu/goldenPath/hg17/database/cytoBandIdeo.txt.gz), and NCBI (ftp://ftp.ncbi.nih.gov/genomes/H_sapiens/mapview/seq_gene.md.gz), respectively (8,9). All of the data were converted into generic feature format (GFF), and then were loaded into the MySQL database using a script of GBrowse (bp_load_gff.pl) (More information about GBrowse follows).
DATABASE IMPLEMENTATION AND WEB INTERFACE
D-HaploDB has been developed and maintained on the Linux platform, and was designed for easy user access, which benefits from a platform-independent web-based application called generic genome browser (GBrowse v1.62) developed by Stein et al. (10) as a part of the Generic Model Organism System Database Project (GMOD) (http://www.gmod.org). The back end is a MySQL relational database, and the front end consists of a set of Perl scripts, all running in an Apache environment. The CGI scripts that produce the detailed information reports for CHMSNPs, blocks and LD bins were written in Perl. Data retrieval from the MySQL database is performed using the Perl DBI. The versions of the software are described in our website.
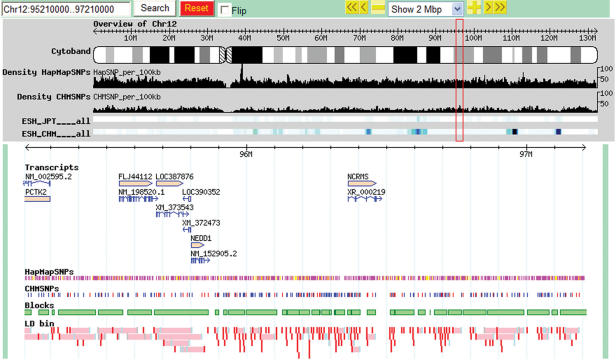
GBrowse supports various types of queries such as gene name, reference SNP ID and chromosome position (Figure 1). D-HaploDB also supports searches by the IDs of blocks and LD bins. Using checkboxes, users can select various tracks they wish to display or hide. Glyphs in each track are linked to relevant resources, such as the Entrez Gene and HapMap web sites. Users can select the tracks and dump the relevant data from the displayed region in a space-delimited text format, which can then be imported into, e.g. an Excel spreadsheet or other data analysis tools. Users can add annotations to the database by preparing GFF files describing the nature and position of the annotation and then uploading these files to GBrowse by the ‘Upload a file’ function.
Figure 1.
An example of the D-HaploDB web page. The region from 95 to 97 Mb of human chromosome 12 is shown.
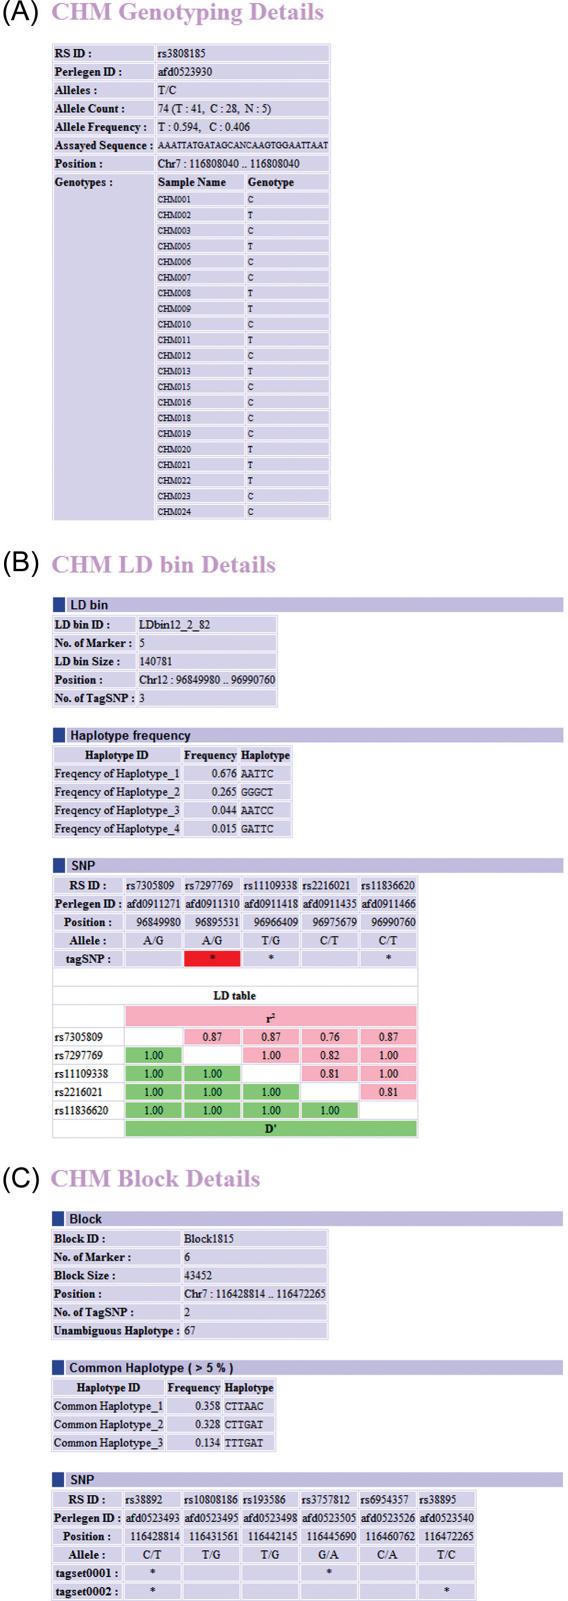
The detailed information reports for the genotypes of CHMSNPs, haplotype blocks and LD bins can be opened by clicking the glyphs in each track. These reports include individual genotypes, common haplotypes and tagSNPs, as shown in Figure 2.
Figure 2.
Reports exported from D-HaploDB. CHM genotyping detail report (A), LD bin detail report (B) and block detail report (C) are shown. The asterisks indicate the tagSNPs. The best-tagSNPs are highlighted in red.
DATABASE PRESENTATION
GBrowse (10) is used to visualize genetic and genomic data. Currently 11 overview tracks and six detail tracks are available (Figure 1).
SNP genotypes of CHM samples
CHMSNPs indicate SNPs used for genotyping CHM samples. SNPs that have been genotyped only in CHMs are indicated in red, while those genotyped both in CHMs and HapMap JPT are shown in blue. The glyph for each SNP is linked to a table page, which contains individual genotypes and allele counts (Figure 2A). The density of genotyped SNPs (SNPs per 100 kb) is viewable in an overview track.
Haplotype blocks and LD bins
In D-HaploDB, haplotype blocks were partitioned using the methods of Zhang et al. (HapBlock v30) (11). We also created the map of LD bins using the algorithm of ‘ldSelect’, which is based on the pairwise LD measurements (12), because of their direct relevance to association studies. In this method, no block structures are assumed and the identified tagSNPs can serve as markers in a pooled DNA analysis (13). We have modified the ldSelect program (12) to accept the haploid data and then used it to identify bins of common SNPs (MAF ≥ 0.1) that are in strong LD (r2 ≥ 0.8). We identified a total of 176 152 LD bins using the CHMSNPs, and the results were integrated into D-HaploDB. In the LD bin track of the database, the tagSNPs and best-tagSNPs (the tagSNP that showed the highest average r2 value for the remaining members within the bin) are highlighted in light blue and red, respectively. We found these best-tagSNPs to be efficient markers in a genome-wide association study (Miyatake, K., manuscript in preparation). Detailed information, such as common haplotypes and tagSNPs, can be viewed by clicking each bin (Figure 2B).
Simulated region
The PHASE program (3) was adopted in the IHMP to infer haplotypes from diploid data, as the program is known to be one of the most accurate software to estimate the haplotypes. The genome-wide definitive haplotype data obtained here provides an excellent chance of assessing the accuracy of the inference process. To assess the accuracy, we selected 134 non-overlapping regions each containing 50 SNPs, and then the process of phasing was simulated using 100 sets of pseudo-individuals that were randomly paired definitive haplotypes (6). We found some difference between the block structures deduced from the CHM haplotype set and those from the inferred haplotype sets that are visually comparable in a separate window, which can be opened by clicking a glyph of the simulation track. We are currently studying how these differences can affect the power of the association study.
Extended shared haplotype
The extended shared haplotype (ESH) analysis is an effective statistical method for the detection of recent positive selection events in the human genome. We determined the ESH intervals for all combinations of the CHM haplotypes. The ESH densities, calculated as the number of overlapping ESHs per 100 kb window, are presented in the ESH overview track. The ESH densities for other populations have also been calculated using the phased data from HapMap and are presented in the additional overview tracks for comparative purposes.
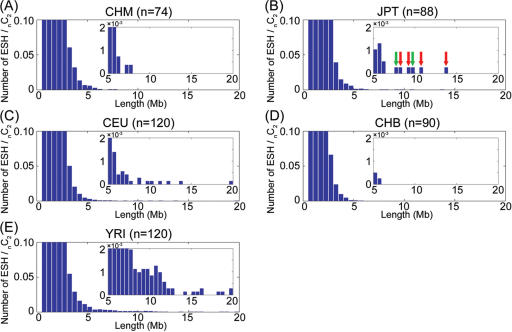
It has long been the concern that association studies may suffer from high rates of false positives if there is an unrecognized population structure. It is perhaps less widely appreciated that so-called ‘cryptic relatedness’ (i.e. kinship among the samples that is not known to the investigator) (14) might also potentially inflate the false positive rate. One of the important aspects of our database is the ESH map, which provides not only the opportunity to identify candidate selection regions (6), but it also sheds some light on cryptic relatedness among the collected samples. Figure 3 shows the length distribution of the ESH intervals. As is evident from the figure, significant numbers of long ESH are observed in all HapMap samples except for CHB. Considering the fact that the ESHs in the HapMap samples have a greater chance to be broken than those in CHM because of the three times higher density of SNPs (and also possible phasing errors in JPT and CHB) in that database, such long ESHs are indicative of the cryptic relatedness in some of the CEU, YRI and JPT samples of HapMap. The presence of cryptic relatedness in the HapMap samples was also mentioned in a recent publication (15).
Figure 3.
The length distribution of the ESHs. The number of ESHs, normalized by the number of combinations of chromosomes, in the populations of CHM (A), JPT (B), CEU (C), CHB (D) and YRI (E) are shown. ESHs longer than 500 kb were counted. The SNP intervals longer than 100 kb were treated as breaks in the ESHs. It is noteworthy that unusually long haplotypes were observed in the JPT samples, while no such long ESHs were detected in the CHM samples. The long ESHs originating from the same individuals in JPT are indicated by the green and red arrows.
FUTURE PERSPECTIVE
D-HaploDB is a work in progress and we are presently genotyping another set of SNPs (Affymetrix 500k Array) using 100 CHM samples, which is expected to further improve the resolution and quality of haplotype map of Japanese population. In addition, efforts are also underway to re-select tagSNPs, based on an improved LD measure mapping method (16).
BULK DOWNLOAD OF THE DATA
In the download section, all of the D-HaploDB data set is available as a series of text files at http://orca.gen.kyushu-u.ac.jp/download.html. This includes raw genotypes and analytical results such as blocks, LD bins, common haplotypes and tagSNPs.
SUPPLEMENTARY DATA
Supplementary Data are available at NAR Online.
Acknowledgments
This work was supported by Grant-in-Aid for Scientific Research from the Ministry of Education, Culture, Sports, Science and Technology of Japan. The authors wish to acknowledge the genotyping work of people in Perlegen Sciences, Inc., USA (Drs Renee Stokowski, David Hinds, Krishna Pant and David Cox). CHM samples were collected by Drs Toshio Hirakawa, Hidenori Kato, Takao Matsuda and Norio Wake of Kyushu University in collaboration with the Japan Association of Obstetricians & Gynecologists. Part of the computation time was provided by the Super Computer System, Human Genome Center, Institute of Medical Science, University of Tokyo. Some of the data included in this article are from The International HapMap Project web site. We also thank Dr Todd Taylor (RIKEN Genomic Sciences Center) for critical reading and comments of this manuscript. Funding to pay the Open Access publication charges for this article was provided by KAKENHI (Grant-in-Aid for Scientific Research) on Priority Areas “Applied Genomics” from the Ministry of Education, Culture, Sports, Science and Technology of Japan.
Conflict of interest statement. None declared.
REFERENCES
- 1.Johnson G.C., Esposito L., Barratt B.J., Smith A.N., Heward J., Di Genova G., Ueda H., Cordell H.J., Eaves I.A., Dudbridge F., et al. Haplotype tagging for the identification of common disease genes. Nature Genet. 2001;29:233–237. doi: 10.1038/ng1001-233. [DOI] [PubMed] [Google Scholar]
- 2.The International HapMap Consortium. The International HapMap Project. Nature. 2003;426:789–796. doi: 10.1038/nature02168. [DOI] [PubMed] [Google Scholar]
- 3.Stephens M., Scheet P. Accounting for decay of linkage disequilibrium in haplotype inference and missing-data imputation. Am. J. Hum. Genet. 2005;76:449–462. doi: 10.1086/428594. [DOI] [PMC free article] [PubMed] [Google Scholar]
- 4.Taillon-Miller P., Bauer-Sardina I., Zakeri H., Hillier L., Mutch D.G., Kwok P.Y. The homozygous complete hydatidiform mole: a unique resource for genome studies. Genomics. 1997;46:307–310. doi: 10.1006/geno.1997.5042. [DOI] [PubMed] [Google Scholar]
- 5.Fan J.B., Surti U., Taillon-Miller P., Hsie L., Kennedy G.C., Hoffner L., Ryder T., Mutch D.G., Kwok P.Y. Paternal origins of complete hydatidiform moles proven by whole genome single-nucleotide polymorphism haplotyping. Genomics. 2002;79:58–62. doi: 10.1006/geno.2001.6676. [DOI] [PubMed] [Google Scholar]
- 6.Kukita Y., Miyatake K., Stokowski R., Hinds D., Higasa K., Wake N., Hirakawa T., Kato H., Matsuda T., Pant K., et al. Genome-wide definitive haplotypes determined using a collection of complete hydatidiform moles. Genome Res. 2005;15:1511–1518. doi: 10.1101/gr.4371105. [DOI] [PMC free article] [PubMed] [Google Scholar]
- 7.Hinds D.A., Stuve L.L., Nilsen G.B., Halperin E., Eskin E., Ballinger D.G., Frazer K.A., Cox D.R. Whole-genome patterns of common DNA variation in three human populations. Science. 2005;307:1072–1079. doi: 10.1126/science.1105436. [DOI] [PubMed] [Google Scholar]
- 8.Pruitt K.D., Tatusova T., Maglott D.R. NCBI Reference Sequence (RefSeq): a curated non-redundant sequence database of genomes, transcripts and proteins. Nucleic Acids Res. 2005;33:D501–D504. doi: 10.1093/nar/gki025. [DOI] [PMC free article] [PubMed] [Google Scholar]
- 9.Karolchik D., Baertsch R., Diekhans M., Furey T.S., Hinrichs A., Lu Y.T., Roskin K.M., Schwartz M., Sugnet C.W., Thomas D.J., et al. The UCSC Genome Browser Database. Nucleic Acids Res. 2003;31:51–54. doi: 10.1093/nar/gkg129. [DOI] [PMC free article] [PubMed] [Google Scholar]
- 10.Stein L.D., Mungall C., Shu S., Caudy M., Mangone M., Day A., Nickerson E., Stajich J.E., Harris T.W., Arva A., et al. The generic genome browser: a building block for a model organism system database. Genome Res. 2002;12:1599–1610. doi: 10.1101/gr.403602. [DOI] [PMC free article] [PubMed] [Google Scholar]
- 11.Zhang K., Deng M., Chen T., Waterman M.S., Sun F. A dynamic programming algorithm for haplotype block partitioning. Proc. Natl Acad. Sci. USA. 2002;99:7335–7339. doi: 10.1073/pnas.102186799. [DOI] [PMC free article] [PubMed] [Google Scholar]
- 12.Carlson C.S., Eberle M.A., Rieder M.J., Yi Q., Kruglyak L., Nickerson D.A. Selecting a maximally informative set of single-nucleotide polymorphisms for association analyses using linkage disequilibrium. Am. J. Hum. Genet. 2004;74:106–120. doi: 10.1086/381000. [DOI] [PMC free article] [PubMed] [Google Scholar]
- 13.Sham P., Bader J.S., Craig I., O'Donovan M., Owen M. DNA Pooling: a tool for large-scale association studies. Nature Rev. Genet. 2002;3:862–871. doi: 10.1038/nrg930. [DOI] [PubMed] [Google Scholar]
- 14.Devlin B., Roeder K. Genomic control for association studies. Biometrics. 1999;55:997–1004. doi: 10.1111/j.0006-341x.1999.00997.x. [DOI] [PubMed] [Google Scholar]
- 15.The International HapMap Consortium. A haplotype map of the human genome. Nature. 2005;437:1299–1320. doi: 10.1038/nature04226. [DOI] [PMC free article] [PubMed] [Google Scholar]
- 16.Qin Z.S., Gopalakrishnan S., Abecasis G.R. An efficient comprehensive search algorithm for tagSNP selection using linkage disequilibrium criteria. Bioinformatics. 2006;22:220–225. doi: 10.1093/bioinformatics/bti762. [DOI] [PubMed] [Google Scholar]


