

Abstract
Context
Increased dietary variety has been associated with increased body weight; however, diet variety is not measured using a standardized methodology.
Objective
We developed a new dietary variety score (DVS) based on food macronutrient content, and determined the relationship between DVS and measures of adiposity.
Design
Cross-sectional, observation study.
Setting
University of Alabama at Birmingham (UAB), EatRight Weight Management Program
Patients
Study subjects (n = 74) were former participants of UAB's EatRight Weight Management Program who completed the program at least 1 year ago.
Main Outcome Measures
Unique items from 4-day food records were converted to macronutrient categories using the diabetic exchange. Foods were categorized as a source of carbohydrate if containing ≥ 5 g carbohydrate and ≥ 20 calories; fat if containing ≥ 5g fat; protein if containing ≥ 7g protein. Height and weight were measured; BMI (kg/m2) was calculated. Dual energy X-ray absorptiometry measured body fat. Generalized linear modeling in SAS (Ver.9) determined relationships between adiposity and DVS.
Results
On average, participants weighed 92.7 ± 30.9 kg (BMI = 32.5 kg/m2). Men and women's body fat were 37.4 ± 6.4% and 47.3 ± 6.4%, respectively. Separate linear regression models containing terms for sex and DVS showed significant relationships between macronutrient DVS and BMI. In a multivariate model controlling for each of the macronutrient DVS, BMI was not related to fat DVS, but was found to be positively related to protein DVS (beta = 0.87, P = .04). Sex modified the relationship between carbohydrate DVS and BMI, with an inverse relationship between BMI and carbohydrate DVS among women, and a positive relationship among men. Percent body and trunk fat were not related to DVS for either gender.
Conclusions
The new DVS, based on macronutrient content of foods, had significant associations with BMI. These dietary variety scores may provide another way to evaluate the impact of consuming a variety of food types on energy intake and BMI.
Keywords: Dietary variety, macronutrient, body mass index, obesity, body composition
Introduction
Over the past 15 years, Americans have become more overweight, with a 74% increase in obese adults since 1991.[1] As a means to fight obesity and limit weight gain, Americans, to a large extent, have focused on trying to alter intake of the macronutrients – carbohydrates, fat, and protein.[2–7] For example, after several late 1980s papers identified dietary fat as the culprit behind America's worsening diet and health, Americans employed low-fat/fat-free diets throughout the 1990s.[4,8,9] Alternatively, in the past several years, diets such as Atkins, South Beach, and Sugar Busters, which promote low carbohydrate intake and high protein intake, increased in popularity.[10,12] In essence many consumers are cognizant of the macronutrient content of their diet, evidenced by counting fat grams, total or net “carbs,” or protein servings.
As people limit foods high in certain macronutrients, this may lead to decreased dietary variety, and it is of interest to understand the impact limited food variety may have on body weight. The objective of maintaining a diverse dietary intake is to ensure adequate intake of key essential nutrients that promote healthfulness.[13] However, McCrory and colleagues[14] reported that people offered a variety of food items eat more food, and increased dietary variety has been associated with higher body weight when the items eaten are high in energy density.[14] Therefore, dietary plans that focus on limited variety by restricting intake of a particular macronutrient may be helpful for weight loss. For example, some have speculated that a portion of the appetite suppressive effects of low-carbohydrate plans is related to decreased variety and eventual boredom.[15] As alternative food products that serve as reasonable substitutes for the regular food product are produced, intake and dietary variety may not necessarily have to be limited.
Dietary variety has been measured using several methods.[14,16,17] Most studies have reported a consistent positive relationship between increased dietary variety and body weight – as variety increases, so does body weight.[14,16,18] The most widely used method includes determining intake from a food frequency questionnaire (FFQ) and identifying the unique foods consumed within various food groups. For example, a FFQ may request that a subject report the various foods consumed over a given period of time (eg, 6 months). Dietary variety is determined by counting the number of unique food items consumed within a food group, regardless of the frequency (ie, milk would only count once even if it were consumed every day). The referent food groups often vary based on the investigator, but range from the food groups specified on the FFQ to the USDA Food Guide Pyramid food groups. This methodology, however, fails to account for all foods consumed and can group foods that have no real nutrient comparability. The FFQ will have a predetermined set of food items on the form, limiting the responses to those items that are included. Therefore, food items that were consumed but not included on the form are not counted as part of the variety score.
Because of the emphasis on macronutrient-centered diets in the general population, we developed a new diet variety score (DVS) based on the macronutrient content of foods. This would allow practitioners to group foods using an accepted standard and readily available information from the nutrition label. In addition, we wanted to ensure that the diet variety score had an inherent relationship to energy intake. To accomplish this, we used macronutrient composition as the guiding principle for developing the score, as it is clear that carbohydrates, protein, and fat have 4, 4, and 9 kcal/g, respectively. This study reports the derivation of the macronutrient DVS using 4-day food records from a cross-sectional, convenience sample of former weight loss program participants. Finally, we wanted to determine the relationship of the new DVS to energy intake and measures of body fatness within the sample of former weight loss program participants.
Methods
Diet Variety
We defined macronutrient diet variety as the total number of unique food sources within a macronutrient category, as determined with a 4-day food record and the dietary exchange system. The following steps were used to determine macronutrient diet variety. First, for each individual, duplicate food items were eliminated from the database, retaining the item with the largest weight consumed, so that a food item was only counted once in the analysis of macronutrient dietary variety. Second, each food item was assigned to macronutrient categories based on the dietary exchange algorithm of:
Carbohydrate = ≥ 5 g carbohydrate and ≥ 20 calories
Fat = ≥ 5 g fat
Protein = ≥ 7 g protein
When a food item fulfilled the criteria for classification as a source of one of the above macronutrients, a score of 1 was tallied for that food in the appropriate group. A food item or mixed dish could be a source for more than one macronutrient (eg, whole milk = 1 carbohydrate, 1 fat, and 1 protein). Lastly, to calculate the macronutrient diet variety score for each macronutrient, we took the sum of unique foods that fulfilled criteria of the dietary exchange for the given macronutrient. An example of the scoring of several food items is shown in Table 1. In this study we removed alcohol from the analysis as it was only 1.75% of total calories for the entire sample.
Table 1.
Sample Participants DVS Analysis
| Macronutrients | Diet Variety Scores | |||||||
|---|---|---|---|---|---|---|---|---|
| Food Item | Serving Size (g) | Energy (kcal) | Protein (g) | Carb (g) | Fat (g) | Prot Score | Carb Score | Fat Score |
| Apple | 69 | 40.7 | 0.13 | 10.5 | 0.25 | 0 | 1 | 0 |
| Green beans | 135 | 71.8 | 2.1 | 8.8 | 4.0 | 0 | 1 | 0 |
| Chicken Breast (skin eaten) | 85.1 | 156.5 | 23.3 | 0 | 6.3 | 1 | 0 | 1 |
| Ribeye steak, 6 oz | 340 | 976 | 87.0 | 0 | 67.2 | 1 | 0 | 1 |
| Donut, glazed | 35.6 | 149 | 1.8 | 19.1 | 7.8 | 0 | 1 | 1 |
| Baked potato, medium | 122 | 113 | 3.1 | 25.8 | 0.16 | 0 | 1 | 0 |
| French fries, medium | 176 | 515 | 5.75 | 67.3 | 25.9 | 0 | 1 | 1 |
| Milk, reduced fat (2%) | 244 | 122 | 8.1 | 11.4 | 4.8 | 1 | 1 | 0 |
| Totals | 1383.6 | 2165.9 | 125.6 | 164.4 | 111.6 | 3 | 6 | 4 |
Participants
We completed this cross-sectional study using data from the EatRight Follow-Up Study. Eligible study participants were drawn from a complete database of all former participants of UAB's EatRight Weight Management program (www.uab.edu/eatright).[19,21] We selected former participants who completed the program between 2001 and 2003 with no further participation in the year prior to our analysis. The minimum criterion for program participation was defined as attending at least 3 of the 12 EatRight group sessions in a 12-week program. Former participants were contacted via telephone or email. The only exclusion criterion was the self-report of any ongoing condition or illness that may have contributed to or caused significant weight gain or loss (ie, pregnancy, cancer). Of 194 attempted contacts, 24 former EatRight participants were not contacted due to incorrect contact information. Of the remaining attempted contacts, 29 (14.9%) declined participation and 69 (35.4%) made no decision to participate after being contacted on at least 3 separate occasions. Only 5 individuals were excluded as a result of the exclusion criterion. There were 74 of the 165 eligible persons (45%) who agreed to participate in the follow-up study. Participants came for their follow-up visit between June 2004 and January 2005. This study was approved by the Institutional Review Board at the University of Alabama at Birmingham, and written informed consent was obtained from each participant.
Measurements
Study participants completed 1 clinic visit to measure waist circumference (cm) using a Gullick II (spring tension) tape measure, height (cm) using a wall-mounted stadiometer, and weight (lbs), in light clothing without shoes, using a Tanita digital scale (Model #BWB500A). Each measure was obtained twice and averaged to determine the study value. Using the height and weight measurement, BMI was calculated as kg/m2. Dual energy X-ray absorptiometry (DEXA, using the Lunar DPX-L densitometer, LUNAR Radiation Corp., Madison, WI) was used to measure total and regional body fat. Due to machine limitations, DEXA was not performed if the participant's weight exceeded 300 lbs (n = 4).
Food Records
Prior to their clinic appointment, study participants were mailed a blank 4-day food record to complete. Participants recorded intake based on detailed instructions provided by a registered dietitian and included 2 weekdays and 2 weekend days. At the time of the clinic visit, records were reviewed for completeness and questions concerning any foods recorded were addressed. Complete food records were obtained for 70 of the 74 participants. Food records were analyzed by the Minnesota Nutrition Data System (NDS-R, version 5.0).
Using the food records, macronutrient DVS was calculated as described above. Energy density was determined using the methodology proposed by Ledikwe and colleagues[22] which entails calculating energy density as energy (kcal)/ amount of food (g). For the food only calculation, beverages, including milk, alcohol, noncaloric, and other caloric drinks were removed from the dataset using the following NDS-R Food Group IDs to identify them: 24, 31, 35, 62, 116, 117, 118, 119, 120, 121, 122.
Statistical Analysis
Characteristics of the population are presented as means ± SD for continuous variables and percentages for categorical variables. The relationship between BMI and diet variety score was examined through generalized linear modeling in SAS (Ver. 9). Initially all the variables were assessed for normality. The initial models included the diet variety score (either carbohydrate, fat, or protein), gender and an interaction term between the score and gender. The multivariate models included all 3 scores, age in years, race (black or other vs white), gender, and interactions that were significant in the 2 factors models. The model fit was assessed by analysis of studentized residuals in addition to quantile-quantile plots of residuals. Correlations are presented as Pearson correlation coefficients. A P value of < .05 was deemed statistically significant.
Results
Study Population
Mean demographic values for the study population stratified by gender are presented in Table 2. As noted, the majority of the participants were women, which is consistent with EatRight enrollment. The average weight change since the EatRight program was 0.26 lbs in women and 6.2 lbs in men. Participant BMI ranged from 20.3 to 54.0 kg/m2 in women and 27.5 to 67.7 kg/m2 in men, with a median of 30.7 kg/m2. As expected, men had a lower percent total body fat. The men's percent trunk fat ranged from 27.4 to 50.5 % with a median of 42.9 %. The women's percent trunk fat ranged from 33.7 to 61.4 % with a median of 47.2 %.
Table 2.
Demographic and Anthropometric Characteristics of Study Population at 1-Year Follow-up
| Female (n=61) | Male (n=13) | |||
|---|---|---|---|---|
| Characteristic | Mean (sd) | Range | Mean (sd) | Range |
| Age (years) | 50.1 (12.7) | 22–80 | 58.3 (11.7) | 37–75 |
| Weight (lbs) | 188.6 (45.6) | 113–362 | 251.2 (88.2) | 175–497 |
| BMI (kg/m2) | 31.5 (7.0) | 20–54 | 36.0 (11.5) | 27.5–67.7 |
| Percentage body fat | 47.3 (6.4) | 34–61 | 37.4 (6.4) | 27–51 |
| Percentage trunk fat | 47.5 (7.0) | 28–61 | 42.4 (5.1) | 34–52 |
| Waist circumference (cm) | 97.6 (18.1) | 65–169 | 117.7 (21.7) | 97–100 |
| Carbohydrate DVS | 22.2 (6.0) | 12–33 | 25.8 (9.5) | 8–40 |
| Fat DVS | 12.5 (4.6) | 4–27 | 14.9 (5.8) | 6–24 |
| Protein DVS | 8.7 (2.9) | 2–17 | 10.1(2.8) | 5–15 |
| Energy density (kcal/g) | 1.65 (0.45) | 0.87–3.11 | 1.79 (0.39) | 1.21–2.47 |
Nutrient Intake and Diet Variety Scores
Using the new macronutrient diet variety method, we were able to quantify each participant's unique diet variety score for carbohydrates, protein, and fat, respectively (Table 2). In general, the dietary intake for the sample could be described as moderate in fat with more than 35% of calories from fat, and less than 50% of calories from carbohydrates. The DVS for each macronutrient was positively associated with total energy intake (Carbohydrate DVS, r = .64; Protein DVS, r = .72; Fat DVS, r = .72; P < .001 for all correlations). As shown in Figure 1, there was a strong unadjusted correlation between each macronutrient DVS and total energy intake, with DVS explaining 40% to 50% of the variation in energy intake.
Figure 1.
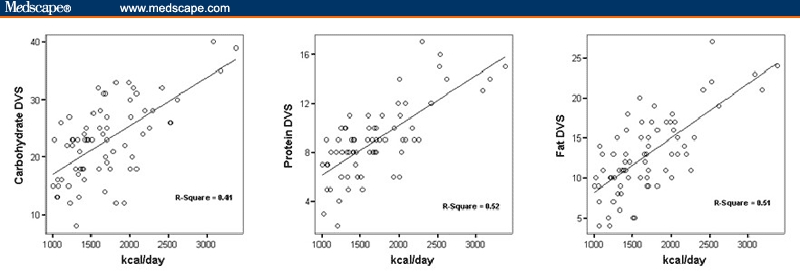
Correlations between macronutrient DVS and total energy intake.
Table 3 shows the results of correlations between macronutrient DVS and dietary energy density calculated using 3 methods – food only, food and milk, and food and all beverages. Carbohydrate DVS was inversely associated with energy density for each method of energy density calculation. It was only significant (P = .04) when using the food and all beverages method. Fat and protein DVS were positively associated with energy density, regardless of the method of calculation used. While the fat DVS correlation was significant for each method, the protein DVS correlation was not significant for the food and all beverages method. The strongest correlations between energy density and either fat or protein DVS were found using the food only method.
Table 3.
Correlation Between Macronutrient DVS and Energy Density
| Diet Variety Score | |||
|---|---|---|---|
| Energy Density | Carbohydrate | Protein | Fat |
| Food Only | −.053 | .417** | .521** |
| Food and Milk | −.095 | .360** | .532** |
| Food and all Beverages | −.242* | .170 | .392** |
P < 05
P < .01
DVS in Relation to Anthropometrics
Univariate Models
Diet variety scores for fat and protein were positively correlated with BMI. The correlation coefficient between fat DVS and BMI was 0.33 (P = .03), while that between protein DVS and BMI was 0.36 (P = .01). Additionally, it should be noted that when the participant with the highest BMI was removed from the analysis, the correlations between fat DVS and BMI, and protein DVS and BMI, decreased to 0.23 and 0.28, respectively, but remained significant. The DVS for carbohydrate was not significantly related to BMI (correlation coefficient 0.14, P = .55) (Figure 2) when both genders were included.
Figure 2.
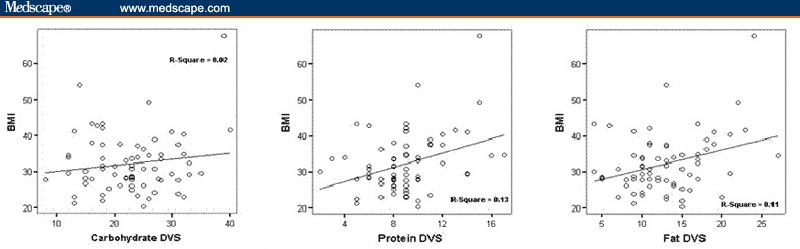
Correlations between DVS and BMI.
Two Factor Models
To determine whether macronutrient DVS explained any of the variance in BMI in this sample, we ran linear regression models. Three separate models were run to address the 3 macronutrients and their independent effects on BMI, percentage body fat and trunk fat, controlling for gender. The analysis results are shown in Table 4. The models containing fat DVS and protein DVS showed significant positive effects of the respective diet variety scores on BMI when controlling for gender. For each unit increase in fat DVS or protein DVS, BMI increased by 0.96 and 1.98 kg/m2, respectively. The carbohydrate DVS had a statistically significant effect on BMI in men, but the effect was inverse in women. As carbohydrate DVS increased for men, BMI increased by 0.62 kg/m2. However, for women, a similar increase in carbohydrate DVS resulted in a 0.71 kg/m2 decrease in BMI. In similar models that included percent body fat and percent trunk fat as dependent variables, none of the macronutrient DVS were related to these alternative measures of body fatness.
Table 4.
Models Predicting BMI, Percentage Body Fat and Percentage Trunk Fat in Cohort of Former EatRight Participants at 1-Year Follow-Up
| BMI | Body Fat Percentage | Trunk Fat Percentage | |||||||
|---|---|---|---|---|---|---|---|---|---|
| Factor | β | se | P | β | se | P | β | se | P |
| Model Group A: Score+ Gender | |||||||||
| Intercept | 19.17 | 0.62 | .0057 | 37.37 | 6.04 | < .0001 | 42.72 | 6.38 | < .0001 |
| Carbohydrate DVS | 0.62 | 0.25 | .0142 | 0.002 | 0.23 | 0.99 | −0.013 | 0.25 | .9588 |
| Gender=F | 14.48 | 7.77 | .0668 | 7.14 | 6.93 | .3073 | 1.07 | 7.32 | .8835 |
| Carb DVS*Gender | −0.71 | 0.30 | .0201 | 0.13 | 0.28 | .6507 | 0.17 | 0.29 | .5409 |
| Intercept | 20.83 | 6.32 | .0016 | 38.40 | 5.75 | < .0001 | 42.31 | 6.06 | < .0001 |
| Fat DVS | 0.96 | 0.39 | .0185 | −0.07 | 0.38 | .8583 | 0.006 | 0.40 | .9881 |
| Gender=F | 5.99 | 6.95 | .3915 | 4.35 | 6.25 | .4888 | −0.01 | 6.59 | .9987 |
| Fat DVS*Gender | −0.57 | 0.45 | .2076 | 0.44 | 0.43 | .3076 | 0.41 | 0.45 | .3648 |
| Intercept | 15.11 | 8.52 | .0808 | 39.40 | 8.35 | < .0001 | 43.24 | 8.86 | < .0001 |
| Protein DVS | 1.98 | 0.82 | .0179 | −0.20 | 0.84 | .8088 | −0.08 | 0.89 | .9227 |
| Gender=F | 9.84 | 9.09 | .2828 | 3.22 | 8.78 | .7153 | −0.65 | 9.31 | .9449 |
| Protein DVS * Gender | −1.22 | 0.89 | .1721 | 0.74 | 0.89 | .4045 | 0.65 | 0.95 | .4948 |
| Mode Group B: Multivariate | |||||||||
| Intercept | 14.4 | 6.66 | .0341 | 35.35 | 6.33 | < .0001 | 40.92 | 6.66 | < .0001 |
| Carbohydrate DVS | 0.35 | 0.26 | .1901 | −0.15 | 0.25 | .5559 | −0.19 | 0.26 | .4733 |
| Protein DVS | 0.87 | 0.42 | .0437 | 0.25 | 0.38 | .5106 | 0.19 | 0.40 | .6451 |
| Fat DVS | 0.20 | 0.27 | .4407 | 0.23 | 0.23 | .3289 | 0.31 | 0.25 | .2193 |
| Gender=F | 14.7 | 7.48 | .0543 | 7.07 | 7.01 | .3167 | 0.65 | 7.38 | .9297 |
| Carb DVS * Gender | −0.69 | 0.28 | .0201 | 0.14 | 0.27 | .6163 | 0.21 | 0.29 | .4765 |
Multivariate Models
In Table 4 we also present the models that predict BMI, percentage body fat, and trunk fat, including all DVS scores and gender (Model Group B). Covariates age and race were not significant and had no impact on the model (data not shown). In a multivariate model controlling for each of the macronutrient DVS, BMI was not related to fat DVS, but was found to be positively related to protein DVS (beta = 0.87, P = .04). Sex modified the relationship between carbohydrate DVS and BMI, with an inverse relationship between BMI and carbohydrate DVS among women, and a positive relationship among men. No DVS scores were related to either body fat or trunk fat in Model Group B.
Discussion
This study details the development of a novel dietary variety score that is based on the macronutrient composition of the food consumed. Using the dietary exchange algorithm and 4-day food records in a cross-sectional study, we determined that the macronutrient dietary variety was highly correlated with total energy intake and energy density. In this sample of former weight control program participants, the DVS also had significant associations with BMI. Thus, these dietary variety scores may provide another way to evaluate the impact of consuming a variety of food types on energy intake and BMI.
Previous methods of estimating dietary variety have used the percentage of different food types consumed from a given food group.[14,16,23] Dietary variety calculated by using food groups has been shown to be associated with body fatness, weight loss, and long-term weight loss maintenance,[14,16,23] but this method has some limitations. All of these studies used food frequency questionnaires (FFQ) that combine foods that may have a similar main ingredient but different nutrient values (eg, considering boiled, baked, mashed potatoes, and potato salad as a single food item). This will likely underestimate the true dietary variety, as individuals may consume, for example, 3 different potato-based dishes with very different and unique energy and nutrient values that would only be considered as 1 item in this instance. In addition, the food groups used as the basis for diet variety were derived differently in each study. McCrory and colleagues[14] used the FFQ food groupings (eg, breakfast, lunch, and dinner entrees) while Raynor and colleagues[16] used Food Guide Pyramid groupings (eg, low-fat bread, cereal, rice, and pasta; fruits). Each method may have advantages, but there is little consistency and the differences among food groups make it difficult to compare between studies. Finally, multiple types of FFQs have been used in these calculations. Longer versions such as the 116-item Fred Hutchinson Cancer Research Center FFQ[24] may provide more reliable estimates than shorter versions such as the 60-item Block FFQ[25] simply because of the inclusion of more food items.
The use of macronutrients and multiple-day food records potentially addresses several limitations. The dietary exchange algorithm is well established and can provide a consistent method for deriving the variety score. The use of the multiple-day food record or a recall methodology allows for the inclusion of all food items, providing a closer estimate of variety. Because the macronutrient DVS takes into account the composition of the food, mixed dishes can be easily handled. In addition, foods do not have to be subdivided into high-fat or low-fat varieties to allow for accurate interpretation. As shown in Table 1, the scores for similar food items (potatoes) prepared in different manners (fried vs baked, in this example) allow one to distinguish between these items and count the contribution of unique food items. Furthermore, the new DVS, based on macronutrient content, has a strong inherent relationship with total energy intake and energy density.
The protein and fat DVS were shown to be associated with BMI in the same direction for both genders. These findings are consistent with the food grouping methods that have combined food groups high in fat or meat-based foods. In contrast, carbohydrate DVS had different effects on BMI by gender. There may be several explanations for this finding. The sample of men in this study was small (n = 13) and may have produced spurious findings. Alternatively, the types of carbohydrates consumed by men may have been systematically different from carbohydrates consumed by women. For example, women participants had a lower weight gain following participation in the EatRight Program, a weight management program that emphasizes low-energy-density foods with no limits on fruit and vegetable intake. Female participants from this sample may have chosen carbohydrate food sources that were lower in energy density, resulting in weight loss despite increased variety. This speculation is supported by the trend for a lower mean energy density for women compared with men. This suggests that a higher variety of carbohydrate containing foods may be consumed without increasing BMI if they are low in energy density, consistent with the findings of McCrory and colleagues.[14]
It is important to note that the macronutrient dietary variety score we derived may fail to capture some levels of variety that might have important consequences for body weight and composition. Although our score is highly correlated with total energy intake, it is clear that there are within group differences for carbohydrates, protein, and fats. Carbohydrates from fruit, vegetables and whole grains, proteins from vegetables, and fats that were mono- or polyunsaturated would be considered ideal sources. However, this score does not provide any way to adjust the score based on the food source. Further study will be needed to determine if identifying variety at levels beyond macronutrient composition will be more predictive of body weight and body composition. For example, there may be differential effects for simple vs complex carbohydrates, high glycemic load vs low glycemic load or animal protein vs vegetable protein. This would be most useful if one could avoid complicating the measure and potentially decreasing its clinical utility.
We believe that this tool may prove to be a useful method for determining dietary variety, with applications for research and clinical practice. As research in the field of dietary variety expands, manipulation of dietary variety to enhance weight reduction and weight maintenance efforts will be warranted. Providing feedback in real-time to participants about dietary variety and how it can be self-monitored may supply the needed behavioral component in potential interventions and allow participants to focus on macronutrient variety instead of counting fat grams, total or net “carbs,” or protein servings. This methodology could be implemented using standard food diaries or recalls and easily calculated by clinical dietitians. The use of a standardized methodology across various research protocols will also allow for greater comparability among studies. Further research is needed in different patient populations to confirm and validate our findings.
Funding Information
This work was supported in part by the University of Alabama at Birmingham's Clinical Nutrition Research Center, NIDDK grant # 5 P30 DK56336. In addition, Jamy D. Ard is supported by NIDDK career development award #1 K23 DK068223. Thomas E. Lyles III was supported by the UAB School of Medicine Summer Research Fellowship.
Contributor Information
Thomas E. Lyles, III, School of Medicine, University of Alabama at Birmingham.
Renee Desmond, Department of Medicine, Medical Statistics Section, University of Alabama at Birmingham.
Lori E. Faulk, Department of Nutrition Sciences, Division of Clinical Nutrition and Dietetics, University of Alabama at Birmingham.
Suzanne Henson, Department of Nutrition Sciences, Division of Clinical Nutrition and Dietetics, University of Alabama at Birmingham.
Kathy Hubbert, Department of Nutrition Sciences, Division of Clinical Nutrition and Dietetics, University of Alabama at Birmingham.
Douglas C. Heimburger, Department of Nutrition Sciences, Division of Clinical Nutrition and Dietetics, University of Alabama at Birmingham.
Jamy D. Ard, Department of Nutrition Sciences, Division of Clinical Nutrition and Dietetics, University of Alabama at Birmingham Email: ardj@uab.edu.
References
- 1.National Center for Health Statistics (U.S.). Health, United States. Hyattsville, Md.: Dept. of Health and Human Services, Centers for Disease Control and Prevention, National Center for Health Statistics; 2003. Chartbook on Trends in the Health of Americans. CD-ROMs. [Google Scholar]
- 2.Hill JO. Obesity treatment: does one size fit all? Am J Clin Nutr. 2005;81:1253–1254. doi: 10.1093/ajcn/81.6.1253. [DOI] [PubMed] [Google Scholar]
- 3.McGinnis JM, Nestle M. The Surgeon General's Report on Nutrition and Health: policy implications and implementation strategies. Am J Clin Nutr. 1989;49:23–28. doi: 10.1093/ajcn/49.1.23. [DOI] [PubMed] [Google Scholar]
- 4.Lissner L, Levitsky DA, Strupp BJ, Kalkwarf HJ, Roe DA. Dietary fat and the regulation of energy intake in human subjects. Am J Clin Nutr. 1987;46:886–892. doi: 10.1093/ajcn/46.6.886. [DOI] [PubMed] [Google Scholar]
- 5.Noakes M, Keogh JB, Foster PR, Clifton PM. Effect of an energy-restricted, high-protein, low-fat diet relative to a conventional high-carbohydrate, low-fat diet on weight loss, body composition, nutritional status, and markers of cardiovascular health in obese women. Am J Clin Nutr. 2005;81:1298–1306. doi: 10.1093/ajcn/81.6.1298. [DOI] [PubMed] [Google Scholar]
- 6.Samaha FF, Iqbal N, Seshadri P, et al. A low-carbohydrate as compared with a low-fat diet in severe obesity. N Engl J Med. 2003;348:2074–2081. doi: 10.1056/NEJMoa022637. [DOI] [PubMed] [Google Scholar]
- 7.Brehm BJ, Seeley RJ, Daniels SR, D'Alessio DA. A randomized trial comparing a very low carbohydrate diet and a calorie-restricted low fat diet on body weight and cardiovascular risk factors in healthy women. J Clin Endocrinol Metab. 2003;88:1617–1623. doi: 10.1210/jc.2002-021480. [DOI] [PubMed] [Google Scholar]
- 8.Slattery ML, Randall DE. Trends in coronary heart disease mortality and food consumption in the United States between 1909 and 1980. Am J Clin Nutr. 1988;47:1060–1067. doi: 10.1093/ajcn/47.6.1060. [DOI] [PubMed] [Google Scholar]
- 9.Katz DL. Pandemic obesity and the contagion of nutritional nonsense. Public Health Rev. 2003;31:33–44. [PubMed] [Google Scholar]
- 10.Steward HL. The New Sugar Busters! Cut Sugar to Trim Fat. 1st ed. New York, NY: Ballantine Books; 2003. [Google Scholar]
- 11.Agatston A. The South Beach Diet: The Delicious, Doctor-Designed, Foolproof Plan for Fast and Healthy Weight Loss. Emmaus, Penn: Rodale; 2003. [Google Scholar]
- 12.Atkins RC. Dr. Atkins' New Diet Revolution. New York: Quill; 2002. [Google Scholar]
- 13.United States. Dept. of Health and Human Services., United States. Dept. of Agriculture., United States. Dietary Guidelines Advisory Committee. Dietary Guidelines for Americans. 6th ed. Washington, DC: 2005. [Google Scholar]
- 14.McCrory MA, Fuss PJ, McCallum JE, et al. Dietary variety within food groups: association with energy intake and body fatness in men and women. Am J Clin Nutr. 1999;69:440–447. doi: 10.1093/ajcn/69.3.440. [DOI] [PubMed] [Google Scholar]
- 15.Astrup A, Meinert Larsen T, Harper A. Atkins and other low-carbohydrate diets: hoax or an effective tool for weight loss? Lancet. 2004;364:897–899. doi: 10.1016/S0140-6736(04)16986-9. [DOI] [PubMed] [Google Scholar]
- 16.Raynor HA, Jeffery RW, Tate DF, Wing RR. Relationship between changes in food group variety, dietary intake, and weight during obesity treatment. Int J Obes Relat Metab Disord. 2004;28:813–820. doi: 10.1038/sj.ijo.0802612. [DOI] [PubMed] [Google Scholar]
- 17.Drewnowski A, Henderson SA, Driscoll A, Rolls BJ. The Dietary Variety Score: assessing diet quality in healthy young and older adults. J Am Diet Assoc. 1997;97:266–271. doi: 10.1016/s0002-8223(97)00070-9. [DOI] [PubMed] [Google Scholar]
- 18.Kennedy E. Dietary diversity, diet quality, and body weight regulation. Nutr Rev. 2004;62(7 Pt 2):S78-S81. doi: 10.1111/j.1753-4887.2004.tb00093.x. [DOI] [PubMed] [Google Scholar]
- 19.Weinsier RL, Bacon JA, Birch R. Time-calorie displacement diet for weight control: a prospective evaluation of its adequacy for maintaining normal nutritional status. Int J Obes. 1983:7539–548. [PubMed] [Google Scholar]
- 20.Fitzwater SL, Weinsier RL, Wooldridge NH, Birch R, Liu C, Bartolucci AA. Evaluation of long-term weight changes after a multidisciplinary weight control program. J Am Diet Assoc. 1991;91:421–429. [PubMed] [Google Scholar]
- 21.Duncan KH, Bacon JA, Weinsier RL. The effects of high and low energy density diets on satiety, energy intake, and eating time of obese and nonobese subjects. Am J Clin Nutr. 1983;37:763–767. doi: 10.1093/ajcn/37.5.763. [DOI] [PubMed] [Google Scholar]
- 22.Ledikwe JH, Blanck HM, Khan LK, et al. Dietary energy density determined by eight calculation methods in a nationally representative United States population. J Nutr. 2005;135:273–278. doi: 10.1093/jn/135.2.273. [DOI] [PubMed] [Google Scholar]
- 23.Raynor HA, Jeffery RW, Phelan S, Hill JO, Wing RR. Amount of food group variety consumed in the diet and long-term weight loss maintenance. Obes Res. 2005;13:883–890. doi: 10.1038/oby.2005.102. [DOI] [PubMed] [Google Scholar]
- 24.Kristal AR, Feng Z, Coates RJ, Oberman A, George V. Associations of race/ethnicity, education, and dietary intervention with the validity and reliability of a food frequency questionnaire: the Women's Health Trial Feasibility Study in Minority Populations [published erratum appears in Am J Epidemiol. 1998;148:820] Am J Epidemiol. 1997;146:856–869. doi: 10.1093/oxfordjournals.aje.a009203. [DOI] [PubMed] [Google Scholar]
- 25.Block G, Hartman AM, Dresser CM, Carroll MD, Gannon J, Gardner L. A data-based approach to diet questionnaire design and testing. Am J Epidemiol. 1986;124:453–469. doi: 10.1093/oxfordjournals.aje.a114416. [DOI] [PubMed] [Google Scholar]