Abstract
Context
Many children with attention-deficit/hyperactivity disorder (ADHD) continue to exhibit symptoms of the disorder into adolescence and adulthood. Although ADHD may have a profound impact on activities of daily living, including educational achievement and work performance, limited research exists on ADHD's impact on individual income loss and overall economic effect.
Objectives
Evaluate ADHD's impact on individual employment and income, and quantify costs of ADHD on workforce productivity for the US population.
Design
Two telephone surveys were conducted between April 18, 2003, and May 11, 2003, to collect demographic, educational, employment, and income information.
Participants
Two groups of adults aged 18-64 years were interviewed: those diagnosed with ADHD (n = 500) derived from a national list of mail-paneled members who identified themselves or a household member as having been diagnosed with ADHD, and an age- and gender-matched control group (n = 501) derived from a random digital-dialing sample of a national cross-section not diagnosed with ADHD.
Results
Statistically fewer subjects in the ADHD group achieved academic milestones beyond some high school (P < .05). In addition, fewer subjects with ADHD were employed full time (34%) compared with controls (59%; P < .001). Except for the subgroup of subjects aged 18-24 years, average household incomes were significantly lower among individuals with ADHD compared with controls, regardless of academic achievement or personal characteristics. On the basis of these findings, loss of workforce productivity associated with ADHD was estimated between $67 billion and $116 billion.
Conclusions
Decreased individual income among adults with ADHD contributes to substantial loss in US workforce productivity.
Readers are encouraged to respond to George Lundberg, MD, Editor of MedGenMed, for the editor's eyes only or for possible publication via email: glundberg@medscape.net
Introduction
Attention-deficit/hyperactivity disorder (ADHD) – a condition characterized by developmentally inappropriate levels of inattention, hyperactivity, and impulsive behavior[1] – was first believed to affect only children and adolescents but is now known to continue into adolescence and adulthood. ADHD occurs in approximately 2% to 18% of school-age children worldwide,[2,3] and up to 65% of affected children continue to be symptomatic into adulthood.[4–7] Current epidemiologic data estimate the prevalence of ADHD among adults at 5% in the US population,[8,9] which is consistent with follow-up studies of ADHD.[6]
ADHD has a profound impact on the way individuals participate in activities of daily living, with evidence suggesting a negative effect on behavior,[10] social skills,[11] interpersonal relationships,[12] educational achievement,[13] and work.[10] Adults with ADHD are at risk for antisocial behavior[14,15] and are likely to engage in a variety of harmful behaviors, such as drug abuse[10,15] and unlawful conduct.[10] They are also more likely than controls to have been diagnosed with a wide range of psychiatric conditions, including anxiety and mood disorders.[14,15]
Although increased healthcare costs for adults with ADHD were reported recently,[15] little is known about the cost to society in lost productivity. It can be deduced, however, that reduced educational achievement may limit employment options for adults with ADHD. In addition, individuals with ADHD miss significantly more days of work[15] and are more likely to be fired, change jobs, and have worse job performance evaluations than those without ADHD. These situations can adversely affect productivity,[16] but research to that end, as measured by income loss and cost to the US economy, has been limited.
In this survey, the impact of ADHD on individual employment and income was estimated, and the cost of ADHD on workforce productivity for the US population in 2003 was quantified. The primary hypothesis was that individuals with ADHD would have lower employment rates and, thus, lower incomes compared with controls, and that employed individuals with ADHD would have lower earnings than otherwise similar individuals without ADHD.
Study Design
In the first phase of this work, random digit-dialing probability sampling was used to contact subjects throughout the United States by RoperASW, a company that provides survey research services. With random digit-dialing sampling, telephone numbers are selected randomly and virtually every American household with a telephone has a probability of being included in the survey. This methodology yields samples that are nationally representative of households having telephones. All subjects were asked whether they had been diagnosed with ADHD. From this group, RoperASW randomly selected 500 subjects who reported that they had been diagnosed with ADHD and 501 who reported that they had not been diagnosed with ADHD. In the second phase, these subjects were contacted again and telephone interviews were conducted by professional interviewers experienced in the administration of telephone surveys. Each interview lasted approximately 25 minutes and subjects verbally consented to the interview before survey questions were asked. Data collection was carried out in conformance with the Code of Standards and Ethics for Survey Research of the Council of American Survey Research Organizations (CASRO). Approval for data analysis was sought from, and considered exempt by, the Institutional Review Board of the Massachusetts General Hospital.
Overall ADHD prevalence was estimated from respondents who were selected randomly from the US population. The survey interviewees were culled from a sample of adults from RoperASW's list of respondents who had identified themselves or a household member as having been diagnosed with ADHD during their adult life, and a gender- and age-matched group of respondents who had indicated that they had not been diagnosed with ADHD. The ADHD and control groups were compared using chi-square and t tests. For analyses of this survey, the maximum margin of error at the 95% confidence level is within ± 4 percentage points for sample sizes of 500.
Econometric Models
Econometric analyses were performed by the Lewin Group, Inc. (Falls Church, Virginia) on the basis of the survey results. The method used to estimate income loss was used previously in a study evaluating the economic impact of chronic fatigue syndrome[17]. It is based on the human capital theory, which suggests that ADHD is likely to have 3 possible effects that result in lower labor market earnings and incomes: lower-than-expected educational achievement, based on the individual's demographic characteristics; lower-than-expected employment rates, based on the individual's demographic characteristics and level of education; and poorer-than-expected labor market performance, based on the individual's demographic characteristics, educational achievement, and employment status. The impact of each of these effects was evaluated separately.
The approach starts with the underlying theory of labor market participation and productivity. It allows labor market earnings to differ both because of hours of work differences and differences in wages between the control group and those with the condition. Usually the effects are conditional on a given level of education. In the case of ADHD, we allowed for education levels between the cells to differ because of ADHD. By doing this, the impact of ADHD on lower education and resulting lower earnings and hours of work can be isolated.
Multivariate analysis was used to control for various individual and family characteristics unrelated to ADHD. The basic specifications controlled for sex, race, urban or rural living area, marital status, and age. Advance specification included the same controls as basic specifications, plus level of education and high school performance. Each of these specifications was further analyzed using the Household Income Model, an ordinary least-squares regression model that predicts household income on the basis of individual and family characteristics, and the Heckman Model, a 2-part model with a logistic equation for full-time employment and an ordinary least-squares regression for household income that is conditional on full-time employment, with the Heckman correction to control for selection bias.[18] Each model compared the household income of subjects in the ADHD group with that of subjects in the control group (without ADHD). An estimate of the income losses due to ADHD was obtained by comparing the income of subjects in the control group with that of subjects in the ADHD group.
We used Faraone and colleagues'[9] estimate of the prevalence of ADHD (2.9%), which was based on a random sample of the population, to project overall losses to the US population. The total income loss attributed to ADHD was calculated using the individual income loss due to ADHD times the number of subjects with ADHD, with the number of subjects with ADHD equal to the total US population times the prevalence of ADHD in the United States.
Results
The economic models used demographic, educational attainment, employment, and household income data from the sample described extensively in a prior report.[19] These data are briefly reviewed here to provide a context for the economic analyses.
Two groups of adults aged 18-64 years were interviewed: those diagnosed with ADHD (n = 500) and an age- and gender-matched control group (n = 501). Demographic characteristics of the survey population are summarized in Table 1. Gender, age, and location did not differ between study groups; however, differences were noted for educational attainment. A greater number of participants in the ADHD group were white and unmarried, and more participants in the control group were black and married.
Table 1.
Demographic Characteristics of Survey Population
| Parameter | ADHD (n = 500) | Control (n = 501) |
|---|---|---|
| Mean age, y (SD) | 31.9 (12) | 33.4 (14) |
| Gender (%) | ||
| Male | 49 | 49 |
| Female | 51 | 51 |
| Race (%) | ||
| White | 89 | 74 |
| Black | 2 | 14 |
| Marital status (%) | ||
| Married | 44.4 | 59.3 |
| Not married | 28.8 | 58.9 |
| Geographic location (%) | ||
| Urban | 37 | 39 |
| Suburban | 30 | 33 |
| Rural | 31 | 26 |
| Educational attainment (%) | ||
| High school or less | 48 | 41 |
| Less than high school | 7 | 2 |
| Some high school | 10 | 5 |
| High school graduate | 31 | 34 |
| Some college or more | 52 | 59 |
| Some college/vocational | 33 | 33 |
| College graduate | 11 | 18 |
| Some postgraduate work | 2 | 2 |
| Postgraduate degree | 5 | 6 |
ADHD = attention-deficit/hyperactivity disorder.
Educational Attainment
As illustrated in Figure 1A, significantly more control subjects completed college and some postgraduate work compared with those in the ADHD group (P < .05). The percentage of subjects who had completed high school and some college or received a postgraduate degree was higher in the control group, although not significantly so. In addition, compared with the ADHD group, significantly more subjects in the control group reported receiving mostly grades of A and B in high school (P < .05 for both); more individuals in the ADHD group reported receiving grades of C or below in high school (P < .05) (Figure 1B).
Figure 1A.
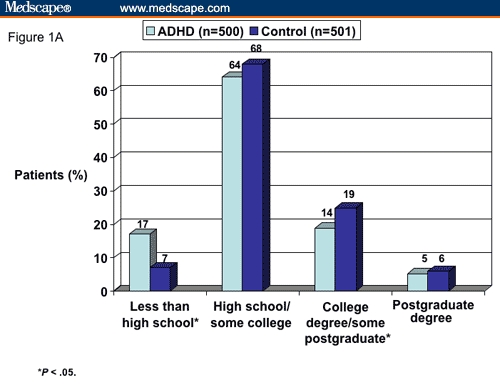
Educational attainment of survey population.
Figure 1B.
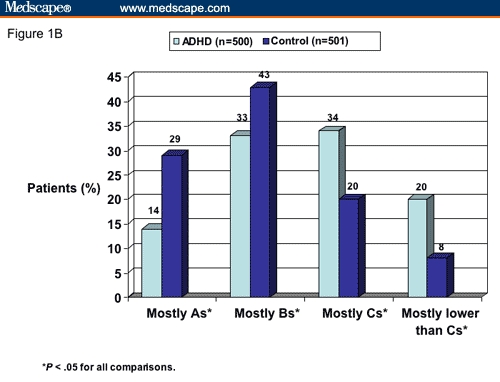
High school grades of survey population.
Employment
Overall, 33.9% of subjects with ADHD were employed full time compared with 59.0% of control subjects, and significant differences were noted between subjects with ADHD and controls across most demographic variables. Figures 2A and 2B illustrate the significant gap in full-time employment rates by sex and academic achievement, respectively, between subjects with ADHD and control subjects (P < .001 for all comparisons).
Figure 2A.
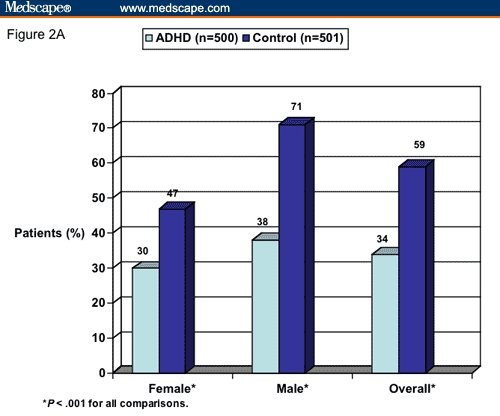
Percentage employed full time, by sex and overall.
Figure 2B.
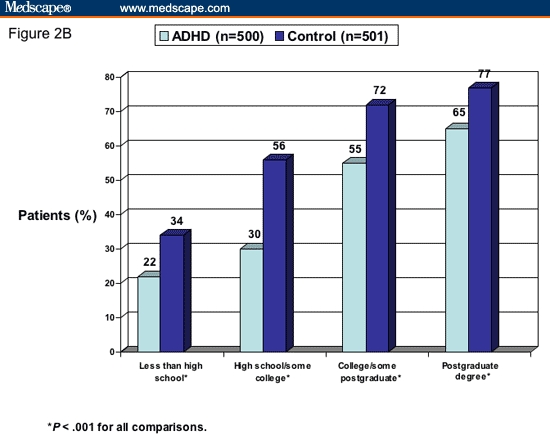
Percentage employed full time, by academic achievement.
Household Income
Table 2 summarizes the mean household income for subjects with ADHD vs the control group, controlling for demographic variables. Except for the subgroup of subjects aged 18-24 years, the mean annual household income among ADHD subjects was significantly lower across demographic groups compared with that of control subjects (P < .05). Further, with the exception of the subjects with less than a high school education, the annual household income was higher in the control group than in the ADHD group regardless of the level of educational attainment, achieving significance among those with high school and some college education (P < .05) and those with a postgraduate degree (P < .001) (Figure 3).
Table 2.
Mean Annual Household Income of Survey Population
| Parameter | ADHD | Control | P Value |
|---|---|---|---|
| Overall | $41,511 | $52,053 | < .001 |
| Gender | |||
| Male | $45,645 | $54,399 | < .05 |
| Female | $37,607 | $49,738 | < .001 |
| Age | |||
| 18-24 y | $41,742 | $39,494 | NS |
| 25-34 y | $33,518 | $54,148 | < .001 |
| 35-49 y | $44,981 | $67,196 | < .001 |
| 50-64 y | $50,556 | $63,212 | < .05 |
| Race | |||
| White | $42,593 | $54,273 | < .001 |
| Other | $32,750 | $46,030 | < .05 |
| Marital status | |||
| Married | $50,806 | $64,928 | < .01 |
| Not married | $36,708 | $44,555 | < .05 |
| Geographic location | |||
| Urban | $35,621 | $45,225 | < .05 |
| Suburban | $51,504 | $61,427 | < .01 |
| Rural | $39,670 | $50,587 | < .05 |
NS = not significant.
Figure 3.
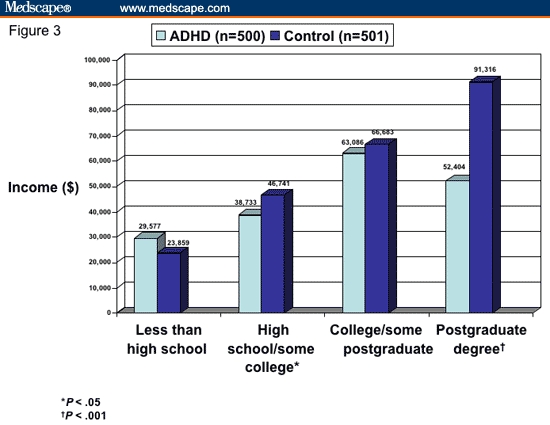
Average household income by educational attainment.
The projected annual income change per person attributed to ADHD in the United States was calculated using the basic and advanced specifications with the Heckman and Household Income models. The projected individual income change attributed to ADHD in the United States, with both specifications of each of the 2 models, demonstrated a meaningful decrease in income among subjects with ADHD:
Heckman - Basic: -$8900
Heckman - Advanced: -$10,300
Household Income - Basic: -$13,200
Household Income - Advanced: -$15,400
With both models, the basic specification, which assumes that observed differences in educational attainment and achievement are not attributable to ADHD, demonstrated a lower annual income loss compared with the advanced specification, which assumes that observed differences in educational attainment and achievement are fully attributable to ADHD.
Projected Income Change in United States Attributed to ADHD
The projected aggregate income change attributed to ADHD in the United States by age level is summarized in Table 3. All 4 configurations demonstrated loss of income as a result of ADHD, with annual loss estimates of $67 billion to $116 billion. However, like the projected individual income changes due to ADHD, the models with advanced specifications produced higher estimates of household income losses compared with those using the basic specification.
Table 3.
Projected Annual Income Change Due to ADHD in the United States (Billions)*
| Age Group (y) | Household Income (Basic) | Household Income (Advanced) | Heckman (Basic) | Heckman (Advanced) |
|---|---|---|---|---|
| 18-24 | $1.4 | $1.7 | $0.8 | $0.6 |
| 25-34 | -$24.7 | -$28.0 | -$20.4 | -$22.2 |
| 35-49 | -$57.2 | -$67.7 | -$31.0 | -$36.4 |
| 50-64 | -$19.0 | -$22.0 | -$16.5 | -$19.5 |
| Total | -$99.4 | -$115.9 | -$67.0 | -$77.5 |
The basic models assume that observed differences in educational attainment and achievement are not attributable to ADHD. The advanced models assume that observed differences in educational attainment and achievement are fully attributable to ADHD.
Discussion
The results of this survey revealed that subjects with ADHD were significantly less likely to graduate from high school or college, or to have completed a postgraduate degree, and were more likely to report that they earned grades of C or lower in high school compared with control subjects. Findings also support the primary hypothesis that fewer subjects with ADHD were employed full time, indicating that subjects with ADHD have a lower average household income compared with control subjects, regardless of academic achievement or personal characteristics. On the basis of these results, the loss of workforce productivity associated with ADHD in the United States in 2003 was estimated at $67 billion to $116 billion.
As shown in Table 2, income was significantly lower across all demographic groups among individuals with ADHD compared with controls, except in the 18- to 24-year-old group. Although the reasons for these findings are unclear, it is possible that young adults with ADHD may receive more support from their families compared with their unaffected counterparts. Alternatively, individuals with ADHD who do not have a high school diploma may have a higher general aptitude compared with their unaffected counterparts who fail to complete high school, resulting in improved workforce performance.
The human capital theory was used to estimate income loss in this survey, which considers the cost of not being employed as the additional income that would accrue from employment. The difference between the household income of employed vs nonemployed individuals is an estimate of this cost; however, this assumes that the latter group could have achieved an increased household income equal to this difference if they chose to work. This income difference – holding all other measurable characteristics constant – may overstate the actual loss to employed individuals because they are likely to have better wage offers. Reasons for this are not captured in the observable or measurable differences between employed and nonemployed individuals. Of the 2 economic models used, the Heckman Model should achieve the most accurate estimates because it directly controls for employment and includes household income adjustment to more accurately estimate household income if nonemployed individuals were to obtain full-time employment.[18]
Models using the advanced specification assume that the observed differences in educational attainment and performance between the ADHD and control groups are fully related to ADHD and are thus expected to produce higher estimates of household income losses compared with the basic specifications. Therefore, in this survey, the Heckman Model with advanced specifications should be the most accurate projection of US income change due to ADHD in 2003 (−$77.5 billion). However, because of the limitation imposed by using reported household income as a proxy for earnings and the small sample size in this survey, both functional forms were presented to demonstrate the robustness of the results.
Two recent publications have also examined costs associated with adult ADHD in the United States.[15,20] In a case-control analysis examining the direct and indirect medical costs and comorbidities for adults diagnosed with ADHD, work-loss costs associated with increased absenteeism, short-term disability, or worker's compensation claims were reported in a subset of employed subjects (n = 354) as part of indirect medical costs.[15] Compared with controls, individuals diagnosed with ADHD were likely to miss significantly more days of work (P < .001), as well as more total days of work (P = .03), with a resultant higher cost to employers (P < .01).[15] Unlike the present survey, employee income loss due to ADHD was not calculated, nor were the figures extrapolated to the national level.
In a study by Birnbaum and colleagues,[20] the value of work loss was determined using the employee's current salary and administrative health insurance claims from disability and medically related missed days from work. The authors estimated the total cost of work loss among men and women with ADHD as $2.6 billion, or 53% of the total $13 billion cost of adult ADHD in the United States. As in the present survey, the human capital approach was used but yielded a much lower work loss cost to society than that in the present survey, which employed the Heckman Model to compare income in individuals with ADHD with that of matched controls (−$77.5 billion in US productivity). Results of the present survey suggest that the well-established deficiencies in educational achievement among individuals with ADHD are associated with decreased workplace productivity. Thus, accounting for the individual and societal cost of disease only through cost of absenteeism obviously underestimates the resultant loss.
The trends observed in this survey on ADHD are similar to those observed with depression, another psychiatric disorder known to affect worker productivity. In general, mental illness is linked with a loss in earnings,[21] but the prevalence of depression in particular is estimated to be twice as high in unemployed people vs employed individuals and those no longer in the workforce.[22] Depressive symptoms in the Coronary Artery Risk Development in Young Adults study were associated with a 60% increased risk for unemployment and a 90% increased odds of reduced household income.[23] An annual income of $25,000 to $34,999 was reported by 38% of patients with substantial depressive symptoms vs 29% of patients without substantial depressive symptoms, while an income of $50,000 to $74,999 was reported by 18% and 25% of patients, respectively. For purposes of comparison, the recently published Sequenced Treatment Alternatives to Relieve Depression study[24] calculated a mean yearly household income of $29,724 in 1500 patients with depression, which was lower than the national average.
The current survey in patients with ADHD had several limitations. Because the clinical diagnosis of ADHD was used as an indicator of prevalence rather than the occurrence of symptoms and associated impairment, the effect of ADHD on individual household income and US productivity may have been underestimated. Because we did not assess learning disabilities, we cannot determine the degree to which our economic impact findings might have been accounted for by learning-disabled ADHD subjects. In addition, there were 2 shortcomings in the survey's income variable: the lack of personal earnings data that might bias the results, and the reporting of household income as a categorical variable with broad categories, which limits the accuracy of the results. Finally, a small sample size limits the validity of the extrapolation of these findings to the total US population. As mentioned, however, to compensate for the limitations imposed by using reported household income as a proxy for earnings and the small sample size, 2 functional forms of economic models were presented to demonstrate the strength of the results.
Conclusions
This survey compared income and employment in adults with ADHD and controls without ADHD and extrapolated the results to the change in national productivity. The estimated loss of workforce productivity in 2003 was $8900 to $15,400 per person with ADHD, implying a total US loss of productivity between $67 billion and $116 billion. Compared with control subjects, adults with ADHD were shown to attain lower levels of education and, regardless of level of educational achievement, to generally experience substantial declines in full-time employment and household income. Future research is warranted to evaluate the impact of early and accurate diagnosis of ADHD and prescription of appropriate interventions on educational milestones and enhancement of worker productivity.
Acknowledgments
The authors wish to thank Barbara Joan Goldman, RPh, and Craig Ornstein, PhD, for assistance in the preparation of this manuscript.
Funding Information
This study was supported by Shire Laboratories Inc.
Contributor Information
Joseph Biederman, Pediatric Psychopharmacology, Massachusetts General Hospital, Boston, Massachusetts; Harvard Medical School, Boston, Massachusetts.
Stephen V. Faraone, Child & Adolescent Psychiatry Research, Department of Psychiatry, SUNY Upstate Medical University, Syracuse, New York.
References
- 1.American Psychiatric Association. Diagnostic and Statistical Manual of Mental Disorders. Text Revision. 4th ed. Washington, DC: American Psychiatric Association; 2000. [Google Scholar]
- 2.Faraone SV, Sergeant J, Gillberg C, Biederman J. The worldwide prevalence of ADHD: Is it an American condition? World Psychiatry. 2003;2:104–113. [PMC free article] [PubMed] [Google Scholar]
- 3.Rowland AS, Lesesne CA, Abramowitz AJ. The epidemiology of attention-deficit/hyperactivity disorder (ADHD): a public health view. Ment Retard Dev Disabil Res Rev. 2002;8:162–170. doi: 10.1002/mrdd.10036. [DOI] [PubMed] [Google Scholar]
- 4.Barkley RA, Fischer M, Smallish L, Fletcher K. The persistence of attention-deficit/hyperactivity disorder into young adulthood as a function of reporting source and definition of disorder. J Abnorm Psychol. 2002;111:279–289. [PubMed] [Google Scholar]
- 5.Kessler RC, Adler LA, Barkley R, et al. Patterns and predictors of attention-deficit/hyperactivity disorder persistence into adulthood: results from the national comorbidity survey replication. Biol Psychiatry. 2005;57:1442–1451. doi: 10.1016/j.biopsych.2005.04.001. [DOI] [PMC free article] [PubMed] [Google Scholar]
- 6.Faraone SV, Biederman J, Mick E. The age-dependent decline of attention deficit hyperactivity disorder: a meta-analysis of follow-up studies. Psychol Med. 2006;36:159–165. doi: 10.1017/S003329170500471X. [DOI] [PubMed] [Google Scholar]
- 7.Dulcan M. Practice parameters for the assessment and treatment of children, adolescents, and adults with attention-deficit/hyperactivity disorder. J Am Acad Child Adolesc Psychiatry. 1997;36(10 suppl):85S–121S. doi: 10.1097/00004583-199710001-00007. [DOI] [PubMed] [Google Scholar]
- 8.Kessler RC, Adler L, Barkley R, et al. The prevalence and correlates of adult ADHD in the United States: results from the National Comorbidity Survey Replication. Am J Psychiatry. 2006;163:716–723. doi: 10.1176/appi.ajp.163.4.716. [DOI] [PMC free article] [PubMed] [Google Scholar]
- 9.Faraone SV, Biederman J. What is the prevalence of adult attention deficit/hyperactivity disorder? Results of a population screen of 966 adults. J Atten Disord. 2005;9:384–391. doi: 10.1177/1087054705281478. [DOI] [PubMed] [Google Scholar]
- 10.Murphy K, Barkley RA. Attention deficit hyperactivity disorder adults: comorbidities and adaptive impairments. Compr Psychiatry. 1996;37:393–401. doi: 10.1016/s0010-440x(96)90022-x. [DOI] [PubMed] [Google Scholar]
- 11.Friedman SR, Rapport LJ, Lumley M, et al. Aspects of social and emotional competence in adult attention-deficit/hyperactivity disorder. Neuropsychology. 2003;17:50–58. [PubMed] [Google Scholar]
- 12.Eakin L, Minde K, Hechtman L, et al. The marital and family functioning of adults with ADHD and their spouses. J Atten Disord. 2004;8:1–10. doi: 10.1177/108705470400800101. [DOI] [PubMed] [Google Scholar]
- 13.Heiligenstein E, Guenther G, Levy A, Savino F, Fulwiler J. Psychological and academic functioning in college students with attention deficit hyperactivity disorder. J Am Coll Health. 1999;47:181–185. doi: 10.1080/07448489909595644. [DOI] [PubMed] [Google Scholar]
- 14.Biederman J, Faraone SV, Spencer T, Wilens T, Mick E, Lapey KA. Gender differences in a sample of adults with attention deficit hyperactivity disorder. Psychiatry Res. 1994;53:13–29. doi: 10.1016/0165-1781(94)90092-2. [DOI] [PubMed] [Google Scholar]
- 15.Secnik K, Swensen A, Lage MJ. Comorbidities and costs of adult patients diagnosed with attention-deficit hyperactivity disorder. Pharmacoeconomics. 2005;23:93–102. doi: 10.2165/00019053-200523010-00008. [DOI] [PubMed] [Google Scholar]
- 16.Barkley RA. Major life activity and health outcomes associated with attention-deficit/hyperactivity disorder. J Clin Psychiatry. 2002;63(suppl 12):10–15. [PubMed] [Google Scholar]
- 17.Reynolds KJ, Vernon SD, Bouchery E, Reeves WC. The economic impact of chronic fatigue syndrome. Cost Eff Resour Alloc. 2004;2:4. doi: 10.1186/1478-7547-2-4. [DOI] [PMC free article] [PubMed] [Google Scholar]
- 18.Heckman JJ. The common structure of statistical models of truncation, sample selection and limited dependent variables and a simple estimator for such models. Ann Econ Soc Meas. 1976;5:475–492. [Google Scholar]
- 19.Biederman J, Faraone SV, Spencer TJ, Mick E, Monuteaux MC, Aleardi M. Functional impairments in adults with self-reports of diagnosed ADHD: a controlled study of 1,001 adults in the community. J Clin Psychiatry. 2006;67:524–540. doi: 10.4088/jcp.v67n0403. [DOI] [PubMed] [Google Scholar]
- 20.Birnbaum HG, Kessler RC, Lowe SW, et al. Costs of attention deficit-hyperactivity disorder (ADHD) in the US: excess costs of persons with ADHD and their family members in 2000. Curr Med Res Opin. 2005;21:195–206. doi: 10.1185/030079904X20303. [DOI] [PubMed] [Google Scholar]
- 21.Marcotte DE, Wilcox-Gok V. Estimating earnings losses due to mental illness: a quantile regression approach. J Ment Health Policy Econ. 2003;6:123–134. [PubMed] [Google Scholar]
- 22.Greenberg PE, Kessler RC, Birnbaum HG, et al. The economic burden of depression in the United States: how did it change between 1990 and 2000? J Clin Psychiatry. 2003;64:1465–1475. doi: 10.4088/jcp.v64n1211. [DOI] [PubMed] [Google Scholar]
- 23.Whooley MA, Kiefe CI, Chesney MA, Markovitz JH, Matthews K, Hulley SB. Depressive symptoms, unemployment, and loss of income: The CARDIA Study. Arch Intern Med. 2002;162:2614–2620. doi: 10.1001/archinte.162.22.2614. [DOI] [PubMed] [Google Scholar]
- 24.Trivedi MH, Rush AJ, Wisniewski SR, et al. Factors associated with health-related quality of life among outpatients with major depressive disorder: a STAR*D report. J Clin Psychiatry. 2006;67:185–195. doi: 10.4088/jcp.v67n0203. [DOI] [PubMed] [Google Scholar]


