

Abstract
Knowledge about structural variation in the human genome has grown tremendously in the past few years. However, inversions represent a class of structural variation that remains difficult to detect. We present a statistical method to identify large inversion polymorphisms using unusual Linkage Disequilibrium (LD) patterns from high-density SNP data. The method is designed to detect chromosomal segments that are inverted (in a majority of the chromosomes) in a population with respect to the reference human genome sequence. We demonstrate the power of this method to detect such inversion polymorphisms through simulations done using the HapMap data. Application of this method to the data from the first phase of the International HapMap project resulted in 176 candidate inversions ranging from 200 kb to several megabases in length. Our predicted inversions include an 800-kb polymorphic inversion at 7p22, a 1.1-Mb inversion at 16p12, and a novel 1.2-Mb inversion on chromosome 10 that is supported by the presence of two discordant fosmids. Analysis of the genomic sequence around inversion breakpoints showed that 11 predicted inversions are flanked by pairs of highly homologous repeats in the inverted orientation. In addition, for three candidate inversions, the inverted orientation is represented in the Celera genome assembly. Although the power of our method to detect inversions is restricted because of inherently noisy LD patterns in population data, inversions predicted by our method represent strong candidates for experimental validation and analysis.
Large-scale structural changes such as deletions, duplications, inversions, and translocations of genomic segments are known to be associated with susceptibility to disease (Lakich et al. 1993; Lupski 1998; Osborne et al. 2001). However, until recently, it was generally believed that genetic differences between two individuals were largely mediated by small-scale changes such as Single Nucleotide Polymorphisms (SNPs) and meiotic recombination, and that structural variants represent a relatively small fraction of the genetic diversity. Indeed, the International HapMap project (The International HapMap Consortium 2003) was set up to catalog human genetic diversity based on SNPs alone. The first phase of this project has recently been completed producing a haplotype map of about one million common SNPs (The International HapMap Consortium 2005). In this context, it is somewhat surprising that evidence is now mounting for the presence of large-scale variants in the human genome, collectively referred to as “structural variants.” High-throughput experimental techniques based on comparative genomic hybridization have enabled the discovery of hundreds of copy-number polymorphisms in human individuals (Iafrate et al. 2004; Sebat et al. 2004; Sharp et al. 2005). The HapMap genotype data have also been used to discover insertion/deletion polymorphisms (Conrad et al. 2006; McCarroll et al. 2006).
In sharp contrast, knowledge about the location and genome-wide extent of inversion polymorphisms has not accumulated at the same pace, primarily because of the lack of a high-throughput technique for detecting inversions. Methods for assaying an inversion in a population are also limited (Turner et al. 2006). Very few examples are known of large inversion polymorphisms whose frequency has been characterized in human populations. A notable one is the recently discovered 900-kb-long common inversion polymorphism on 17q21.31 (Stefansson et al. 2005). The inverted orientation had a frequency of 21% in Europeans but was rare in individuals of African (6%) and Asian (1%) origin. The inverted haplotype was dated to be ∼3 million years (Myr) old but shows little evidence for recombination, leading to a distinct haplotype pattern and extended Linkage Disequilibrium (LD) across the region in the CEU population. Interestingly, genotype–phenotype analysis in an Icelandic population showed that women carrying the inverted haplotype had more children than those who did not, providing direct evidence that the inverted arrangement is under some form of selection.
A recent study (Tuzun et al. 2005) mapped fosmid paired-end sequence data from a fosmid DNA library of a North American female (not represented in the reference human genome assembly) to the reference human assembly. Fosmids that showed discrepancy by size were indicative of deletions/insertions between the two genomes, while fosmids whose ends mapped on the same strand of the reference genome (discordancy by orientation) pointed to potential inversions. This strategy revealed 56 putative inversion breakpoints in addition to 139 insertions and 102 deletions. Although the method is effective in determining inversions, it will require extensive re-sequencing in a population of individuals to fully determine the extent and frequency of these polymorphisms. An indirect approach that has been adopted for finding inversion polymorphisms is to test human–chimp inversions for polymorphism in humans using FISH and PCR analysis (Feuk et al. 2005; Szamalek et al. 2006). Out of 23 regions that were tested (Feuk et al. 2005), three were found to be polymorphic in humans, with the largest being an 800-kb inversion on chromosome 7.
In this study, we use the recently generated high-density SNP genotype data from the International HapMap Project (The International HapMap Consortium 2005) to detect large inversion polymorphisms in the human genome. Unlike deletions that cause miscalled genotypes and can lead to Mendelian inconsistencies (Conrad et al. 2006; McCarroll et al. 2006), inversions do not produce any aberrant SNP genotypes. Our method is based on the detection of an unusual LD pattern that is indicative of inversions for which the inverted orientation (with respect to the reference human genome sequence) is present in a majority of chromosomes in a population. The method can also detect large orientation errors in the human sequence assembly. Using simulations, we show that our method has statistical power to detect such inversions. We have applied our method to data from the first phase of the International HapMap Project to generate a list of 176 candidate inversions in the three HapMap “analysis panels” (CEU, YRI, and CHB + JPT). Although it is difficult to estimate how many of these represent true inversions, a crude estimate of the false-positive rate using coalescent simulations indicates that about half of the 78 predictions in the YRI analysis panel represent true inversions. The false-positive rate could be higher (∼80%) for the inversions in the CHB + JPT analysis panel, according to a conservative assessment. Even with the high false-positive rates, our method is a cost-effective approach to discovering inversion polymorphisms. We have looked for supporting evidence for our predicted inversions in the form of discordant fosmid pairs, assembly discrepancies, and presence of a pair of inverted repeats near inversion breakpoints. This has resulted in a smaller list of 15 inversions, two of which represent previously known inversions.
Results
We used the genome-wide SNP data from Phase I of the International HapMap Project consisting of genotypes of 269 DNA samples for ∼1 million SNPs. These samples consist of 90 CEPH individuals (30 parent–child trios) from Utah, USA (abbreviated as CEU); 90 Yoruban individuals (30 trios) from Ibadan, Nigeria (YRI); 44 unrelated individuals from Tokyo, Japan (JPT); and 45 Han Chinese individuals from Beijing, China (CHB). We combined the individuals from the JPT and CHB populations to obtain a larger set of 89 individuals (referred to as the CHB + JPT analysis panel). For the CEU and YRI analysis panels, our data consisted of 120 chromosomes (from the 60 parent individuals) each. We used the phased haplotype data (downloaded from the HapMap Web site), which was computationally phased using the program Phase 2 (The International HapMap Consortium 2005; Stephens and Scheet 2005). All our analysis was done separately on the three analysis panels (CEU, YRI, CHB + JPT).
Overview of method
Genetic maps are constructed by genotyping a large number of genetic markers in a pedigree and determining the physical order of the markers through estimates of the recombination fraction between genetic markers. On the other hand, the human genome assembly represents the genomic sequence of a few individual(s), and a second, possibly different, ordering of the markers (SNPs, e.g.) can be determined by mapping the sequence flanking the markers to this reference. Recently a high-resolution genetic map was constructed using pedigree data from an Icelandic population (Kong et al. 2002). Comparison of the genetic map to the reference sequence revealed several regions where the ordering of the genetic markers was in opposite orientation to that suggested by the reference sequence. Given the incomplete nature of the draft human sequence at that time, the sequence was modified in the regions where the genetic map strongly indicated a different marker order. The possibility that some of these discrepancies are a result of an inversion polymorphism in the particular region cannot be discounted. For example, if the human sequence represents the minor allele in a particular region of the human genome that has two orientations, one would expect the ordering of the markers (inside the inverted segment) in the genetic map to be consistent with that of the major allele and hence be opposite to that of the sequence. In fact, this is true for a 4.5-Mb-long inversion on chromosome 8 where the reference human sequence represents the minor allele (frequency 20%–30% in human populations) and the genetic map (Kong et al. 2002) matches the marker order of the major allele. However, the low resolution of genetic maps makes it difficult to detect such discrepancies in general.
In genotype data from unrelated individuals, LD refers to the nonrandom association of alleles at physically neighboring markers (SNPs in our case). Consider two biallelic loci L1,L2 with alleles A/a and B/b, respectively. If the loci are sufficiently distant, there is almost no correlation between the markers and the joint probability of seeing alleles A,B is simply P1,2(A,B) = P1(A)P2(B). However, if the loci are physically close, then
LD is typically measured by a normalization of |P1,2(A,B) − P1(A)P2(B)| (see Wall and Pritchard 2003 for a review of LD measures, including D′ and r2). In human population data, significant LD is observed at close distances, and little or no LD is observed at long distances. This correlation of LD with distance is very noisy because of multiple factors, largely owing to the fine-scale heterogeneity in the recombination rates in the human genome (Crawford et al. 2004; McVean et al. 2004; Myers et al. 2005). Although it may not be possible to determine a physical ordering of SNPs using LD alone, it is possible to distinguish between SNPs that are physically close from physically distant SNPs using LD. Our method uses high-density SNP genotype data to find regions of the human genome where the ordering of the SNPs suggested by LD patterns is opposite to that of the physical sequence.
Consider a genomic region that is inverted (with respect to the reference sequence) in a majority of the chromosomes in a population, and assume that we have genotyped markers on either side of the two breakpoints (for a graphical illustration, see Figure 1). In such a scenario, we would expect to see unusually higher levels of long-range LD (LD13 and LD24) than would be expected between markers that are physically distant. Furthermore, one would also observe low LD (LD12 and LD34) between pairs of markers that are physically close according to the reference sequence. The strength of this effect will be proportional to the frequency of the inverted allele. Our statistic is designed to search for a pair of breakpoints showing this kind of signal.
Figure 1.

Unusual LD observed in SNP data when the inverted haplotype (with respect to the reference sequence) has very high frequency. SNPs are “mapped” to the reference sequence using the flanking sequence (denoted by shaded boxes). Therefore, close SNPs in high LD are mapped to distant regions 1 and 3 (the shaded boxes). Consequently, the two regions show unusually high LD for that distance.
Most measures of LD are defined for a pair of biallelic sites and have high variance. We are interested in assessing the strength of association between blocks of SNPs across the inversion breakpoints. Therefore, we use the “multiallelic” version of the LD measure D′ (Lewontin 1964; Hedrick 1987) by considering a block of SNPs as a multiallelic marker. Blocks contain a fixed number of SNPs that are located within a certain distance on the chromosome (see Methods). To obtain an empirical probability distribution (ϕd) of the LD between two blocks at a fixed distance d, we compute the D′ measure between all pairs of blocks that are distance d apart. For every pair of inversion breakpoints, we use the four LD values (LD12, LD13, LD24, and LD34) and the LD probability distributions to compute a pair of log-likelihood ratios, one for each breakpoint. These log-likelihood ratios represent the ratio of the probability of the region being inverted versus being noninverted in the population. Using a permutation method, we compute a P-value for the log-likelihood ratios that represents the probability of the log-likelihood ratios achieving a high value by chance. We use this P-value as our statistic for evidence of inversion (see Methods for details).
Power to detect inversion polymorphisms
Our statistic is suited to detect long inversions (long enough for little or no long-range LD to be present) for which the inverted orientation (with respect to the reference sequence) is the major allele. Many factors influence the power of our statistic, including background recombination rates, the length of the inversion, and the frequency of the inverted haplotype. We used simulations to assess how these factors affect the power of our statistic. Currently, only a few instances of inversion polymorphisms are known, and existing work on simulating population data incorporating the effect of inversion polymorphisms is of a theoretical nature based on Drosophila inversion polymorphisms (Navarro et al. 2000). Therefore, we adopted a simple strategy to simulate inversions of varying frequency using haplotype data from the HapMap Project (see Methods). As our simulations were over real data with high variation in recombination rates, we effectively average over the effect of recombination rate variation. Figure 2A describes the power of the statistic to detect inversions as a function of the frequency of the inverted allele (f), keeping the length fixed at 500 kb for the three HapMap analysis panels. The power is measured by the fraction of simulated inversions in which the inverted region was detected with a P-value less than a fixed cutoff (0.02). Figure 2B describes the power for different lengths of the inverted region. The results indicate that the power of the method is low for small inversions (0.45 for inversions of length 100 kb) and increases with increasing length, saturating around 500 kb. Although the simulations cannot completely capture the effect of an inversion on LD patterns, they suggest that our method has good statistical power to detect long inversions segregating at high frequency in a population. They also indicate that the power is maximum in the YRI analysis panel (see Fig. 2A). We show later, through independent assessment of the false-positive rate of our predicted inversions on the HapMap data, that the error rate is lowest for the YRI analysis panel.
Figure 2.

(A) Power of our method to detect inversion polymorphisms in the three HapMap analysis panels. Inversions of varying frequency (100%–50%) of a fixed length (500 kb) were simulated using the HapMap data for the three analysis panels separately (YRI, CEU, and CHB + JPT). The y-axis represents the fraction of simulated inversions for which there was at least one pair of predicted breakpoints with P-value ≤0.02 matching the breakpoints of the simulated inversion. (B) Power to detect inversions of four different lengths in the YRI analysis panel.
Scanning the HapMap data for inversion polymorphisms
We searched the phased haplotype data from the three HapMap analysis panels individually using our statistic to determine sites of inversion. To reduce the number of false positives, we considered predicted inversions with length in the range 200 kb–4 Mb. After clustering and filtering the initial list of predicted inversions for each analysis panel separately (see Methods), we had a total of 176 putative inversions in the three HapMap analysis panels with a P-value of 0.02 or less. Of these, 26 were detected in the CEU analysis panel, 78 in the YRI analysis panel, and 72 in the CHB + JPT analysis panel. Most of the predicted inversions were unique to one of the analysis panels, but three regions were predicted in two analysis panels each. The predicted list includes two sites of known inversion polymorphisms: an 800-kb inversion polymorphism on chromosome 7p22.1 and a 1.1-Mb inversion on chromosome 16p12.2. The 800-kb inversion at 7p22 was identified previously (Feuk et al. 2005) using interphase FISH with 2/20 CEPH individuals found to be heterozygous for the inversion. Our method gave a signal for this region in the YRI analysis panel matching the known breakpoints (P-value of 0.012). For this inversion, the breakpoints were previously identified to a resolution of ∼200 kb (Feuk et al. 2005). For one of the breakpoints, our method can narrow down the location to a region of length 45 kb. The chromosome 16 inversion was identified through the analysis of discordant fosmid pairs (Tuzun et al. 2005). Interestingly, we detected this inversion in both CEU (P-value 0.008) and the YRI analysis panels (P-value 0.018) with identical pairs of breakpoints (see Table 1). Analysis of the sequence around the breakpoints revealed the presence of a pair of long, highly homologous inverted repeats (see Fig. 3).
Table 1.
List of predicted inversions for which there is some form of evidence supporting the inverted orientation

All genomic coordinates are based on Build 34 of the human genome assembly. Human–chimp inversions are regions that are inverted between the human and chimpanzee genomes (Feuk et al. 2005; Newman et al. 2005). Inverted repeats imply the presence of a pair of low-copy highly homologous sequences, one near each breakpoint.
Figure 3.

Genomic overview of a 1.4-Mb region at 16p12 predicted to have an inversion in both the CEU and YRI analysis panels. The left predicted breakpoint (the dotted line) overlaps with an ≈80-kb-long segment that is highly homologous to a segment (in the inverted orientation) near the other breakpoint. The region contains several disease-related genes (from the OMIM database).
The current list of inversion polymorphisms in the human genome is small, with only ∼15 inversions >200 kb that are known to be polymorphic in normal humans (from the Genome Variation Database at http://projects.tcag.ca/variation/). We looked for additional evidence that would support some of our predicted inversions. As noted earlier, sequence from different individuals (in the form of fosmid end pair sequences) can be mapped to the reference sequence to identify inverted regions (Tuzun et al. 2005). Another source of evidence comes from comparing the two human sequence assemblies produced by the International Human Genome Sequencing Consortium (2001) and Celera Genomics (Venter et al. 2001). Regions that are inverted in orientation between the two assemblies represent sites of assembly error in one of the two assemblies or polymorphic inversions, since these assemblies were generated using different sets of individuals. The Celera whole-genome shotgun assembly (Istrail et al. 2004) was aligned to the reference sequence assembly (Build 34) to discover such regions (B. Walenz, pers. comm.). If the orientation of the Celera assembly supports a predicted inversion, then it is highly likely that the inverted orientation is present in the population.
One of our predictions was supported by two fosmid pair sequences discordant by orientation (Tuzun et al. 2005). This ≈1.2-Mb inversion on chromosome 10 (p15.1–p14) was predicted in the CHB + JPT analysis panel with a P-value of 0.005. The left end of the fosmid pair mapped in the reference assembly ∼40 kb before the predicted left breakpoint, while the right end mapped just before the right breakpoint (see Fig. 4). Since the insert size of fosmids ranges between 32 and 48 kb, the two discordant fosmids are consistent with the predicted breakpoints. There were no gaps in the genome assembly near the breakpoints, and there were fosmids and BACs consistent with the reference assembly (UCSC Human Genome Browser, http://genome.ucsc.edu). This suggests that the inversion represents a previously unknown inversion polymorphism.
Figure 4.

Overview of an ≈1.2-Mb-long inversion on chromosome 10 predicted in the CHB + JPT analysis panel. Also shown are two fosmid pairs (discordant by orientation) whose one end maps to before the predicted left breakpoint and the other end maps to a region before the right breakpoint. These discordant mappings support the predicted inversion breakpoints. In this region, there is another overlapping inversion predicted in the CHB + JPT analysis panel. The region has several genes proximal to the left breakpoint, one of which is known to be overexpressed in tumor cells (Sampath et al. 2003).
There were two regions for which we obtained evidence for the inverted orientation from the Celera assembly. One of these regions is an ∼200-kb-long region on chromosome 13 that was predicted to be inverted in both the CEU and CHB + JPT analysis panels. The region is also present in the inverted orientation in the Celera assembly, and both breakpoints span large gaps (100 kb) in the sequence assembly. Another large predicted inversion on chromosome 2p25 overlaps with a 1.4-Mb region that is inverted between the two recent human genome assemblies (Build 34 and 35). The orientation of the Celera assembly of the human genome is concordant with the Build 35 assembly for the 1.4-Mb regions. There are gaps on each breakpoint that are not spanned by fosmids, indicating that it is difficult to determine the correct orientation. This region was tested for polymorphism in an analysis panel of 10 CEPH individuals (Feuk et al. 2005) but was not found to be polymorphic.
A 2-Mb-long predicted inversion on chromosome 10q.11 was predicted in both the YRI and CHB + JPT analysis panels. Furthermore, both the breakpoints for this region span gaps in the human sequence assembly, suggesting that this could represent an assembly orientation error. Two segments in this region are inverted between the Celera sequence assembly and the public assembly. The analysis of the genomic sequence around the breakpoints revealed the presence of inverted repeats, several hundred kilobases in length and of very high sequence similarity.
Many of our predicted inversions overlap with regions that are inverted between the human and chimpanzee genomes (see Table 1 for a list; Feuk et al. 2005; Newman et al. 2005). One of these is the 800-kb inversion on chromosome 7 that was tested for polymorphism in humans since it was found to be inverted between the human and chimpanzee sequences (Feuk et al. 2005).
Sequence analysis of inversion breakpoints
Segmental duplications have been shown to be highly overrepresented near sites of structural variation in the human genome (Iafrate et al. 2004; Tuzun et al. 2005). Mechanisms have been proposed as to how a pair of low-copy inverted repeats may mediate inversion events in the genome (Lupski 1998; Giglio et al. 2001; Shaw and Lupski 2004). Pairs of inverted repeats have also been detected near the inversion breakpoints for several known inversion polymorphisms (Sugawara et al. 2003; Feuk et al. 2005). We checked for the presence of pairs of low-copy homologous repeats near the breakpoints of our predicted inversions. We found that 18 of our predicted inversions had pairs of highly homologous repetitive sequences near the breakpoints. There were 11 distinct regions for which there were inverted repeats near the breakpoints4 (listed in Table 1). The significance of finding inverted repeats near the inversion breakpoints was estimated using a simple empirical method (see Methods). The P-value was estimated to be 0.006. A complete list of all pairs of low-copy repeats near breakpoints is given in Supplemental Table S2.
Many examples of apparently benign chromosomal deletions that in many cases delete entire genes have recently been reported in the HapMap analysis panels (Conrad et al. 2006; McCarroll et al. 2006). Less is known about inversions affecting genes by truncating the coding sequence in normal human individuals. Recurrent inversions disrupting the factor VIII gene on the X chromosome are known to be a common cause of severe hemophilia A (Lakich et al. 1993; Deutz-Terlouw et al. 1995; Bagnall et al. 2002). We analyzed the sequence around inversion breakpoints to see if they overlap with known genes in the human genome. The resolution of our predicted inversion breakpoints varies from a few kilobases in some cases to several hundred kilobases in others, making it difficult to say with certainty whether the inversion actually affects some gene. Assuming that purifying selection acts on inversions disrupting genes, one would expect an underrepresentation of inversion breakpoints disrupting genes. We found that 66 of our predicted inversion breakpoints are completely covered by one or more genes (for six inversions, both breakpoints are spanned by genes). (For a list of these genes, see Supplemental Table S3.) This is significantly less than what one would expect by chance (P-value of 0.02).
Many of the genes that intersect with breakpoints are previously known to be disrupted in diseases. The T-cell lymphoma breakpoint-associated target 1 (TCBA1) gene spans a genomic region of >900 kb on chromosome 6 and is associated with multiple splice isoforms, as well as alternative start sites. As the name suggests, the gene is structurally disrupted in T-cell lymphoma cell lines (Tagawa et al. 2002) and developmental disorders (Yue et al. 2006). A sketch of the previously mapped breakpoints and our predicted inversion breakpoints with respect to the known isoforms of the gene is shown in Figure 5.
Figure 5.

A predicted YRI inversion polymorphism on chromosome 6 overlaps with the TCBA1 gene. The dashed line describes the location of the predicted breakpoints. The previously mapped breakpoints of the gene in T-cell lymphoma/leukemia cell lines are also shown.
We also detected several disrupted genes with alternative splice forms, with some of the splice isoforms consistent with the inversion breakpoint. An interesting example is the Islet cell antigen (ICA1) gene, which is a target self-antigen in type 1 diabetes. The gene is known to have multiple isoforms (Gaedigk et al. 1996). As shown in Figure 6, a predicted inversion breakpoint on chromosome 7 removes the 3′-end of the gene (gb: BC008640), approximately consistent with the expression of alternative splice forms (gb: BC005922, U38260). These and many other examples hint at the important role of structural variation in mediating gene diversity.
Figure 6.

Splice isoforms of the ICA1 gene that are approximately consistent with a predicted YRI inversion breakpoint on chromosome 7. The region of the left insertion breakpoint is denoted by a dashed line. The exons are not drawn to scale.
Assessing the false-positive rate
Several of our predicted inversions represent known inversion polymorphisms and many others are supported by independent forms of evidence such as matching fosmid end sequences showing discordancy by orientation, regions inverted between different human assemblies, and so on. Given the incomplete nature of our knowledge of inversion polymorphisms in the human genome, this does suggest that many of our other top predictions could represent inversions. Although LD generally decays with increasing distance between the markers, it is now well known that there is significant variation in recombination rates across the human genome (McVean et al. 2004; Myers et al. 2005). This variation in the recombination rates could potentially result in false positives using our statistic. Therefore, it is useful to estimate how many of our predicted inversions are correct. Estimating the false-positive rate reliably is difficult, given the state of our knowledge.
We used coalescent simulations to estimate the frequency of predicted inversions on haplotype data with “no inversions.” To incorporate the heterogeneity in recombination rates in the simulated data, we used a recently developed coalescent simulation program (Schaffner et al. 2005) that can generate population data incorporating variation in recombination rates and a wide range of demographic histories for different populations (see Methods). The program is calibrated to produce haplotype data that have considerable variation in LD like that seen in real population data. The same thresholds and parameters were used for scanning the simulated data sets using our statistic as for the HapMap data. We analyzed the number of predicted inversions in the simulated data separately for each analysis panel.
Given the small number of predicted inversions in the HapMap data and many caveats in matching the simulation parameters with the real data, it is difficult to estimate the false-positive rate based on a direct comparison. The number of pairs of breakpoints for which the statistic is computed is huge (≈40 million in the YRI analysis panel), while the number of predicted inversions is small (78 with a P-value of 0.02 or smaller). One cannot compare the ratio of the number of breakpoints examined to the predicted inversions in the HapMap and the simulated analysis panels. Therefore, we use an indirect estimate.
For a P-value cutoff π, denote γ(π) to be the ratio of the number of predicted regions with a P-value at most π in the HapMap analysis panel to the corresponding number in the simulated data. If a lower P-value implies a greater chance of a prediction being real, one would expect γ(π) to increase with decrease in π. Note that if the number of true predictions (which is unknown) is small or if the P-values for the real predictions are not concentrated in the tail of the distribution, it would be difficult to observe an increase in γ(π). For the YRI analysis panel, γ(π) ranges from 1.73 to 1.75 for π in the range 0.1–0.06, but increases to γ(0.02) = 2.85, and γ(0.01) = 4.86. For a P-value of 0.02, this represents a 1.7-fold enrichment in the number of predictions in the HapMap data versus the simulated data. Under the assumption that the increase in the number of predictions in the tail of the P-value distribution is a result of true predictions, the false-positive rate at a cutoff of 0.02 can be estimated to be ∼58%. For the CEU analysis panel, we did not observe a gradual increase in γ(π) and also the number of predictions smaller than 0.02 is only 26, making it difficult to get a meaningful estimate of the false-positive rate via this method. For the CHB + JPT analysis panel, this method suggests a higher false-positive rate of 80% at a cutoff of 0.02. This could reflect the low power of our method to detect true inversion polymorphisms in the CHB + JPT haplotype analysis panels because of less accurate long-range haplotype phasing in the CHB + JPT analysis panels as compared to the CEU and YRI analysis panels. Our analysis suggests that the false-positive rate is the smallest in the YRI analysis panel, and about half of the YRI predicted inversions could be real. This is also supported by the fact that the two previously known inversions (that we detect across the three HapMap analysis panels) are detected in the YRI analysis panel, and ∼10 predicted inversions in the YRI analysis panel are supported by the presence of inverted repeats.
We also looked at the length distribution of the predicted inversions using our statistic in each of the three HapMap analysis panels independently. For this we considered inversions with length in the range 200 kb–10 Mb. For the YRI analysis panel, the number of predicted inversions seems to drop after 4 Mb and remains essentially constant after that (see Fig. 7). The number of predicted inversions with length in the range 1–4 Mb is 30, while the number of predicted inversions in the range 4–8 Mb is only 10. In contrast, for the CHB + JPT analysis panel, the numbers are 62 (in the range 1–4 Mb) and 51 (in the range 4–8 Mb). These results indicate that there is a threefold clustering of predicted regions in the smaller range for the YRI analysis panel. If most of the predictions were false, one would not expect to see any clustering. The higher clustering in the YRI analysis panel versus the CHB + JPT analysis panel is consistent with the results from the coalescent simulations, which also predict a smaller false-positive rate for the YRI analysis panel. While the above estimates of the false-positive rate are crude, they nevertheless indicate that many of our predictions, especially those in the YRI analysis panel, are likely to be real.
Figure 7.

Length distribution of predicted inversions in the YRI analysis panel. For this plot, we consider inversions with length in the range 200 kb to 10 Mb.
Discussion
We have presented a statistical method that has power to detect large inversion polymorphisms using population data. Our method can also detect large regions where the reference assembly has erroneous orientation. Applying our method to the HapMap data, we have identified 176 putative inversions in the three HapMap analysis panels. The false-positive rate for the predicted inversions in the YRI sample indicates that ≈30 of the 78 YRI predictions could represent real inversions. We have looked for independent evidence in the form of discordancies between the NCBI and Celera assembly, discordant fosmid pairs, and the presence of inverted repeats near inversion breakpoints for our predicted inversions. We have identified a novel 1.2-Mb-long inversion on chromosome 10 that is supported by two discordant fosmid pairs and has not been reported before. For two of our predicted inversions, both breakpoints span gaps in the human reference assembly, and the inverted orientation is represented in the Celera genome assembly, indicating orientation errors in the reference assembly. For ∼10 regions, the inversion breakpoints are flanked by a pair of highly homologous inverted repeats. A recently proposed method called “haplotype fusion” can assay single haplotypes for the presence of an inversion even when the breakpoints lie within long inverted repeats (Turner et al. 2006). The set of predicted inversions flanked by inverted repeats represent ideal candidates for validation using this technique.
Our method is designed to detect long inversions for which the inverted allele (with respect to the reference sequence orientation) in a population has high frequency. Therefore, it is unlikely to detect inversion polymorphisms for which the inverted allele is the minor variant. However, the allele frequencies of structural polymorphisms can vary significantly across populations. For five of the 10 deletion polymorphisms that were genotyped in the HapMap analysis panels, the minor allele in one analysis panel was the major allele in another analysis panel (McCarroll et al. 2006). The availability of data from multiple populations increases the chance of detecting the inversion using our method in the population where the inverted allele is the major variant. Furthermore, in many cases the reference sequence assembly is likely to represent the minor variant in the population. For an 18-kb inversion polymorphism at 7q11 (Feuk et al. 2005), the minor allele (frequency of 30%) was represented in the reference assembly, while the major allele matches the orientation in the chimpanzee sequence. Although the method seems to be robust to the variation in recombination rates, it is possible that this heterogeneity in recombination rates and other events can produce a signal using our statistic. One such scenario is where the two breakpoints represent gene conversion hotspots while there is no recombination across the entire region. Gene conversion events would reduce short-range LD, while absence of recombination would maintain long-range associations.
From a computational perspective, our method represents a novel strategy for using population data for detecting large rearrangements. It is becoming increasingly cost-effective to generate genome-wide SNP genotype data, and our method can be applied to any such data. Other strategies have been suggested for computationally mining SNP data for potential inversions. Inversion polymorphisms have been extensively investigated for Drosophila, and it has been observed that the presence of inversion polymorphisms leads to strong and extended LD across the inverted region since recombination in inversion heterozygotes is suppressed (Navarro et al. 2000; Andolfatto et al. 2001; Navarro and Gazave 2005). This reduces the overall recombination rate in the region and also tends to produce two divergent haplotype clades (Navarro et al. 1997; Andolfatto et al. 2001). The best known example of this effect in the human genome is the 900-kb polymorphic inversion on chromosome 17 (Stefansson et al. 2005). However, it remains to be seen if this pattern is true of all (or most) human inversion polymorphisms. In fact, our analysis of haplotype patterns of the few known inversion polymorphisms does not indicate that all inversion polymorphisms lead to such distinctive haplotype patterns (data not shown).
Our results also indicate that many large inversion polymorphisms remain to be discovered in the human genome, and it may require extensive re-sequencing in multiple populations to find all such inversions. The presence of a large number of inversion polymorphisms could have major implications for evolution of the human genome. Inversions are known to directly suppress recombination in inversion heterozygotes. The lowering of recombination between inversion heterozygotes may also create effects similar to population substructure even without geographic isolation of the individuals. Characterization of inversion variants in human populations will be required to determine to what extent large inversions affect the recombination landscape of the human genome. Inversions could also represent an alternative mechanism for creating diversity in gene regulation and splice isoforms. Such variation may also influence phenotypes and associations with diseases.
Methods
Haplotype data
We used genotype data from Phase I of the International HapMap Project consisting of 269 individuals genotyped on ∼1 million SNPs. These individuals consist of 30 trios from the Utah, USA region (CEU); 30 trios from Ibadan, Nigeria (YRI); 44 unrelated individuals from Tokyo, Japan (JPT); and 45 Han Chinese individuals from the Beijing area (CHB). Since the JPT and CHB populations are genetically similar, we pooled the data from these two populations to obtain a larger analysis panel of 89 individuals. For the CEU and YRI analysis panels, we used the 60 unrelated parents from the respective populations. We analyzed each of the three analysis panels: CEU, YRI, and CHB + JPT separately. We used the phased haplotype data for these analysis panels (HapMap data release #16 available at http://www.hapmap.org/downloads/phasing/2005-03_phaseI/full/). Since the SNPs in this data were ordered based on the NCBI Build 34 (hg16) assembly of the human genome, all our results are with respect to NCBI Build 34 assembly. We used the phased data since it is difficult to detect long-range LD without phasing information. The phasing is highly accurate for the CEU and the YRI analysis panels because of the presence of trio information. For the JPT and CHB populations, in the absence of trios, the haplotype phasing is less accurate (a switch error every 0.34 Mb) (The International HapMap Consortium 2005). This can destroy long-range LD, thereby potentially reducing the power of our method to detect inversions in the CHB + JPT analysis panel.
Defining multi-SNP markers
For each analysis panel, all SNPs with a minor allele frequency smaller than 0.1 in the analysis panel were discarded since they are less informative about LD patterns. After this filtering, we selected a multimarker SNP block for every remaining SNP as follows. For each SNP S, we considered all SNPs in the genomic region L(S) . . . L(S) + W, where L(S) is the genomic location of SNP S, and W is the window size. If this window had less than k SNPs, it was discarded. For any k SNPs, an individual sequence is described by a haplotype of length k, induced by the allelic values of the k SNPs. Denote the set of haplotypes as A1,A2, . . . , with frequencies p1,p2, . . . , respectively. For each window, we chose a subset of k SNPs that maximize the entropy of the haplotypes (−∑ip1logp1) defined by any subset of k SNPs. The subset of SNPs with maximum entropy best captures the haplotype diversity of the window and is potentially most effective for measuring LD with other multiallelic SNP markers. These k SNPs defined a multi-SNP marker with a left and right physical boundary defined by the physical location of the first and k-th SNP. The average SNP density of the HapMap analysis panels is about one SNP (with MAF ≥ 0.1) per 5–6 kb (across different chromosomes). The parameters k and W were chosen to be 3 and 18 kb, respectively, based on this SNP density. The results are not greatly affected by increasing or decreasing W by a few kilobases. Simulations indicate that the power to detect inversions is smaller for k = 4 as compared to k = 3.
Computing LD
LD between two multi-SNP markers was computed using the multiallelic version of D′ (Lewontin 1964). Let A and B denote two blocks with haplotypes A1,A2, . . . and B1,B2, . . . , respectively. Let pi (qj) denote the frequency of haplotype Ai (Bj). Define Dij = hij − piqj, where hij is the frequency of the haplotype AiBj. The extent of LD between each pair of haplotypes is defined as
where
 |
The overall measure of LD between A and B is
We computed the LD measure between all pairs of multi-SNP markers on a chromosome (defined above) within a certain maximum distance. Using these LD values for the 22 autosomes, we obtained probability distribution curves of LD at a fixed distance d, denoted as ϕd. The X chromosome was excluded since it has a reduced recombination rate as compared to the autosomes.
The inversion statistic
Consider a pair of breakpoints where B1 and B2 denote two blocks on either side of the left inversion breakpoint and B3 and B4 are the blocks of SNPs spanning the other inversion breakpoint (see Fig. 1). We compute a pair of log-likelihood ratios, one for each inversion breakpoint, that represent the log of the ratio of the probability of the region being inverted in the population versus being noninverted. Let LDij denote the LD between blocks i and j, and dij denote the corresponding distance. The log-likelihood ratio for the left breakpoint is defined as
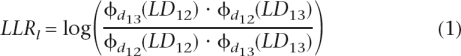 |
Similarly, the log-likelihood ratio for the right inversion breakpoint is defined as
 |
If the pair of breakpoints represents inversion breakpoints (with the inverted allele having high frequency), we would expect the long-range LD (LD13 and LD24) to be stronger than the short-range LD (LD12 and LD34) and both log likelihood ratios to be positive. However, most measures of LD, including D′, show some dependence on allele frequencies. Therefore, even in the absence of an inversion, the log-likelihood ratios could be positive (because of the long-range LD being larger in magnitude than the short-range LD just by chance). Therefore, we estimate the significance of the two log-likelihood ratios using a permutation test. For a pair of breakpoints denoted by (l1,l2) and (r1,r2), we permute the haplotypes inside the inverted region (from the block l2 to r1). The two log-likelihood ratios are computed for this permutation, and the P-value is defined as the fraction of permutations for which at least one of the two log-likelihood ratios is greater than its corresponding original value. We use 10,000 permutations to compute each P-value. Using simulations, we found the P-value to have much better specificity and almost equal sensitivity at detecting inversions as compared to the log-likelihood ratios. Therefore, we use the P-value for a pair of breakpoints as our statistic for the presence of an inversion. The P-value for the log-likelihood ratios cannot be interpreted as a typical P-value; it estimates the chance that at least one of the two log-likelihood ratios would achieve the corresponding computed value even if there were no LD between the blocks.
Identifying potential inversions
For every chromosome, we considered the region between every pair of adjacent SNPs as a potential breakpoint. If a pair of adjacent SNPs showed high correlation using the r2 measure (a cutoff of r = 0.6 was used), the region in between is highly unlikely to be a breakpoint and was excluded. For every breakpoint, we choose a multi-SNP marker to the left of the breakpoint and another one to the right of the breakpoint (these were chosen to be the physically closest multi-SNP markers to the breakpoint from the set of multi-SNP markers defined previously). Each breakpoint is reported as a pair of genomic coordinates corresponding to the right physical boundary of the multi-SNP marker closest to the left of the breakpoint and the left physical boundary of the multi-SNP marker closest to the right of the breakpoint. For every pair of breakpoints within a certain maximum distance, we computed the two log-likelihood ratios and the corresponding P-value. All pairs of breakpoints with low P-value are considered as potential candidates for inverted regions. A predicted inversion is reported as a 4-tuple (l1,l2,r1,r2) corresponding to a pair of left (l1,l2), and right (r1,r2) breakpoints.
For analysis of the HapMap data, we ignored pairs of breakpoints within 200 kb of each other since considerable LD is observed at short distances in the HapMap data and power simulations also indicate that our method has low power to detect inversions of small length. Our results for the estimation of the false-positive rate indicated that there was some enrichment for true positives in the predicted inversions with P-value smaller than 0.02. Therefore we choose a P-value cutoff of 0.02 for generating the predicted inversions. We also limit the size of the largest predicted inversion that we consider to 4 Mb. The largest known polymorphic inversion in the human genome is ∼4.5 Mb in length (Genome Variation Database at http://projects.tcag.ca/variation/). Also, the distribution of the length of the predicted inversions suggests that predicted inversions >4 Mb represent false positives rather than true inversions. All pairs of predicted inversion breakpoints with length in the range 200 kb–4 Mb and with a P-value of 0.02 or smaller were enumerated for each chromosome in the three HapMap analysis panels. For each analysis panel and chromosome, we clustered the predicted inversions based on the physical location of the breakpoints. For two predicted inversions (l1,l2,r1,r2) and (p1,p2,q1,q2), if the segment (l1,l2) and (p1,p2) overlapped and similarly if (r1,r2) and (q1,q2) overlapped, these two predicted inversions were grouped together. After clustering, we had 215 predicted inversions in the three analysis panels. For every cluster, we report the pair of inversion breakpoints with the smallest P-value. In order to further reduce potential false positives, we removed predicted inversions for which there was strong LD between the block to the left of the left breakpoint (block 1 in Fig. 1) and the block to the right of the right breakpoint (P-value of the multiallelic LD smaller than 0.02). The final list of 176 predicted inversions is presented in Supplemental Table S1(for the P-value distribution of these predicted inversions, see Fig. 8).
Figure 8.

The P-value distribution for predicted inversions having P-value ≤0.02.
Simulating inversions
It is straightforward to simulate an inversion with frequency f = 1; however, to the best of our knowledge, there is no existing program that can simulate human population data accommodating polymorphisms. The effect of decreasing the frequency of the inverted haplotype (on our statistic) is to essentially decrease the strength of long-range LD and increase short-range LD. Hence, we adopted a simple simulation strategy that could mimic this effect of the inversion frequency on our statistic directly. For a given chromosome, we chose at random two SNPs S and E that define the region with the inversion polymorphism. Let 1,2 . . . s denote the SNPs in this chosen region. To simulate an inversion with frequency f = 1, we just flip the values of the alleles at SNPs i and s + 1 − i, for all 1 ≤ i ≤ s/2 for all haplotypes. In order to simulate an inversion of frequency f (0 < f < 1), we randomly select a subset of haplotypes of size f × n, where n is the total number of haplotypes. For every haplotype in this set, we simply flip the values of the alleles at SNPs i and s + 1 − i, for all 1 ≤ i ≤ s/2. Notice that this may have the effect of combining the alleles at two different SNPs.
We used the phased haplotype data from the International HapMap project to simulate inversions. In order to simulate an inversion of given length, we choose one breakpoint randomly and the second breakpoint using the length of the inversion. After planting the inversions, we scan the chromosome for regions with low P-value for the log-likelihood ratios. A simulation inversion is considered to be detected if the predicted inversion (l1,l2,r1,r2) has the property that the interval (l1,l2) overlaps the left endpoint of the inversion and (r1,r2) overlaps the right endpoint. Power is defined as the fraction of simulated inversions that are detected. Each point in the power plots is based on simulating ∼500 inversions.
Sequence analysis
We used the RepeatMasked June 2003 (NCBI Build 34) human genome sequence from the UCSC (University of California, Santa Cruz) Human Genome Browser Web site for analyzing the inversion breakpoints. For each predicted inversion, the genomic sequence in the window [l1 − 200000 . . . l2 + 200000] was BLASTed against the sequence in the window [r1 − 200000 . . . r2 + 200000] to find pairs of homologous sequences. Only hits with an e-value <10−25 and length at least 100 bp were considered. We also removed pairs of homologous sequences that were <100 kb apart. The statistical significance of the number of inversion breakpoints flanked by a pair of inverted repeats was estimated empirically as follows. We simulated 1000 random lists of inversions and computed the number of inversions with a pair of inverted repeats. Each random list of inversions was generated by shifting each predicted inversion (on the HapMap analysis panels) to a random location on the same chromosome on which it was detected. The P-value was estimated to be 0.006 using this method. Additionally, we observed that the length of the inverted repeats for many of the predicted inversions was generally much longer than those for the random lists.
Analysis of genes near inversion breakpoints was performed using the UCSC KnownGenes II list from the UCSC Genome Browser. A gene was defined to cover an inversion breakpoint, if the transcriptional start position of the gene was before the left boundary of the breakpoint and the transcriptional end location after the right boundary of the breakpoint. In order to assess the statistical significance of the number of inversion breakpoints covered by one or more genes, we used an empirical method similar to the one used above for inverted repeats. We simulated 1000 random lists of inversions and computed the number of genes covering breakpoints for each list.
Coalescent simulations
We simulated population data using the Cosi program (Schaffner et al. 2005), which implements a coalescent model similar to the MS program (Hudson 1990) but allowing for complex demographic histories and variable recombination rates. We used the bestfit model, which has been calibrated using genome-wide human population data for different populations. The bestfit model uses the large-scale variation in recombination rates obtained from the deCODE genetic map along with fine-scale variation in recombination rates. We used the default parameters of this model, which are listed in Table 1 of the paper describing the method (Schaffner et al. 2005). The program generates data for four populations, each with its own demographic scenario. We used the data for three of the populations: West African, European, and East Asian. These three populations were considered as proxies for the YRI, CEU, and CHB + JPT analysis panels, respectively, from the International HapMap project. We matched each HapMap analysis panel to the corresponding simulated analysis panel in the number of chromosomes. We did not model SNP ascertainment bias (present in the HapMap analysis panels) for the simulated data since it is unlikely to affect our results, as we discard SNPs with low minor allele frequency (<0.1). We generated 100 data sets of length 20 Mb (it is computationally infeasible to generate chromosomal length regions using the Cosi program) for each of the three analysis panels. We simulated data with a fixed number of SNPs and then thinned the SNPs so that the average SNP density (for SNPs with minor allele frequency ≥0.1) matched that of the HapMap data.
Acknowledgments
We thank Evan Eichler and Eray Tuzun for providing the complete list of discordant fosmid pair sequences; Brian Walenz for performing the sequence comparison of the Celera genome assembly to the Build 34 assembly; the UCSD FWGrid project for providing computational resources; and the International HapMap Consortium for generating this data and making it publicly available.
Footnotes
[Supplemental material is available online at www.genome.org.]
Article published online before print. Article and publication date are at http://www.genome.org/cgi/doi/10.1101/gr.5774507
Some of these regions correspond to two predicted inversions.
References
- Andolfatto P., Depaulis F., Navarro A., Depaulis F., Navarro A., Navarro A. Inversion polymorphisms and nucleotide variability in Drosophila. Genet. Res. 2001;77:1–8. doi: 10.1017/s0016672301004955. [DOI] [PubMed] [Google Scholar]
- Bagnall R.D., Waseem N., Green P.M., Giannelli F., Waseem N., Green P.M., Giannelli F., Green P.M., Giannelli F., Giannelli F. Recurrent inversion breaking intron 1 of the factor VIII gene is a frequent cause of severe hemophilia A. Blood. 2002;99:168–174. doi: 10.1182/blood.v99.1.168. [DOI] [PubMed] [Google Scholar]
- Conrad D., Andrews T., Carter N., Hurles M., Pritchard J., Andrews T., Carter N., Hurles M., Pritchard J., Carter N., Hurles M., Pritchard J., Hurles M., Pritchard J., Pritchard J. A high-resolution survey of deletion polymorphism in the human genome. Nat. Genet. 2006;38:75–81. doi: 10.1038/ng1697. [DOI] [PubMed] [Google Scholar]
- Crawford D., Bhangale T., Li N., Hellenthal G., Rieder M., Nickerson D., Stephens M., Bhangale T., Li N., Hellenthal G., Rieder M., Nickerson D., Stephens M., Li N., Hellenthal G., Rieder M., Nickerson D., Stephens M., Hellenthal G., Rieder M., Nickerson D., Stephens M., Rieder M., Nickerson D., Stephens M., Nickerson D., Stephens M., Stephens M. Evidence for substantial fine-scale variation in recombination rates across the human genome. Nat. Genet. 2004;36:700–706. doi: 10.1038/ng1376. [DOI] [PubMed] [Google Scholar]
- Deutz-Terlouw P.P., Losekoot M., Olmer R., Pieneman W.C., de Vries-v d Weerd S., Briët E., Bakker E., Losekoot M., Olmer R., Pieneman W.C., de Vries-v d Weerd S., Briët E., Bakker E., Olmer R., Pieneman W.C., de Vries-v d Weerd S., Briët E., Bakker E., Pieneman W.C., de Vries-v d Weerd S., Briët E., Bakker E., de Vries-v d Weerd S., Briët E., Bakker E., Briët E., Bakker E., Bakker E. Inversions in the factor VIII gene: Improvement of carrier detection and prenatal diagnosis in Dutch haemophilia A families. J. Med. Genet. 1995;32:296–300. doi: 10.1136/jmg.32.4.296. [DOI] [PMC free article] [PubMed] [Google Scholar]
- Feuk L., Macdonald J., Tang T., Carson A., Li M., Rao G., Khaja R., Scherer S.,, Macdonald J., Tang T., Carson A., Li M., Rao G., Khaja R., Scherer S.,, Tang T., Carson A., Li M., Rao G., Khaja R., Scherer S.,, Carson A., Li M., Rao G., Khaja R., Scherer S.,, Li M., Rao G., Khaja R., Scherer S.,, Rao G., Khaja R., Scherer S.,, Khaja R., Scherer S.,, Scherer S., Discovery of human inversion polymorphisms by comparative analysis of human and chimpanzee DNA sequence assemblies. PLoS Genet. 2005;1 doi: 10.1371/journal.pgen.0010056. e56. [DOI] [PMC free article] [PubMed] [Google Scholar]
- Gaedigk R., Karges W., Hui M.F., Scherer S.W., Dosch H.M., Karges W., Hui M.F., Scherer S.W., Dosch H.M., Hui M.F., Scherer S.W., Dosch H.M., Scherer S.W., Dosch H.M., Dosch H.M. Genomic organization and transcript analysis of ICAp69, a target antigen in diabetic autoimmunity. Genomics. 1996;38:382–391. doi: 10.1006/geno.1996.0641. [DOI] [PubMed] [Google Scholar]
- Giglio S., Broman K., Matsumoto N., Calvari V., Gimelli G., Neumann T., Ohashi H., Voullaire L., Larizza D., Giorda R., Broman K., Matsumoto N., Calvari V., Gimelli G., Neumann T., Ohashi H., Voullaire L., Larizza D., Giorda R., Matsumoto N., Calvari V., Gimelli G., Neumann T., Ohashi H., Voullaire L., Larizza D., Giorda R., Calvari V., Gimelli G., Neumann T., Ohashi H., Voullaire L., Larizza D., Giorda R., Gimelli G., Neumann T., Ohashi H., Voullaire L., Larizza D., Giorda R., Neumann T., Ohashi H., Voullaire L., Larizza D., Giorda R., Ohashi H., Voullaire L., Larizza D., Giorda R., Voullaire L., Larizza D., Giorda R., Larizza D., Giorda R., Giorda R., et al. Olfactory receptor-gene clusters, genomic-inversion polymorphisms, and common chromosome rearrangements. Am. J. Hum. Genet. 2001;68:874–883. doi: 10.1086/319506. [DOI] [PMC free article] [PubMed] [Google Scholar]
- Hedrick P.W. Gametic disequilibrium measures: Proceed with caution. Genetics. 1987;117:331–341. doi: 10.1093/genetics/117.2.331. [DOI] [PMC free article] [PubMed] [Google Scholar]
- Hudson R.R. Gene genealogies and the coalescent process. In: Futuyma D., Antonovics J., Antonovics J., editors. Oxford surveys in evolutionary biology. Vol. 7. Oxford University Press; Oxford: 1990. pp. 1–44. [Google Scholar]
- Iafrate A.J., Feuk L., Rivera M.N., Listewnik M.L., Donahoe P.K., Qi Y., Scherer S.W., Lee C., Feuk L., Rivera M.N., Listewnik M.L., Donahoe P.K., Qi Y., Scherer S.W., Lee C., Rivera M.N., Listewnik M.L., Donahoe P.K., Qi Y., Scherer S.W., Lee C., Listewnik M.L., Donahoe P.K., Qi Y., Scherer S.W., Lee C., Donahoe P.K., Qi Y., Scherer S.W., Lee C., Qi Y., Scherer S.W., Lee C., Scherer S.W., Lee C., Lee C. Detection of large-scale variation in the human genome. Nat. Genet. 2004;36:949–951. doi: 10.1038/ng1416. [DOI] [PubMed] [Google Scholar]
- The International HapMap Consortium, The International HapMap Project. Nature. 2003;426:789–796. doi: 10.1038/nature02168. [DOI] [PubMed] [Google Scholar]
- The International HapMap Consortium, A haplotype map of the human genome. Nature. 2005;437:1299–1320. doi: 10.1038/nature04226. [DOI] [PMC free article] [PubMed] [Google Scholar]
- International Human Genome Sequencing Consortium, Initial sequencing and analysis of the human genome. Nature. 2001;409:860–921. doi: 10.1038/35057062. [DOI] [PubMed] [Google Scholar]
- Istrail S., Sutton G.G., Florea L., Halpern A.L., Mobarry C.M., Lippert R., Walenz B., Shatkay H., Dew I., Miller J.R., Sutton G.G., Florea L., Halpern A.L., Mobarry C.M., Lippert R., Walenz B., Shatkay H., Dew I., Miller J.R., Florea L., Halpern A.L., Mobarry C.M., Lippert R., Walenz B., Shatkay H., Dew I., Miller J.R., Halpern A.L., Mobarry C.M., Lippert R., Walenz B., Shatkay H., Dew I., Miller J.R., Mobarry C.M., Lippert R., Walenz B., Shatkay H., Dew I., Miller J.R., Lippert R., Walenz B., Shatkay H., Dew I., Miller J.R., Walenz B., Shatkay H., Dew I., Miller J.R., Shatkay H., Dew I., Miller J.R., Dew I., Miller J.R., Miller J.R., et al. Whole-genome shotgun assembly and comparison of human genome assemblies. Proc. Natl. Acad. Sci. 2004;101:1916–1921. doi: 10.1073/pnas.0307971100. [DOI] [PMC free article] [PubMed] [Google Scholar]
- Kong A., Gudbjartsson D., Sainz J., Jonsdottir G., Gudjonsson S., Richardsson B., Sigurdardottir S., Barnard J., Hallbeck B., Masson G., Gudbjartsson D., Sainz J., Jonsdottir G., Gudjonsson S., Richardsson B., Sigurdardottir S., Barnard J., Hallbeck B., Masson G., Sainz J., Jonsdottir G., Gudjonsson S., Richardsson B., Sigurdardottir S., Barnard J., Hallbeck B., Masson G., Jonsdottir G., Gudjonsson S., Richardsson B., Sigurdardottir S., Barnard J., Hallbeck B., Masson G., Gudjonsson S., Richardsson B., Sigurdardottir S., Barnard J., Hallbeck B., Masson G., Richardsson B., Sigurdardottir S., Barnard J., Hallbeck B., Masson G., Sigurdardottir S., Barnard J., Hallbeck B., Masson G., Barnard J., Hallbeck B., Masson G., Hallbeck B., Masson G., Masson G., et al. A high-resolution recombination map of the human genome. Nat. Genet. 2002;31:241–247. doi: 10.1038/ng917. [DOI] [PubMed] [Google Scholar]
- Lakich D., Kazazian H.H., Antonarakis S.E., Gitschier J., Kazazian H.H., Antonarakis S.E., Gitschier J., Antonarakis S.E., Gitschier J., Gitschier J. Inversions disrupting the factor VIII gene are a common cause of severe haemophilia A. Nat. Genet. 1993;5:236–241. doi: 10.1038/ng1193-236. [DOI] [PubMed] [Google Scholar]
- Lewontin R. The interaction of selection and linkage. II. Optimum models. Genetics. 1964;50:757–782. doi: 10.1093/genetics/50.4.757. [DOI] [PMC free article] [PubMed] [Google Scholar]
- Lupski J.R. Genomic disorders: Structural features of the genome can lead to DNA rearrangements and human disease traits. Trends Genet. 1998;14:417–422. doi: 10.1016/s0168-9525(98)01555-8. [DOI] [PubMed] [Google Scholar]
- McCarroll S., Hadnott T., Perry G., Sabeti P., Zody M., Barrett J., Dallaire S., Gabriel S., Lee C., Daly M., Hadnott T., Perry G., Sabeti P., Zody M., Barrett J., Dallaire S., Gabriel S., Lee C., Daly M., Perry G., Sabeti P., Zody M., Barrett J., Dallaire S., Gabriel S., Lee C., Daly M., Sabeti P., Zody M., Barrett J., Dallaire S., Gabriel S., Lee C., Daly M., Zody M., Barrett J., Dallaire S., Gabriel S., Lee C., Daly M., Barrett J., Dallaire S., Gabriel S., Lee C., Daly M., Dallaire S., Gabriel S., Lee C., Daly M., Gabriel S., Lee C., Daly M., Lee C., Daly M., Daly M., et al. Common deletion polymorphisms in the human genome. Nat. Genet. 2006;38:86–92. doi: 10.1038/ng1696. [DOI] [PubMed] [Google Scholar]
- McVean G., Myers S., Hunt S., Deloukas P., Bentley D., Donnelly P., Myers S., Hunt S., Deloukas P., Bentley D., Donnelly P., Hunt S., Deloukas P., Bentley D., Donnelly P., Deloukas P., Bentley D., Donnelly P., Bentley D., Donnelly P., Donnelly P. The fine-scale structure of recombination rate variation in the human genome. Science. 2004;304:581–584. doi: 10.1126/science.1092500. [DOI] [PubMed] [Google Scholar]
- Myers S., Bottolo L., Freeman C., McVean G., Donnelly P., Bottolo L., Freeman C., McVean G., Donnelly P., Freeman C., McVean G., Donnelly P., McVean G., Donnelly P., Donnelly P. A fine-scale map of recombination rates and hotspots across the human genome. Science. 2005;310:321–324. doi: 10.1126/science.1117196. [DOI] [PubMed] [Google Scholar]
- Navarro A., Gazave E., Gazave E. Inversions with classical style and trendy lines. Nat. Genet. 2005;37:115–116. doi: 10.1038/ng0205-115. [DOI] [PubMed] [Google Scholar]
- Navarro A., Betrán E., Barbadilla A., Ruiz A., Betrán E., Barbadilla A., Ruiz A., Barbadilla A., Ruiz A., Ruiz A. Recombination and gene flux caused by gene conversion and crossing over in inversion heterokaryotypes. Genetics. 1997;146:695–709. doi: 10.1093/genetics/146.2.695. [DOI] [PMC free article] [PubMed] [Google Scholar]
- Navarro A., Barbadilla A., Ruiz A., Barbadilla A., Ruiz A., Ruiz A. Effect of inversion polymorphism on the neutral nucleotide variability of linked chromosomal regions in Drosophila. Genetics. 2000;155:685–698. doi: 10.1093/genetics/155.2.685. [DOI] [PMC free article] [PubMed] [Google Scholar]
- Newman T.L., Tuzun E., Morrison V.A., Hayden K.E., Ventura M., McGrath S.D., Rocchi M., Eichler E.E., Tuzun E., Morrison V.A., Hayden K.E., Ventura M., McGrath S.D., Rocchi M., Eichler E.E., Morrison V.A., Hayden K.E., Ventura M., McGrath S.D., Rocchi M., Eichler E.E., Hayden K.E., Ventura M., McGrath S.D., Rocchi M., Eichler E.E., Ventura M., McGrath S.D., Rocchi M., Eichler E.E., McGrath S.D., Rocchi M., Eichler E.E., Rocchi M., Eichler E.E., Eichler E.E. A genome-wide survey of structural variation between human and chimpanzee. Genome Res. 2005;15:1344–1356. doi: 10.1101/gr.4338005. [DOI] [PMC free article] [PubMed] [Google Scholar]
- Osborne L., Li M., Pober B., Chitayat D., Bodurtha J., Mandel A., Costa T., Grebe T., Cox S., Tsui L., Li M., Pober B., Chitayat D., Bodurtha J., Mandel A., Costa T., Grebe T., Cox S., Tsui L., Pober B., Chitayat D., Bodurtha J., Mandel A., Costa T., Grebe T., Cox S., Tsui L., Chitayat D., Bodurtha J., Mandel A., Costa T., Grebe T., Cox S., Tsui L., Bodurtha J., Mandel A., Costa T., Grebe T., Cox S., Tsui L., Mandel A., Costa T., Grebe T., Cox S., Tsui L., Costa T., Grebe T., Cox S., Tsui L., Grebe T., Cox S., Tsui L., Cox S., Tsui L., Tsui L., et al. A 1.5 million-base pair inversion polymorphism in families with Williams-Beuren syndrome. Nat. Genet. 2001;29:321–325. doi: 10.1038/ng753. [DOI] [PMC free article] [PubMed] [Google Scholar]
- Sampath J., Long P.R., Shepard R.L., Xia X., Devanarayan V., Sandusky G.E., Perry W.L., Dantzig A.H., Williamson M., Rolfe M., Long P.R., Shepard R.L., Xia X., Devanarayan V., Sandusky G.E., Perry W.L., Dantzig A.H., Williamson M., Rolfe M., Shepard R.L., Xia X., Devanarayan V., Sandusky G.E., Perry W.L., Dantzig A.H., Williamson M., Rolfe M., Xia X., Devanarayan V., Sandusky G.E., Perry W.L., Dantzig A.H., Williamson M., Rolfe M., Devanarayan V., Sandusky G.E., Perry W.L., Dantzig A.H., Williamson M., Rolfe M., Sandusky G.E., Perry W.L., Dantzig A.H., Williamson M., Rolfe M., Perry W.L., Dantzig A.H., Williamson M., Rolfe M., Dantzig A.H., Williamson M., Rolfe M., Williamson M., Rolfe M., Rolfe M., et al. Human spf45, a splicing factor, has limited expression in normal tissues, is overexpressed in many tumors, and can confer a multidrug-resistant phenotype to cells. Am. J. Pathol. 2003;163:1781–1790. doi: 10.1016/S0002-9440(10)63538-9. [DOI] [PMC free article] [PubMed] [Google Scholar]
- Schaffner S.F., Foo C., Gabriel S., Reich D., Daly M.J., Altshuler D., Foo C., Gabriel S., Reich D., Daly M.J., Altshuler D., Gabriel S., Reich D., Daly M.J., Altshuler D., Reich D., Daly M.J., Altshuler D., Daly M.J., Altshuler D., Altshuler D. Calibrating a coalescent simulation of human genome sequence variation. Genome Res. 2005;15:1576–1583. doi: 10.1101/gr.3709305. [DOI] [PMC free article] [PubMed] [Google Scholar]
- Sebat J., Lakshmi B., Troge J., Alexander J., Young J., Lundin P., Månér S., Massa H., Walker M., Chi M., Lakshmi B., Troge J., Alexander J., Young J., Lundin P., Månér S., Massa H., Walker M., Chi M., Troge J., Alexander J., Young J., Lundin P., Månér S., Massa H., Walker M., Chi M., Alexander J., Young J., Lundin P., Månér S., Massa H., Walker M., Chi M., Young J., Lundin P., Månér S., Massa H., Walker M., Chi M., Lundin P., Månér S., Massa H., Walker M., Chi M., Månér S., Massa H., Walker M., Chi M., Massa H., Walker M., Chi M., Walker M., Chi M., Chi M., et al. Large-scale copy number polymorphism in the human genome. Science. 2004;305:525–528. doi: 10.1126/science.1098918. [DOI] [PubMed] [Google Scholar]
- Sharp A.J., Locke D.P., McGrath S.D., Cheng Z., Bailey J.A., Vallente R.U., Pertz L.M., Clark R.A., Schwartz S., Segraves R., Locke D.P., McGrath S.D., Cheng Z., Bailey J.A., Vallente R.U., Pertz L.M., Clark R.A., Schwartz S., Segraves R., McGrath S.D., Cheng Z., Bailey J.A., Vallente R.U., Pertz L.M., Clark R.A., Schwartz S., Segraves R., Cheng Z., Bailey J.A., Vallente R.U., Pertz L.M., Clark R.A., Schwartz S., Segraves R., Bailey J.A., Vallente R.U., Pertz L.M., Clark R.A., Schwartz S., Segraves R., Vallente R.U., Pertz L.M., Clark R.A., Schwartz S., Segraves R., Pertz L.M., Clark R.A., Schwartz S., Segraves R., Clark R.A., Schwartz S., Segraves R., Schwartz S., Segraves R., Segraves R., et al. Segmental duplications and copy-number variation in the human genome. Am. J. Hum. Genet. 2005;77:78–88. doi: 10.1086/431652. [DOI] [PMC free article] [PubMed] [Google Scholar]
- Shaw C., Lupski J., Lupski J. Implications of human genome architecture for rearrangement-based disorders: The genomic basis of disease. Hum. Mol. Genet. 2004;13:57–64. doi: 10.1093/hmg/ddh073. [DOI] [PubMed] [Google Scholar]
- Stefansson H., Helgason A., Thorleifsson G., Steinthorsdottir V., Masson G., Barnard J., Baker A., Jonasdottir A., Ingason A., Gudnadottir V., Helgason A., Thorleifsson G., Steinthorsdottir V., Masson G., Barnard J., Baker A., Jonasdottir A., Ingason A., Gudnadottir V., Thorleifsson G., Steinthorsdottir V., Masson G., Barnard J., Baker A., Jonasdottir A., Ingason A., Gudnadottir V., Steinthorsdottir V., Masson G., Barnard J., Baker A., Jonasdottir A., Ingason A., Gudnadottir V., Masson G., Barnard J., Baker A., Jonasdottir A., Ingason A., Gudnadottir V., Barnard J., Baker A., Jonasdottir A., Ingason A., Gudnadottir V., Baker A., Jonasdottir A., Ingason A., Gudnadottir V., Jonasdottir A., Ingason A., Gudnadottir V., Ingason A., Gudnadottir V., Gudnadottir V., et al. A common inversion under selection in Europeans. Nat. Genet. 2005;37:129–137. doi: 10.1038/ng1508. [DOI] [PubMed] [Google Scholar]
- Stephens M., Scheet P., Scheet P. Accounting for decay of linkage disequilibrium in haplotype inference and missing-data imputation. Am. J. Hum. Genet. 2005;76:449–462. doi: 10.1086/428594. [DOI] [PMC free article] [PubMed] [Google Scholar]
- Sugawara H., Harada N., Ida T., Ishida T., Ledbetter D., Yoshiura K., Ohta T., Kishino T., Niikawa N., Matsumoto N., Harada N., Ida T., Ishida T., Ledbetter D., Yoshiura K., Ohta T., Kishino T., Niikawa N., Matsumoto N., Ida T., Ishida T., Ledbetter D., Yoshiura K., Ohta T., Kishino T., Niikawa N., Matsumoto N., Ishida T., Ledbetter D., Yoshiura K., Ohta T., Kishino T., Niikawa N., Matsumoto N., Ledbetter D., Yoshiura K., Ohta T., Kishino T., Niikawa N., Matsumoto N., Yoshiura K., Ohta T., Kishino T., Niikawa N., Matsumoto N., Ohta T., Kishino T., Niikawa N., Matsumoto N., Kishino T., Niikawa N., Matsumoto N., Niikawa N., Matsumoto N., Matsumoto N., et al. Complex low-copy repeats associated with a common polymorphic inversion at human chromosome 8p23. Genomics. 2003;82:238–244. doi: 10.1016/s0888-7543(03)00108-3. [DOI] [PubMed] [Google Scholar]
- Szamalek J.M., Cooper D.N., Schempp W., Minich P., Kohn M., Hoegel J., Goidts V., Hameister H., Kehrer-Sawatzki H., Cooper D.N., Schempp W., Minich P., Kohn M., Hoegel J., Goidts V., Hameister H., Kehrer-Sawatzki H., Schempp W., Minich P., Kohn M., Hoegel J., Goidts V., Hameister H., Kehrer-Sawatzki H., Minich P., Kohn M., Hoegel J., Goidts V., Hameister H., Kehrer-Sawatzki H., Kohn M., Hoegel J., Goidts V., Hameister H., Kehrer-Sawatzki H., Hoegel J., Goidts V., Hameister H., Kehrer-Sawatzki H., Goidts V., Hameister H., Kehrer-Sawatzki H., Hameister H., Kehrer-Sawatzki H., Kehrer-Sawatzki H. Polymorphic micro-inversions contribute to the genomic variability of humans and chimpanzees. Hum. Genet. 2006;119:103–112. doi: 10.1007/s00439-005-0117-6. [DOI] [PubMed] [Google Scholar]
- Tagawa H., Miura I., Suzuki R., Suzuki H., Hosokawa Y., Seto M., Miura I., Suzuki R., Suzuki H., Hosokawa Y., Seto M., Suzuki R., Suzuki H., Hosokawa Y., Seto M., Suzuki H., Hosokawa Y., Seto M., Hosokawa Y., Seto M., Seto M. Molecular cytogenetic analysis of the breakpoint region at 6q21–22 in T-cell lymphoma/leukemia cell lines. Genes Chromosomes Cancer. 2002;34:175–185. doi: 10.1002/gcc.10057. [DOI] [PubMed] [Google Scholar]
- Turner D.J., Shendure J., Porreca G., Church G., Green P., Tyler-Smith C., Hurles M.E., Shendure J., Porreca G., Church G., Green P., Tyler-Smith C., Hurles M.E., Porreca G., Church G., Green P., Tyler-Smith C., Hurles M.E., Church G., Green P., Tyler-Smith C., Hurles M.E., Green P., Tyler-Smith C., Hurles M.E., Tyler-Smith C., Hurles M.E., Hurles M.E. Assaying chromosomal inversions by single-molecule haplotyping. Nat. Methods. 2006;3:439–445. doi: 10.1038/nmeth881. [DOI] [PMC free article] [PubMed] [Google Scholar]
- Tuzun E., Sharp A., Bailey J., Kaul R., Morrison V., Pertz L., Haugen E., Hayden H., Albertson D., Pinkel D., Sharp A., Bailey J., Kaul R., Morrison V., Pertz L., Haugen E., Hayden H., Albertson D., Pinkel D., Bailey J., Kaul R., Morrison V., Pertz L., Haugen E., Hayden H., Albertson D., Pinkel D., Kaul R., Morrison V., Pertz L., Haugen E., Hayden H., Albertson D., Pinkel D., Morrison V., Pertz L., Haugen E., Hayden H., Albertson D., Pinkel D., Pertz L., Haugen E., Hayden H., Albertson D., Pinkel D., Haugen E., Hayden H., Albertson D., Pinkel D., Hayden H., Albertson D., Pinkel D., Albertson D., Pinkel D., Pinkel D., et al. Fine-scale structural variation of the human genome. Nat. Genet. 2005;37:727–732. doi: 10.1038/ng1562. [DOI] [PubMed] [Google Scholar]
- Venter J., Adams M.D., Myers E.W., Li P.W., Mural R.J., Sutton G.G., Smith H.O., Yandell M., Evans C.A., Holt R.A., Adams M.D., Myers E.W., Li P.W., Mural R.J., Sutton G.G., Smith H.O., Yandell M., Evans C.A., Holt R.A., Myers E.W., Li P.W., Mural R.J., Sutton G.G., Smith H.O., Yandell M., Evans C.A., Holt R.A., Li P.W., Mural R.J., Sutton G.G., Smith H.O., Yandell M., Evans C.A., Holt R.A., Mural R.J., Sutton G.G., Smith H.O., Yandell M., Evans C.A., Holt R.A., Sutton G.G., Smith H.O., Yandell M., Evans C.A., Holt R.A., Smith H.O., Yandell M., Evans C.A., Holt R.A., Yandell M., Evans C.A., Holt R.A., Evans C.A., Holt R.A., Holt R.A., et al. The sequence of the human genome. Science. 2001;291:1304–1351. doi: 10.1126/science.1058040. [DOI] [PubMed] [Google Scholar]
- Wall J., Pritchard J., Pritchard J. Haplotype blocks and linkage disequilibrium in the human genome. Nat. Rev. Genet. 2003;4:587–597. doi: 10.1038/nrg1123. [DOI] [PubMed] [Google Scholar]
- Yue Y., Stout K., Grossmann B., Zechner U., Brinckmann A., White C., Pilz D.T., Haaf T., Stout K., Grossmann B., Zechner U., Brinckmann A., White C., Pilz D.T., Haaf T., Grossmann B., Zechner U., Brinckmann A., White C., Pilz D.T., Haaf T., Zechner U., Brinckmann A., White C., Pilz D.T., Haaf T., Brinckmann A., White C., Pilz D.T., Haaf T., White C., Pilz D.T., Haaf T., Pilz D.T., Haaf T., Haaf T. Disruption of TCBA1 associated with a de novo t(1;6)(q32.2;q22.3) presenting in a child with developmental delay and recurrent infections. J. Med. Genet. 2006;43:143–147. doi: 10.1136/jmg.2004.029660. [DOI] [PMC free article] [PubMed] [Google Scholar]