Abstract
The gibbon karyotype is known to be extensively rearranged when compared to the human and to the ancestral primate karyotype. By combining a bioinformatics (paired-end sequence analysis) approach and a molecular cytogenetics approach, we have refined the synteny block arrangement of the white-cheeked gibbon (Nomascus leucogenys, NLE) with respect to the human genome. We provide the first detailed clone framework map of the gibbon genome and refine the location of 86 evolutionary breakpoints to <1 Mb resolution. An additional 12 breakpoints, mapping primarily to centromeric and telomeric regions, were mapped to ∼5 Mb resolution. Our combined FISH and BES analysis indicates that we have effectively subcloned 49 of these breakpoints within NLE gibbon BAC clones, mapped to a median resolution of 79.7 kb. Interestingly, many of the intervals associated with translocations were gene-rich, including some genes associated with normal skeletal development. Comparisons of NLE breakpoints with those of other gibbon species reveal variability in the position, suggesting that chromosomal rearrangement has been a longstanding property of this particular ape lineage. Our data emphasize the synergistic effect of combining computational genomics and cytogenetics and provide a framework for ultimate sequence and assembly of the gibbon genome.
Hominidae (humans and great apes) and, to a lesser extent, Old World monkeys, possess karyotypes closely resembling the hypothetical hominoid ancestor. Most evolutionary chromosomal rearrangements between ape lineages involve pericentric (including the centromere) or paracentric (not including the centromere) inversions (Yunis and Prakash 1982). In contrast, comparative studies of gibbons (small apes, family Hylobatidae) indicate that the karyotypes of all 12 (or more) species appear highly derived, with an unusually large number (n > 40) of chromosomal fissions and translocations (Jauch et al. 1992; Koehler et al. 1995a, b; Muller and Wienberg 2001; Murphy et al. 2001; Nie et al. 2001; Muller et al. 2002, 2003; Ferguson-Smith et al. 2005; Froenicke 2005). Their chromosomal numbers range from 2n = 38 (hoolock gibbons) to 2n = 52 (Nomascus) and differ from other ape lineages in showing an accelerated rate of chromosomal translocation during evolution.
Gibbons, then, provide a unique perspective of a highly rearranged ape genome with two major advantages: (1) neutrally evolving DNA shows a relatively short genetic distance (<0.05 substitutions/site) to the high-quality human reference sequence; and (2) the gibbon represents a phylogenetic link between the great apes and the Old World monkeys, providing a unique perspective of evolutionary change between 15 and 20 million years of species separation (Goodman 1999). The evolutionary relatedness of human and gibbon species facilitates cross-species FISH experiments and comparative sequence analyses to provide exquisite resolution in refining evolutionary breakpoints of chromosomal rearrangement. In this study, we combine both a cytogenetics and a genomic clone (BAC) paired-end sequence approach to refine the locations of the breakpoints that result in the largest chromosome rearrangement events between human and the white-cheeked gibbon (Nomascus leucogenys, NLE). In light of the large number of rearrangements between gibbon and other primates, this experimentally validated map will be important for the anticipated sequence and assembly of the gibbon genome.
Results
Two complementary approaches were undertaken to resolve the organization of the gibbon genome with respect to the human genome. First, we developed a FISH-based framework to define the major synteny relationships between all gibbon and human chromosomes, using data provided by interspecies chromosome painting analysis as a starting point. We selected ∼500 index human BAC clones at an average density of 1 clone every 6 Mb across the human sequence map and hybridized each against metaphase chromosome preparations of the white-cheeked gibbon. Reiterative FISH experiments were then performed to further refine the interval, using ∼450 additional BAC clones; in many cases identifying a large insert BAC clone that spanned a breakpoint. The analysis established a total of 121 homologous syntenic blocks between the two species, defining the approximate locations of 107 breakpoints. These included 98 breaks mapping within interstitial euchromatin and the delineation of nine human telomeres that are not telomeric in gibbon.
As a second approach, we constructed a comparative clone map between the gibbon and human genomes by mapping the end sequences of an NLE gibbon large-insert BAC library against the human genome reference sequence assembly (Fujiyama et al. 2002; Newman et al. 2005; Tuzun et al. 2005). Briefly, we generated paired end sequences from the genomic inserts of 133,975 randomly selected gibbon BAC clones, yielding 188 Mb of gibbon whole-genome shotgun sequence (http://www.ncbi.nih.gov/Traces/trace.cgi). We then mapped all gibbon end-sequence pairs against the human genome reference assembly (May 2004), classifying each clone as discordant or concordant by length, map position, and orientation (Supplemental Fig. 1; see Supplemental Methods for details). In total, 91,554 gibbon BACs mapped unambiguously to best locations in the human genome, providing 94.2% coverage of all euchromatic sequence (2,715,686,266/2,930,637,601 bp). Of these, 85,204 (93.1%) were concordant, and 6390 (6.9%) were discordant. We further classified discordant pairs based on the nature of the discrepancy: 1181 pairs were too large (potential deletions in the gibbon genome), 1150 were too small (potential insertions), 1517 pairs showed an incorrect orientation with respect to the human genome (potential inversions), and 2542 mapped end sequences between nonhomologous chromosomes. The latter category, termed interchromosomal pairs, identifies either lineage-specific segmental duplications or evolutionary breakpoints associated with rearranged chromosomes.
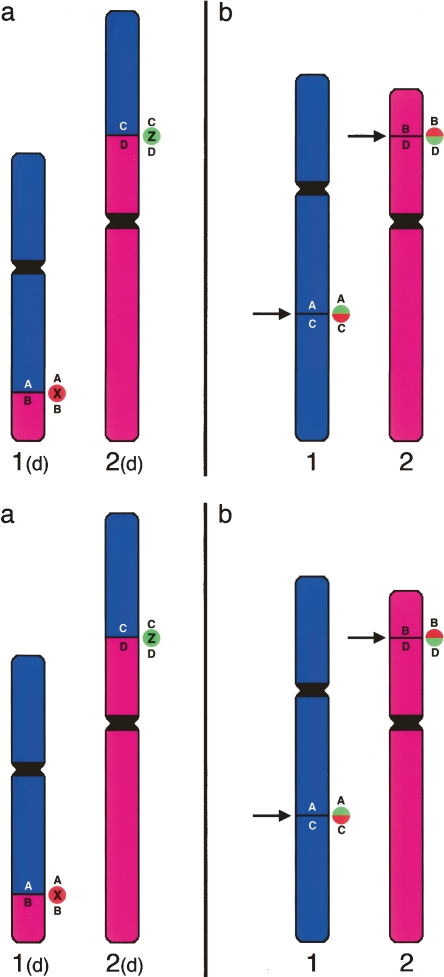
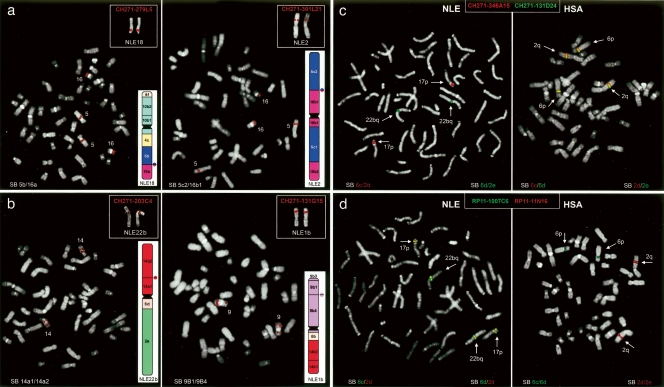
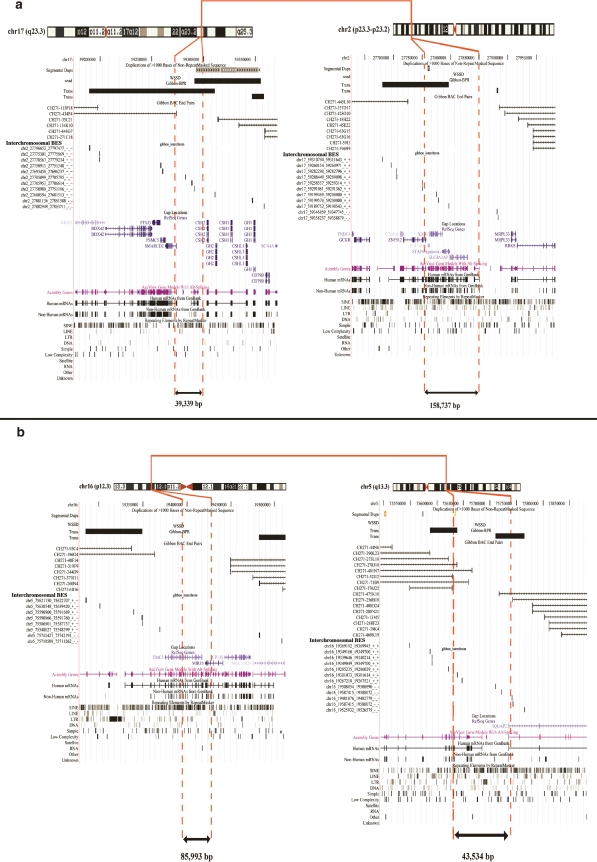
Putative rearrangements were computationally inferred when two or more independent discordant BAC clones supported the same type of rearrangement at a genomic position. We identified a total of 201 putative insertion/deletion (<1 Mb in length), 126 inversion, and 124 interchromosomal rearrangement breakpoints (Supplemental Table 1). We focused on validation of the largest (>1 Mb) inversion and of interchromosomal rearrangement events (breakpoints = 107) using a reciprocal FISH assay (Nickerson and Nelson 1998; Supplemental Fig. 2). NLE BACs corresponding to the breakpoint were selected and hybridized to human and gibbon metaphases. If a breakpoint had been successfully subcloned, the FISH assay would produce a single signal in gibbon in contrast to a split signal in human metaphases (Fig. 1; examples in Fig. 2a). Based on the coordinates of the breakpoint, the human BAC clones corresponding to the two human locations were then tested, and a site was considered validated if reciprocal FISH results were produced and if flanking BACs yielded consistent results (Fig. 2b). FISH results showed that several of the apparently computationally distinct breakpoints actually correspond to the same evolutionary rearrangement event (see Supplemental Table 1). For example, discordant BAC end-sequence pairs might predict two distinct regions of rearrangement that map within close proximity (Fig. 3, see BPR black bars), that when tested by overlapping clones predict the same breakpoint.
Figure 1.
Methodology to detect breakpoints by FISH. (a) Hypothetical gibbon chromosomes 1(d) and 2(d) are the derivatives of a translocation. The original human chromosomes are reported in b. The arrows indicate the breakpoints. Gibbon clones X or Z, spanning the breakpoints of chromosomes 1(d) and 2(d), respectively, contain a portion of both chromosomes 1 and 2. Both clones X and Z generate a “split signal” on the original human chromosomes. If cohybridized in different colors (red and green in the example), they will produce two distinct red and green signals on gibbon, but will produce split signals in humans that, because of proximity, will appear yellow (see Fig. 2).
Figure 2.
Experimental validation of gibbon–human chromosomal rearrangements. (a) Examples of interchromosomal rearrangement. Two gibbon clones, BACs CH271–279L5 (left) and CH271–301L21 (right), whose end sequences aligned to different human chromosomes, are hybridized to human and gibbon metaphases (NLE metaphase in the upper right-hand corner). The FISH assays show split signals in human and a single signal in gibbon, confirming that the two BACs span the 5b/16a and 5c2/16b1 breakpoints, respectively. (b) Two examples of intrachromosomal rearrangements. Gibbon BACs CH271–203C4 (left) and CH271–131G15 (right) span the 14a1/14a2 and 9b1/9b4 junctions, respectively, yielding split signals in human metaphases, but single signals in gibbon. (c) Cohybridization FISH experiments of gibbon BACs CH271–346A15 (red) and CH271–131D24 (green) against gibbon (left) and humans (right) metaphases. The two BACs span the junctions 6c/2d and 6d/2e, respectively. In humans, the two BACs span the breakpoint region in gibbon, as shown by the yellow color representing the fusion of red and green signals. (d) A reciprocal assay wherein human BACs spanning the 6c/6d and 2d/2e breakpoints (RP11–1007C6 and RP11–11N16, respectively) were hybridized on human (right) and gibbon (left) metaphases. In gibbon, these BACs span the regions that face each other on NLE chromosomes 17 and 22b, and therefore produce a yellow signal. (SB) Synteny break.
Figure 3.
Molecular refinement of breakpoints by paired-end-sequence mapping. Regions that were confirmed both experimentally and computationally were further refined by consideration of discordant and concordant Nomascus leucogenys BES mapped to the human genome. Two translocation intervals are depicted by incorporating data into the UCSC Browser. (a) 17q23.3 to 2p23.3 rearrangement breakpoints and (b) 16p12.3 to 5q13.3 rearrangement. Interchromosomal NLE BES pairs (interchromosomal BES with coordinates to another chromosome) delineate the location of the breakpoint region (black bars), while concordant NLE BES (Gibbon BAC end pairs) further define the interval of the rearrangement breakpoints (red dotted lines). All underlying BES mapping data are available at http://humanparalogy.gs.washington.edu.
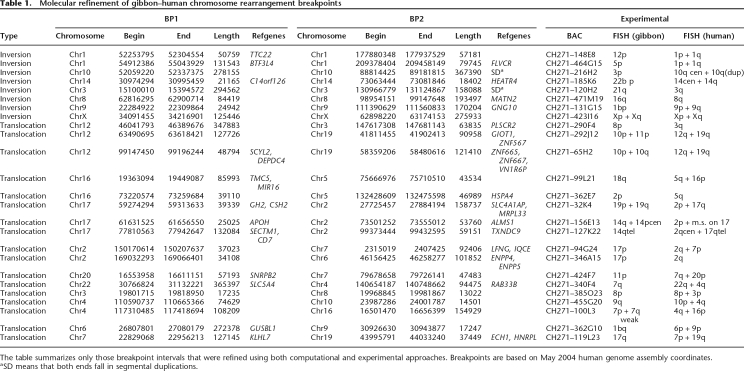
Using this approach, we confirmed experimentally and computationally 50 evolutionary chromosomal breakpoints corresponding to eight inversions and 17 translocations between the human and NLE gibbon genomes (Table 1). In addition to these 50 breakpoints, we identified eight computational breakpoints where only one of the two ends of the rearrangement could be confirmed experimentally. These frequently mapped to regions enriched for highly repetitive regions of the genome where neither FISH nor computational methods could accurately refine the breakpoint regions. We note that 25% (26/103) of our computationally predicted locations showed multisite locations enriched in subtelomeric and pericentromeric regions, indicative of lineage-specific duplication differences between the two genomes.
Table 1.
Molecular refinement of gibbon–human chromosome rearrangement breakpoints
The table summarizes only those breakpoint intervals that were refined using both computational and experimental approaches. Breakpoints are based on May 2004 human genome assembly coordinates.
aSD means that both ends fall in segmental duplications.
We constructed a mySQL database of gibbon concordant, discordant and interchromosomal BES and incorporated the results as customized tracks on the human genome assembly (http://humanparalogy.gs.washington.edu). This allowed experimentally validated regions to be curated in more detail (Fig. 3). For example, a translocation breakpoint between the human and gibbon genomes should be conspicuous by the absence of concordant gibbon BES across an interval in addition to interchromosomal pairs abutting the actual breakpoint. Based on the extent of concordant and discordant BAC clones near each breakpoint, we further refined the breakpoint locations for 49 of the 50 regions. We determined that the median interval distance was 79.7 kb with some breakpoints refined to a distance of 13–14 kb. At this level of resolution, we found no definitive evidence of a gene disruption, although many of the breakpoints will require additional resolution by DNA sequencing.
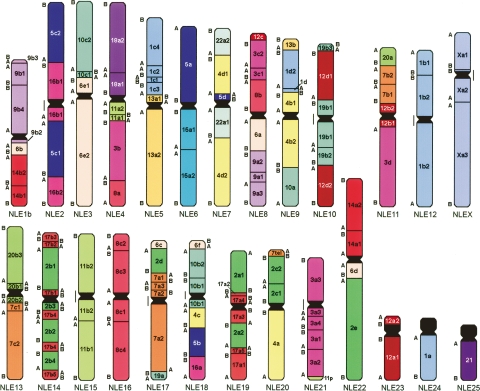
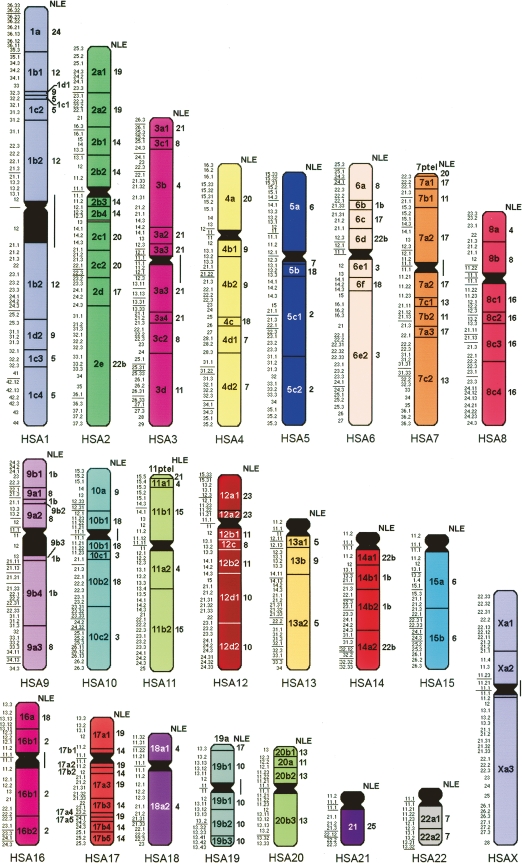
Almost half of the breakpoints were not confirmed by computational placement of gibbon BACs against the human genome. Indeed, in 18 cases, the break mapped to a gibbon centromere, while nine homologous syntenic block breaks corresponded to the position of a new telomere. In this respect it is interesting that 15 out of 26 gibbon centromeres join homologous syntenic blocks that are noncontiguous in humans. A detailed synteny map that summarizes the refinement of the breakpoints from the perspective of human and NLE gibbon chromosome organization is provided (Supplemental Tables 2 and 3, respectively; the organization of each NLE chromosome is also displayed at http://www.biologia.uniba.it/gibbon). Figures 4 and 5 provide a graphical summary of the synteny block organization in gibbon and human genomes, respectively. In both figures the homologous syntenic block numbering was derived from the hypothesized ancestral Hominoidea chromosomal arrangement reported by Muller et al. (2003)
Figure 4.
N. leucogenys synteny block organization with respect to human (for details, see http://www.biologia.uniba.it/gibbon).
Figure 5.
Human chromosomes synteny block organization with respect to NLE (for details, see http://www.biologia.uniba.it/gibbon).
Discussion
We provide the first detailed clone framework map of the gibbon genome and refine the location of 86 evolutionary breakpoints to <1 Mb resolution. An additional 12 breakpoints, mapping primarily to centromeric and telomeric regions, were mapped to ∼5 Mb resolution. Our combined FISH and BES analysis indicates that we have effectively subcloned 49 of these breakpoints within NLE gibbon BAC clones mapped to a median resolution of 79.7 kb. Interestingly, several of the intervals were gene-rich (Table 1), containing conserved genes such as matrilin-2 (an extracellular cartilage matrix protein), guanine-nucleotide binding protein, gamma 5 (membrane-associated G protein), phospholipase scramblase, lunatic fringe (LFNG; a developmental regulator of Notch in the presomitic mesoderm), and ectonucleotide pyrophosphatase/phosphodiesterase genes 4 and 5. Two of the breakpoint intervals mapped to KRAB C2H2 Zinc finger gene family clusters on chromosome 19. While it is unclear whether any of the breakpoints disrupts a gene, it is intriguing that several of the genes mapping to breakpoint intervals are associated with skeletal development, ossification, and cartilage maturation. Mis-sense mutations of the lunatic fringe gene, for example, are associated with spondylocostal dystosis, which includes vertebral congenital abnormalities of the spine and markedly long, slender fingers (Sparrow et al. 2006). Significant skeletal adaptations have occurred during the evolution of the gibbon brachiation. It is possible that such chromosomal changes may have played a role in these evolutionary adaptations, perhaps by altering gene expression or by disrupting genes. Sequence-based resolution of the breakpoints and experimental analyses will be required to determine if any of these rearrangements disrupts a functional gene and alters gene expression profiles.
The computational paired end-sequence and cytogenetics-based approaches were highly complementary. Nearly half of the breakpoints could not be recognized using computational methods alone. Most of these regions corresponded to highly repetitive regions of the genome including regions enriched for complex segmental duplications. In these regions, end sequences cannot be mapped unambiguously, and therefore rearrangements are underrepresented. In regions of lower complexity, the paired-end-sequences strategy provided exquisite resolution, allowing more subtle rearrangements to be identified and refining breakpoint intervals. Combined, the two approaches were mutually informative and emphasize the value of cytogenetics-based experimental validation accompanying computational genomics-based approaches for characterizing and verifying the organization of primate genomes. In addition, our analysis revealed four previously unpublished rearrangements. These subtle chromosomal changes involved subtelomeric regions of the genome and are consistent with their proclivity to undergo reciprocal translocations (Flint and Knight 2003; Linardopoulou et al. 2005). For example, the small portion of chromosome 11p on NLE21 or the fragment of 7p on NLE20 was not detected by previous studies. The complex reorganization of chromosome 17 sequences provides further evidence of the value of our combined approach (see NLE chromosomes 14 and 19) (Muller et al. 2003; Ferguson-Smith et al. 2005).
All the 107 synteny breaks we detected could be grouped into two categories: those that actually occurred in NLE or that NLE inherited from its gibbon ancestors (84), and those (23) that occurred in the Hominidae lineages leading to humans. Only human chromosomes 15 (NLE6), 18 (NLE4), 21 (NLE25), and X constitute single, uninterrupted chromosomal segments in NLE. All chromosomes, with the exception of 18 and 21, showed internal rearrangements with respect to the Hominoidea ancestor (Murphy et al. 2001; Wienberg 2005). Interestingly, 14 rearrangements have been shown to be NLE-specific when compared to other gibbons (Muller et al. 2003), suggesting that accelerated rates of chromosomal rearrangement have been a longstanding property of this lineage, as opposed to a punctuated event early in the evolution of this genus. In this respect, it is worth noting that the 1/22 translocation, leading to chromosomes 1b and 22b (see Methods), is a known polymorphic translocation within the N. leucogenys species (Couturier and Lernould 1991). Southern white-cheeked gibbons (NLE subspecies siki) from southern Laos and central Vietnam carry this translocation, while Northern white-cheeked gibbons (NLE subspecies leucogenys) from northern Laos and northwestern Vietnam do not. These results were confirmed by our analysis. No evidence, for example, of the 1/22 translocation was discovered by examining the BAC paired end sequences from the Northern white-cheeked gibbon in this study; however, FISH analysis of a Southern white-cheeked gibbon cell line did reveal this polymorphism in this species. Thus, since the two individuals represented in this study correspond to “subspecies” of different geographic origin, those breakpoints that are confirmed both by experimental analysis and computational analysis are enriched for sites that are less likely to be polymorphic in the species as a whole.
Comparisons of structural variation between human and various primates predict a logarithmic increase in the number of rearrangements as resolution increases (Chimpanzee Sequencing and Analysis Consortium 2005). While we have identified a few hundred sites of potential smaller rearrangement events (Supplemental Table 1), we did not observe a fourfold increase in frequency as was seen for large-chromosomal rearrangements when compared to other apes. However, the ability to detect such smaller events is constrained by the insert size of the BAC vector, which allowed us to detect events >100 kb in length. The use of other more constrained vectors such as fosmids, as well as WGS sequence data from plasmids, may uncover an abundance of smaller events. However, our preliminary data suggest that the gibbon’s excess number of rearrangements has been limited to large translocation events between nonhomologous chromosomes, as opposed to an overall increase in all forms of structural variation between humans and gibbons.
Whole-genome shotgun sequencing of the entire NLE genome could be used to further elucidate the molecular bases for chromosomal rearrangements—particularly the frequency of smaller inversions and intrachromosomal events. Information obtained from such studies could provide valuable insight into the mechanism underlying both germline and somatic chromosomal instability associated with human disease and evolution. In addition, targeted sequencing of the breakpoint intervals will allow the impact of these events in terms of gene and gene structure to be understood in the context of the evolution of the apes. The clone framework and our detailed analysis of homologous synteny breakpoints provide the infrastructure for the sequence and assembly of the gibbon genome.
Methods
BES analysis
BAC end sequences were generated from the gibbon BAC library, CHORI-271. The BAC library was constructed from lymphocyte blood material obtained from a female Northern white-cheeked gibbon (Nomascus leucogenys leucogenys) kindly provided by Alan Mootnick, Director of Gibbon Conservation, Santa Clarita Zoo, California. To eliminate potential mismapped rearrangements, we required >90% identity, >400 bp in length, and at least 150 bp of unique sequence (as defined by RepeatMasker). All clones were mapped to the human genome, and discordant sites were classified as those that exceeded 3 STD of the mean insert size (<76.5 kb or >277 kb). In principle, this allowed us to detect rearrangements >100 kb in size. Additional algorithmic details may be found in the Supplemental Methods.
FISH analysis
For FISH validation, we selected an individual gibbon that originated from a different geographic location (Southern white-cheeked gibbon) from the reference genome. Sites confirmed by both FISH and BES data would, therefore, minimize polymorphic rearrangements and enrich for rearrangements common to the NLE species. Metaphase preparations were obtained from a lymphoblastoid cell line of Nomascus leucogenys siki, kindly provided by S. Muller (Munchen). DNA extraction from BACs has already been reported (Ventura et al. 2001). FISH experiments were essentially performed as previously described (Ventura et al. 2003). Briefly, DNA probes were directly labeled with Cy3-dUTP (Perkin-Elmer) or Fluorescein-dCTP (Fermentas) by nick-translation. Two hundred nanograms of labeled probe was used for the FISH experiments. Hybridization was performed at 37°C in 2× SSC, 50% (v/v) formamide, 10% (w/v) dextran sulfate, 5 mg of COT1 DNA (Roche), and 3 mg of sonicated salmon sperm DNA, in a volume of 10 μL. Post-hybridization washing was at 60°C in 0.1× SSC (three times, high stringency). Washes of interspecific FISH experiments were performed at lower stringency: 37°C in 2× SSC, 50% formamide (three times), followed by washes at 42°C in 2× SSC (three times). Digital images were obtained using a Leica DMRXA epifluorescence microscope equipped with a cooled CCD camera (Princeton Instruments). Cy3 (red), fluorescein (green), and DAPI (blue) fluorescence signals, detected with specific filters, were recorded separately as grayscale images. Pseudocoloring and merging of images were performed using Adobe Photoshop software.
NLE-synteny block definition was obtained by FISH analysis using a set of >950 human BACs, one every ∼3 Mb, chosen on the “Clone coverage” or on the “BAC end pairs” tracks of the UCSC Database (May 2004 release). All the clones were first tested on normal human metaphase spreads to check the consistency of their in silico position with their FISH mapping position. Clones giving inconsistent results were discarded. These BACs were used in cohybridization FISH experiments to establish with certainty their reciprocal position in NLE chromosomes. Some Lar chromosomes are difficult to distinguish on the basis of DAPI banding (see a DAPI banded karyotype at our Web site http://www.biologia.uniba.it/gibbon/chromosomes/Fig_1_NLE_karyotype.html). The short and long arms of some metacentric chromosomes also are hard to distinguish. In these cases an appropriate BAC clone was always cohybridized as a reference, to unambiguously identify the chromosome and/or the chromosome arm.
Acknowledgments
We are grateful to the Washington University Genome Sequencing Center Production Group for access to BAC end sequences through the NIH trace repository and to A.R.M. for providing access to gibbon tissue used in this study. MIUR (Ministero Italiano della Universita’ e della Ricerca) and the European Commission (INPRIMAT, QLRI-CT-2002-01325) are gratefully acknowledged for financial support. This work was supported, in part, by an NIH grant HG002385 to E.E.E. E.E.E. is an investigator of the Howard Hughes Medical Institute.
Footnotes
[Supplemental material is available online at www.genome.org.]
Article published online before print. Article and publication date are at http://www.genome.org/cgi/doi/10.1101/gr.6052507
References
- Chimpanzee Sequencing Analysis Consortium Initial sequence of the chimpanzee genome and comparison with the human genome. Nature. 2005;437:69–87. doi: 10.1038/nature04072. [DOI] [PubMed] [Google Scholar]
- Couturier J., Lernould J.M., Lernould J.M. Karyotypic study of four gibbon forms provisionally considered as subspecies of Hylobates (Nomascus) concolor (Primates, Hylobatidae) Folia Primatol. (Basel) 1991;56:95–104. doi: 10.1159/000156533. [DOI] [PubMed] [Google Scholar]
- Ferguson-Smith M.A., Yang F., Rens W., O’Brien P.C., Yang F., Rens W., O’Brien P.C., Rens W., O’Brien P.C., O’Brien P.C. The impact of chromosome sorting and painting on the comparative analysis of primate genomes. Cytogenet. Genome Res. 2005;108:112–121. doi: 10.1159/000080809. [DOI] [PubMed] [Google Scholar]
- Flint J., Knight S., Knight S. The use of telomere probes to investigate submicroscopic rearrangements associated with mental retardation. Curr. Opin. Genet. Dev. 2003;13:310–316. doi: 10.1016/s0959-437x(03)00049-2. [DOI] [PubMed] [Google Scholar]
- Froenicke L. Origins of primate chromosomes—As delineated by Zoo-FISH and alignments of human and mouse draft genome sequences. Cytogenet. Genome Res. 2005;108:122–138. doi: 10.1159/000080810. [DOI] [PubMed] [Google Scholar]
- Fujiyama A., Watanabe H., Toyoda A., Taylor T.D., Itoh T., Tsai S.F., Park H.S., Yaspo M.L., Lehrach H., Chen Z., Watanabe H., Toyoda A., Taylor T.D., Itoh T., Tsai S.F., Park H.S., Yaspo M.L., Lehrach H., Chen Z., Toyoda A., Taylor T.D., Itoh T., Tsai S.F., Park H.S., Yaspo M.L., Lehrach H., Chen Z., Taylor T.D., Itoh T., Tsai S.F., Park H.S., Yaspo M.L., Lehrach H., Chen Z., Itoh T., Tsai S.F., Park H.S., Yaspo M.L., Lehrach H., Chen Z., Tsai S.F., Park H.S., Yaspo M.L., Lehrach H., Chen Z., Park H.S., Yaspo M.L., Lehrach H., Chen Z., Yaspo M.L., Lehrach H., Chen Z., Lehrach H., Chen Z., Chen Z., et al. Construction and analysis of a human–chimpanzee comparative clone map. Science. 2002;295:131–134. doi: 10.1126/science.1065199. [DOI] [PubMed] [Google Scholar]
- Goodman M. The genomic record of humankind’s evolutionary roots. Am. J. Hum. Genet. 1999;64:31–39. doi: 10.1086/302218. [DOI] [PMC free article] [PubMed] [Google Scholar]
- Jauch A., Wienberg J., Stanyon R., Arnold N., Tofanelli S., Ishida T., Cremer T., Wienberg J., Stanyon R., Arnold N., Tofanelli S., Ishida T., Cremer T., Stanyon R., Arnold N., Tofanelli S., Ishida T., Cremer T., Arnold N., Tofanelli S., Ishida T., Cremer T., Tofanelli S., Ishida T., Cremer T., Ishida T., Cremer T., Cremer T. Reconstruction of genomic rearrangements in great apes and gibbons by chromosome painting. Proc. Natl. Acad. Sci. 1992;89:8611–8615. doi: 10.1073/pnas.89.18.8611. [DOI] [PMC free article] [PubMed] [Google Scholar]
- Koehler U., Arnold N., Wienberg J., Tofanelli S., Stanyon R., Arnold N., Wienberg J., Tofanelli S., Stanyon R., Wienberg J., Tofanelli S., Stanyon R., Tofanelli S., Stanyon R., Stanyon R. Genomic reorganization and disrupted chromosomal synteny in the siamang (Hylobates syndactylus) revealed by fluorescence in situ hybridization. Am. J. Phys. Anthropol. 1995a;97:37–47. doi: 10.1002/ajpa.1330970104. [DOI] [PubMed] [Google Scholar]
- Koehler U., Bigoni F., Wienberg J., Stanyon R., Bigoni F., Wienberg J., Stanyon R., Wienberg J., Stanyon R., Stanyon R. Genomic reorganization in the concolor gibbon (Hylobates concolor) revealed by chromosome painting. Genomics. 1995b;30:287–292. doi: 10.1006/geno.1995.9875. [DOI] [PubMed] [Google Scholar]
- Linardopoulou E.V., Williams E.M., Fan Y., Friedman C., Young J.M., Trask B.J., Williams E.M., Fan Y., Friedman C., Young J.M., Trask B.J., Fan Y., Friedman C., Young J.M., Trask B.J., Friedman C., Young J.M., Trask B.J., Young J.M., Trask B.J., Trask B.J. Human subtelomeres are hot spots of interchromosomal recombination and segmental duplication. Nature. 2005;437:94–100. doi: 10.1038/nature04029. [DOI] [PMC free article] [PubMed] [Google Scholar]
- Muller S., Wienberg J., Wienberg J. “Bar-coding” primate chromosomes: Molecular cytogenetic screening for the ancestral hominoid karyotype. Hum. Genet. 2001;109:85–94. doi: 10.1007/s004390100535. [DOI] [PubMed] [Google Scholar]
- Muller S., Neusser M., Wienberg J., Neusser M., Wienberg J., Wienberg J. Towards unlimited colors for fluorescence in-situ hybridization (FISH) Chromosome Res. 2002;10:223–232. doi: 10.1023/a:1015296122470. [DOI] [PubMed] [Google Scholar]
- Muller S., Hollatz M., Wienberg J., Hollatz M., Wienberg J., Wienberg J. Chromosomal phylogeny and evolution of gibbons (Hylobatidae) Hum. Genet. 2003;113:493–501. doi: 10.1007/s00439-003-0997-2. [DOI] [PubMed] [Google Scholar]
- Murphy W.J., Stanyon R., O’Brien S.J., Stanyon R., O’Brien S.J., O’Brien S.J. Evolution of mammalian genome organization inferred from comparative gene mapping. Genome Biol. 2001;2 doi: 10.1186/gb-2001-2-6-reviews0005. reviews0005. [DOI] [PMC free article] [PubMed] [Google Scholar]
- Newman T.L., Tuzun E., Morrison V.A., Hayden K.E., Ventura M., McGrath S.D., Rocchi M., Eichler E.E., Tuzun E., Morrison V.A., Hayden K.E., Ventura M., McGrath S.D., Rocchi M., Eichler E.E., Morrison V.A., Hayden K.E., Ventura M., McGrath S.D., Rocchi M., Eichler E.E., Hayden K.E., Ventura M., McGrath S.D., Rocchi M., Eichler E.E., Ventura M., McGrath S.D., Rocchi M., Eichler E.E., McGrath S.D., Rocchi M., Eichler E.E., Rocchi M., Eichler E.E., Eichler E.E. A genome-wide survey of structural variation between human and chimpanzee. Genome Res. 2005;15:1344–1356. doi: 10.1101/gr.4338005. [DOI] [PMC free article] [PubMed] [Google Scholar]
- Nickerson E., Nelson D.L., Nelson D.L. Molecular definition of pericentric inversion breakpoints occurring during the evolution of humans and chimpanzees. Genomics. 1998;50:368–372. doi: 10.1006/geno.1998.5332. [DOI] [PubMed] [Google Scholar]
- Nie W., Rens W., Wang J., Yang F., Rens W., Wang J., Yang F., Wang J., Yang F., Yang F. Conserved chromosome segments in Hylobates hoolock revealed by human and H. leucogenys paint probes. Cytogenet. Cell Genet. 2001;92:248–253. doi: 10.1159/000056912. [DOI] [PubMed] [Google Scholar]
- Sparrow D.B., Chapman G., Wouters M.A., Whittock N.V., Ellard S., Fatkin D., Turnpenny P.D., Kusumi K., Sillence D., Dunwoodie S.L., Chapman G., Wouters M.A., Whittock N.V., Ellard S., Fatkin D., Turnpenny P.D., Kusumi K., Sillence D., Dunwoodie S.L., Wouters M.A., Whittock N.V., Ellard S., Fatkin D., Turnpenny P.D., Kusumi K., Sillence D., Dunwoodie S.L., Whittock N.V., Ellard S., Fatkin D., Turnpenny P.D., Kusumi K., Sillence D., Dunwoodie S.L., Ellard S., Fatkin D., Turnpenny P.D., Kusumi K., Sillence D., Dunwoodie S.L., Fatkin D., Turnpenny P.D., Kusumi K., Sillence D., Dunwoodie S.L., Turnpenny P.D., Kusumi K., Sillence D., Dunwoodie S.L., Kusumi K., Sillence D., Dunwoodie S.L., Sillence D., Dunwoodie S.L., Dunwoodie S.L. Mutation of the LUNATIC FRINGE gene in humans causes spondylocostal dysostosis with a severe vertebral phenotype. Am. J. Hum. Genet. 2006;78:28–37. doi: 10.1086/498879. [DOI] [PMC free article] [PubMed] [Google Scholar]
- Tuzun E., Sharp A.J., Bailey J.A., Kaul R., Morrison V.A., Pertz L.M., Haugen E., Hayden H., Albertson D., Pinkel D., Sharp A.J., Bailey J.A., Kaul R., Morrison V.A., Pertz L.M., Haugen E., Hayden H., Albertson D., Pinkel D., Bailey J.A., Kaul R., Morrison V.A., Pertz L.M., Haugen E., Hayden H., Albertson D., Pinkel D., Kaul R., Morrison V.A., Pertz L.M., Haugen E., Hayden H., Albertson D., Pinkel D., Morrison V.A., Pertz L.M., Haugen E., Hayden H., Albertson D., Pinkel D., Pertz L.M., Haugen E., Hayden H., Albertson D., Pinkel D., Haugen E., Hayden H., Albertson D., Pinkel D., Hayden H., Albertson D., Pinkel D., Albertson D., Pinkel D., Pinkel D., et al. Fine-scale structural variation of the human genome. Nat. Genet. 2005;37:727–732. doi: 10.1038/ng1562. [DOI] [PubMed] [Google Scholar]
- Ventura M., Boniotto M., Cardone M.F., Fulizio L., Archidiacono N., Rocchi M., Crovella S., Boniotto M., Cardone M.F., Fulizio L., Archidiacono N., Rocchi M., Crovella S., Cardone M.F., Fulizio L., Archidiacono N., Rocchi M., Crovella S., Fulizio L., Archidiacono N., Rocchi M., Crovella S., Archidiacono N., Rocchi M., Crovella S., Rocchi M., Crovella S., Crovella S. Characterization of a highly repeated DNA sequence family in five species of the genus Eulemur. Gene. 2001;275:305–310. doi: 10.1016/s0378-1119(01)00653-9. [DOI] [PubMed] [Google Scholar]
- Ventura M., Mudge J.M., Palumbo V., Burn S., Blennow E., Pierluigi M., Giorda R., Zuffardi O., Archidiacono N., Jackson M.S., Mudge J.M., Palumbo V., Burn S., Blennow E., Pierluigi M., Giorda R., Zuffardi O., Archidiacono N., Jackson M.S., Palumbo V., Burn S., Blennow E., Pierluigi M., Giorda R., Zuffardi O., Archidiacono N., Jackson M.S., Burn S., Blennow E., Pierluigi M., Giorda R., Zuffardi O., Archidiacono N., Jackson M.S., Blennow E., Pierluigi M., Giorda R., Zuffardi O., Archidiacono N., Jackson M.S., Pierluigi M., Giorda R., Zuffardi O., Archidiacono N., Jackson M.S., Giorda R., Zuffardi O., Archidiacono N., Jackson M.S., Zuffardi O., Archidiacono N., Jackson M.S., Archidiacono N., Jackson M.S., Jackson M.S., et al. Neocentromeres in 15q24-26 map to duplicons which flanked an ancestral centromere in 15q25. Genome Res. 2003;13:2059–2068. doi: 10.1101/gr.1155103. [DOI] [PMC free article] [PubMed] [Google Scholar]
- Wienberg J. Fluorescence in situ hybridization to chromosomes as a tool to understand human and primate genome evolution. Cytogenet. Genome Res. 2005;108:139–160. doi: 10.1159/000080811. [DOI] [PubMed] [Google Scholar]
- Yunis J.J., Prakash O., Prakash O. The origin of man: A chromosomal pictorial legacy. Science. 1982;215:1525–1530. doi: 10.1126/science.7063861. [DOI] [PubMed] [Google Scholar]


