Abstract
The separation of biologically active, pure, and specific tRNAs is difficult due to the overall similarity in secondary and tertiary structures of different tRNAs. Because prior methods do not facilitate high-resolution separations of the extremely complex mixture represented by a cellular tRNA population, global studies of tRNA identity and/or abundance are difficult. We have discovered that the enzymatic digestion of an individual tRNA by a ribonuclease (e.g., RNase T1) will generate digestion products unique to that particular tRNA, and we show that a comparison of an organism's complete complement of tRNA RNase digestion products yields a set of unique or “signature” digestion product(s) that ultimately enable the detection of individual tRNAs from a total tRNA pool. Detection is facilitated by matrix-assisted laser desorption/ionization mass spectrometry (MALDI-MS) and proof-of-principle is demonstrated on the whole tRNA pool from Escherichia coli. This method will enable the individual identification of tRNA isoacceptors without requiring specific affinity purification or extensive chromatographic and/or electrophoretic purification. Further, experimental identifications of tRNAs or other RNAs will now be possible using this signature digestion product approach in a manner similar to peptide mass fingerprinting used in proteomics, allowing RNomic studies of RNA at the post-transcriptional level.
Keywords: TRNA, E. coli, mass spectrometry, RNase T1, MALDI-MS, signature digestion product, isoaccepting tRNA, isoacceptors
INTRODUCTION
Transfer ribonucleic acid (tRNA) plays a central role in gene expression as an adaptor molecule that translates the codons in messenger RNA (mRNA) to amino acids in a protein. tRNAs’ crucial role in protein biosynthesis has been an active area of research since their discovery (Söll and Rajbhandary 1995). The identification and characterization of individual tRNAs and their post-transcriptional modifications are essential for fully understanding their cellular roles (Bjork et al. 2001). The separation of biologically active, pure, and specific tRNAs is difficult due to the overall similarity in secondary and tertiary structures of different tRNAs (Cayama et al. 2000), and numerous procedures for the fractionation of tRNAs have been reported (Holley and Merrill 1959; Cherayil and Bock 1965; Weiss et al. 1968; Rajbhandary and Ghosh 1969; Holmes et al. 1975; Garel et al. 1977; Kanduc 1994; Ribeiro et al. 1995; Chinali 1997; Cayama et al. 2000). Because prior methods do not facilitate high-resolution separations of the complex mixture represented by a cellular tRNA population, global studies of tRNA identity and/or abundance are rare. We show that the enzymatic digestion of an individual tRNA by a ribonuclease (e.g., RNase T1) will generate digestion products unique to that tRNA and that a comparison of an organism's complete complement of tRNA digestion products yields signature mass values that enable the matrix-assisted laser desorption/ionization mass spectrometry (MALDI-MS) detection of individual tRNAs from a cellular mixture.
Mass spectrometry (MS) offers a number of advantages for the characterization of nucleic acids arising from its ability to provide mass and sequence information (Meng and Limbach 2006). Characterization of RNAs by MS is commonly done at two levels: oligonucleotide analysis through the selective digestion of intact RNAs with endonucleases, and/or sequencing of oligonucleotides through the use of tandem mass spectrometry via collision-induced dissociation or post-source decay (Limbach 1996; Nordhoff et al. 1996). We and others have shown that RNAs can be characterized by mass spectrometry through the selective digestion of intact RNAs with endonucleases, which can be analyzed using liquid chromatography electrospray ionization mass spectrometry (Kowalak et al. 1993, 2000; McCloskey et al. 2001) or MALDI-MS (Polo and Limbach 1998; Kirpekar et al. 2000; Berhane and Limbach 2003a,b; Hartmer et al. 2003; Meng and Limbach 2004). While these RNase mapping approaches have been used previously to identify post-transcriptionally modified RNAs, here we develop a more extensive RNA identification strategy based upon the generation of unique or signature RNase digestion products. This approach is demonstrated on the whole tRNA pool from Escherichia coli. With this approach, identification of tRNAs, even at the level of isoacceptors, is now feasible without requiring specific affinity purification, extensive chromatographic and/or electrophoretic separations, or post-isolation labeling. This approach is amenable to all tRNA families and is of appropriate specificity to identify nearly 90% of tRNA isoacceptors from an E. coli cell lysate.
RESULTS
Signature digestion products
The enzymatic digestion of an individual tRNA by an RNase (e.g., RNase T1) will generate a number of specific endonuclease digestion products. A comparison of an organism's complete complement of tRNA RNase digestion products yields a set of unique or “signature” digestion product(s) that ultimately enable the detection of individual tRNAs from a total tRNA pool. These signature products are the essence of this approach.
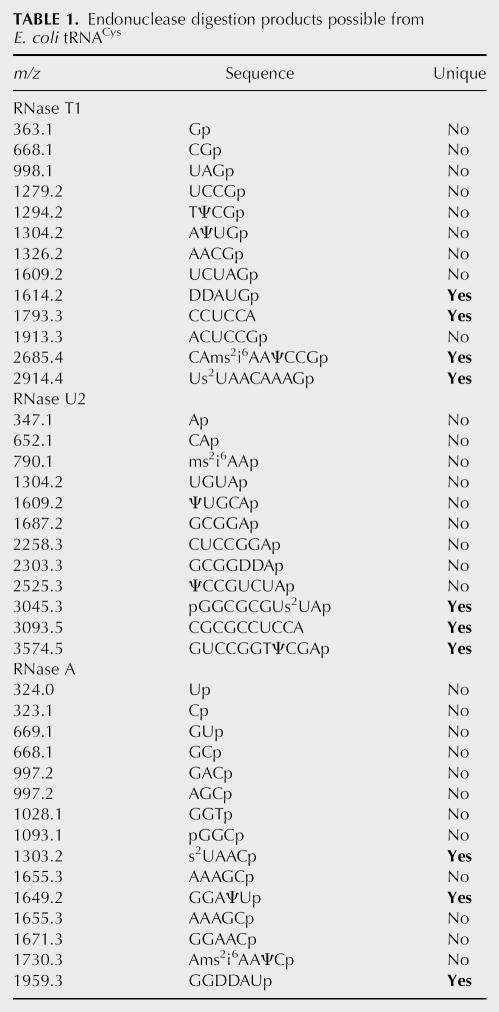
For example, the theoretical RNase T1, RNase U2, and RNase A digestion products of E. coli tRNACys are listed in Table 1. From this list, nine mass values are identical or shared by the RNase T1 digestion products of other E. coli tRNAs, whereas four mass values are unique to E. coli tRNACys. For RNase U2 digestion, nine mass values are shared with other E. coli tRNAs and three mass values are unique. Similarly, for RNase A, 12 mass values are shared and three mass values are unique. These unique mass values are the RNase signature digestion products of tRNACys. The mass spectrometric detection of any one or more of these signature products from a complex mixture will confirm the presence of the corresponding tRNA.
TABLE 1.
Endonuclease digestion products possible from E. coli tRNACys
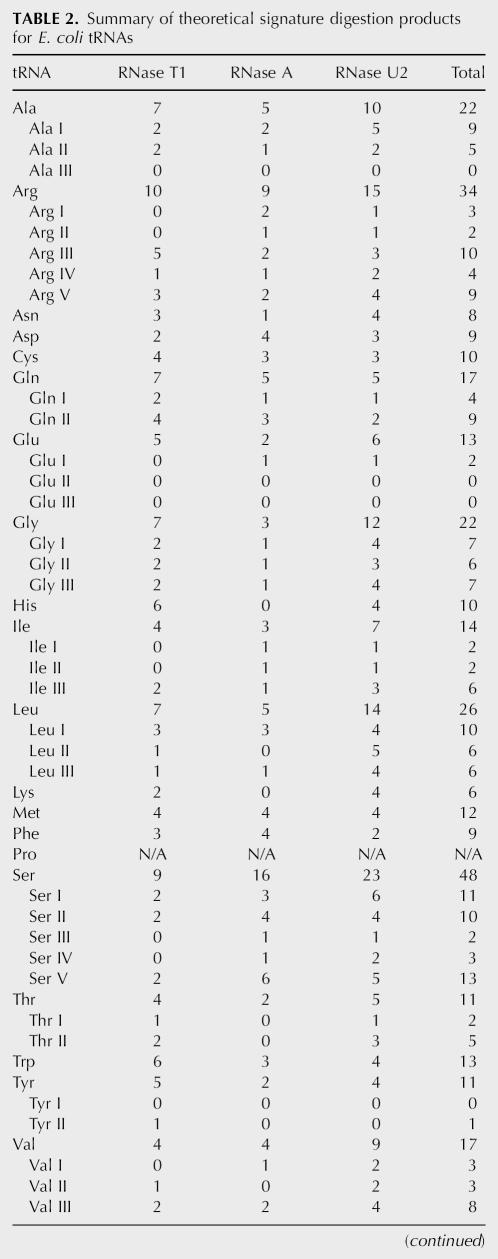
Conducting a similar analysis on all of the tRNAs from E. coli results in the signature digestion products specified in Supplemental Table S1. The number of signature digestion products for all E. coli tRNAs, with the exception of tRNAPro, which is not found in the tRNA database, from RNases T1, A, and U2 are listed in Table 2. This analysis reveals the presence of three different types of signature digestion products: Type I—a signature product unique to one tRNA; Type II—a signature product specific to one tRNA family; and Type III—a signature product selective for two or more, but not all, of the members of one tRNA family. For example, E. coli tRNAs Ini I and II yield no Type I RNase T1 signature digestion products and four Type II RNase T1 signature digestion products (m/z 748, 1888, 3501, and 3197) that identify the presence of an initiator tRNA within a mixture but cannot differentiate between the two isoacceptors. In E. coli, the only tRNAs that can have Type III signature products are Ala, Arg, Glu, Gly, Ile, Leu, Ser, and Val, with all but Gly having Type III RNase T1 signature products (Supplemental Table S1).
TABLE 2.
Summary of theoretical signature digestion products for E. coli tRNAs
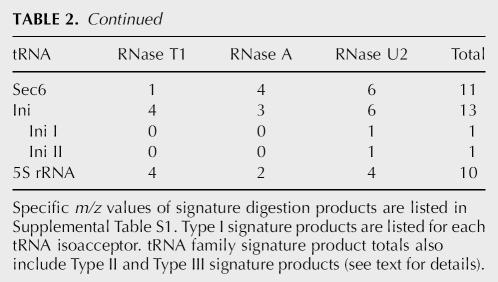
TABLE 2.
Summary of theoretical signature digestion products for E. coli tRNAs
All tRNA families have multiple signature products, ranging from a low of six for tRNALys to a high of 48 for tRNASer. All tRNA isoacceptors have at least one signature product with the exception of tRNAAla III, tRNAGlu II, tRNAGlu III, and tRNATyr I. Thus, the detection of all tRNA families except tRNAPro, and all but four tRNA isoacceptors from E. coli, is possible through the signature digestion approach.
Optimization of digestion conditions
Commercial tRNAs were used to optimize the RNase T1 and RNase A digestion conditions to ensure they were fully compatible with MALDI-MS analysis (data not presented). Complete digestion of tRNAs is obligatory for identifying specific digestion products from their respective m/z values. RNase digestion occurs via a 2′, 3′-cyclic phosphate intermediate, and the presence of this intermediate can be avoided by using an increased enzyme/substrate ratio or by lengthening the digestion time (Kirpekar et al. 2000). Although formation of alkali salts can be a concern in MALDI-MS of nucleic acids (Nordhoff et al. 1996), the presence of ammonium acetate in the RNase digestion solution reduced the formation of alkali-adduct digestion products, and no further purification prior to MS analysis was required after digestion. The absence of cyclic phosphate intermediates and alkali-adducts simplifies spectral interpretation and digestion product identification.
Analysis of simple mixtures
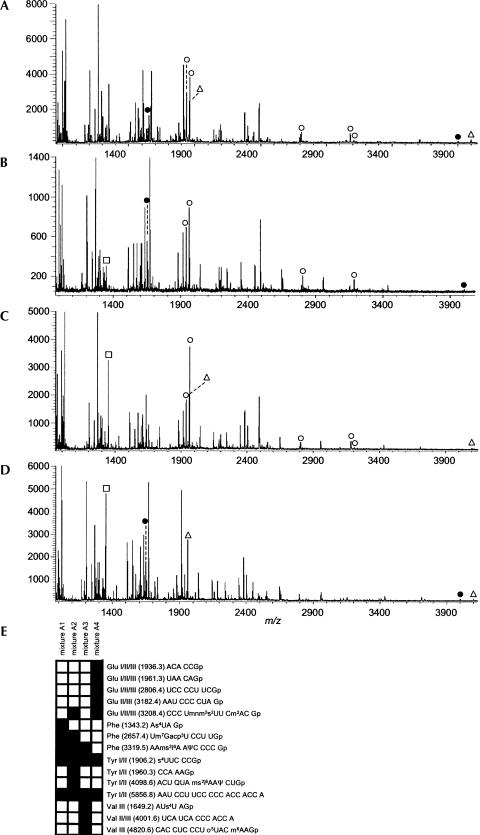
To initially confirm that MALDI-MS analysis of RNase digests of tRNAs will yield sufficient data for the identification of tRNAs through their signature digestion products, four samples, each containing three E. coli tRNA isoacceptors, were generated. Mixture A1 contained tRNATyr I, tRNAVal III, and tRNAGlu II. Mixture A2 contained tRNAPhe, tRNAVal III, and tRNAGlu II. Mixture A3 contained tRNATyr I, tRNAPhe, and tRNAGlu II, and mixture A4 contained tRNATyr I, tRNAVal III, and tRNAPhe. Each mixture was digested with RNase T1, and those digestion products were analyzed by MALDI-MS (Fig. 1). A similar set of mixtures, with the exception that tRNATyr I was replaced by tRNATyr II, was prepared for RNase A digestion and analysis (data not shown).
FIGURE 1.
MALDI mass spectra obtained from the RNase T1 digestion of mixtures of E. coli tRNAs. (A) tRNAs Tyr I, Val III, and Glu II. (B) tRNAs Phe, Val III, and Glu II. (C) tRNAs Tyr I, Phe, and Glu II. (D) tRNAs Tyr I, Phe, and Val III. RNase T1 signature digestion products for each tRNA are labeled: (Δ) Tyr I; (□) Phe; (•) Val III; and (○) Glu II. (E) Heat map representation of this data, along with m/z and sequences of signature digestion products. In all analyses, reproducible detection of the signature digestion products of the expected tRNAs is demonstrated.
For both endonucleases, the presence of specific signature digestion product peak(s) in the MALDI spectrum confirmed the presence of the constituent tRNAs in each mixture. As seen in Figure 1, for these smaller mixtures nearly all of the theoretical signature products were detected reproducibly. Further examination of the data did not reveal any m/z values indicative of signature products from other (absent) tRNA isoacceptors; thus, no false positives were noted in these analyses.
Analysis of E. coli cell lysate
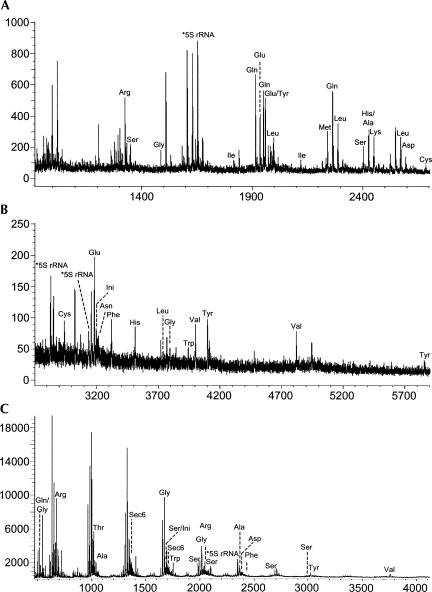
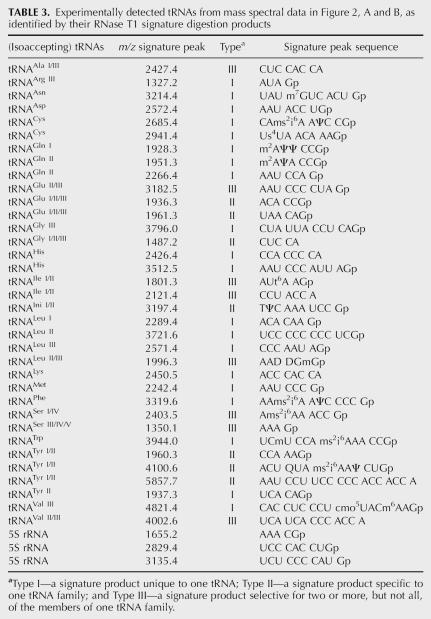
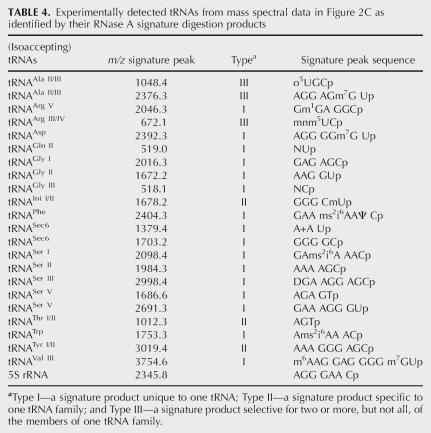
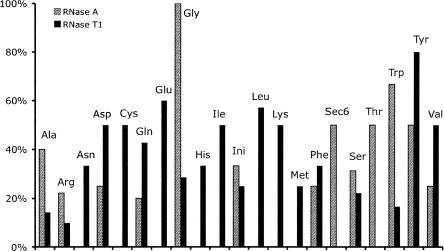
After verifying the applicability of this method for simple mixtures of tRNAs, we next expanded into the analysis of tRNAs purified from E. coli cell lysates. After purification and digestion as described in the Materials and Methods section, the RNase digest was analyzed by MALDI-MS. There are 19 tRNA families that are identified from E. coli by RNase T1 (Fig. 2A,B) with their specific signature products noted in Table 3 and 13 tRNA families identified from E. coli by RNase A (Fig. 2C) with their specific signature products noted in Table 4. tRNA families identified by both endonucleases include Ala, Arg, Asp, Gln, Gly, Ini, Phe, Ser, Trp, Tyr, and Val with signature product coverage ranging from 10% to 100% (Fig. 3).
FIGURE 2.
MALDI mass spectra obtained from the RNase T1 digestion of E. coli tRNAs. (A) m/z 900–2700; (B) m/z 2700–6000. (C) MALDI mass spectra obtained from the RNase A digestion of E. coli tRNAs. Signature products are labeled with assignments listed in Tables 3 and 4 for RNases T1 and A, respectively.
TABLE 3.
Experimentally detected tRNAs from mass spectral data in Figure 2, A and B, as identified by their RNase T1 signature digestion products
TABLE 4.
Experimentally detected tRNAs from mass spectral data in Figure 2C as identified by their RNase A signature digestion products
FIGURE 3.
Signature digestion product coverage of tRNA families analyzed from an E. coli cell lysate using RNases T1 and A.
A number of 5S RNA signature digestion peaks (3135.4, 2829.4, and 1655.3 for RNase T1 and 2345.3 for RNase A) were also detected, which is to be expected given the small RNA isolation protocol used in this work. Importantly, the presence of other small RNAs, such as 5S rRNA, does not complicate or interfere with the detection of tRNA signature digestion products, and a single MALDI analysis is sufficient to identify these tRNAs. The ribonuclease-digested transfer RNAs were also labeled with 18O and analyzed separately by MALDI-MS (Meng and Limbach 2004) to confirm the expected peaks (data not shown). All of the major peaks in the mass spectra are easily assignable to expected digestion products, and all expected products generate distinct signals. No prior fractionation is needed for this analysis.
Sample requirements and method reproducibility
The amount of sample required for this approach was determined. At the lower end, ∼50 ng of RNA sample on the MALDI target plate is sufficient to detect tRNA signature digestion products of RNase T1, with 80 ng of RNA sample required for RNase A. At the higher end, ∼5–10 μg of sample can be spotted on the MALDI target with no evidence of detector saturation. Of course, concentrated samples can always be diluted to the suitable range as required prior to MALDI analysis in this process as the endonuclease digestion reaction is irreversible.
To determine the reproducibility of the method, three separate RNase T1 digestions of an E. coli cell lysate were analyzed by MALDI-MS three times each. As noted in Supplemental Figure S1, reproducible information and identifications can be obtained from RNase signature digestion products. Although most E. coli tRNAs have multiple signature digestion products, all are not typically detected in a MALDI mass spectrum (Supplemental Fig. S1). The most likely reason is the peak suppression effect, which is common in MALDI-MS (Knochenmuss 2003).
DISCUSSION
Signature digestion products
A list of all the theoretical signature digestion products of E. coli tRNAs are presented as supplemental material (Supplemental Table S1). Reviewing these data, from the 46 E. coli tRNAs, 31 yield RNase T1 signature digestion products, 40 yield RNase U2 signature digestion products, and 32 yield RNase A signature digestion products. Individually, 89% of the E. coli tRNAs can be identified solely by using RNase U2. For E. coli, the only tRNAs isoacceptors that do not yield at least one signature digestion product are tRNAAla III, tRNAGlu II, tRNAGlu III, and tRNATyr I.
While several tRNA isoacceptors have only a single Type I signature product for any particular RNase chosen (Table 2), besides the four tRNA isoacceptors with no signature products for any RNase, all other tRNA isoacceptors except Ini I, Ini II, and Tyr II yield Type I signature products from at least two of the three RNases investigated. Thus, an improvement in tRNA coverage and a reduction in the possibility of false positives can be realized when multiple RNases are used (Fig. 3). When feasible, it is recommended that RNases T1, U2, and A be used to provide maximal coverage and allow for multiple, independent identifications of tRNA isoacceptors.
The present approach has several similarities to the peptide mass fingerprinting approach popular in proteomics. A unique difference, however, is that here positive identification of a tRNA isoacceptor is made on the basis of detection of any one of its signature products as opposed to a comparison of all RNase fragment ions with database predictions. In this way, our approach is most analogous to the accurate mass tag method described for protein identification (Conrads et al. 2000), although those stringent levels of mass accuracy are not necessary for the success of the present approach.
E. coli cell lysate
Applying this approach for tRNA identification to a complex mixture of tRNAs, such as those obtained from an E. coli cell lysate, reveals the potential of this method. tRNAs identified by both endonucleases through Type I signature products include Asp, Gln II, Gly III, Phe, Trp, and Val III. tRNAs identified by both endonucleases through a combination of Type I–III signature products include Ala III, Arg III, Gly I/II/III, Ini I/II, Ser I/III/IV, and Tyr I/II. tRNAs detectable only in RNase T1 digests included Ala I, Asn, Cys, Gln I, Glu I/II/III, His, Ile I/II, Leu I/II/III, Lys, Met, and Val II (Table 3). tRNAs detectable only in RNase A digests include Ala II, Arg IV/V, Sec6, Ser II, and Thr I/II (Table 4). Altogether, 21 tRNA families were detected by either RNase T1 or RNase A, with 11 tRNA families represented in both endonuclease digestions (Fig. 3). At the individual level, 40 of 46 possible tRNAs were identified, although with the two RNases used in this study, only 62% were identified using the more stringent Type I signature products. Further improvements are expected when RNase U2 becomes available and experimental data can be incorporated into the approach.
While there are 46 possible E. coli tRNAs that could be present in this mixture, the codon bias of E. coli leads to the possibility of widely varying tRNA abundances within the sample. Supplemental Table S2 lists the frequency of tRNA isoacceptors in a typical E. coli cell and the results found in the MALDI-MS approach developed here. The abundance of tRNA isoacceptors listed are from E. coli strain W1485, a derivative of E. coli K12 (Dong et al. 1996), which is an appropriate representation of the MRE 600 strain used here, as it has been previously reported that the tRNA contents of the two enterobacteriaceae (E. coli and Salmonella typhimurium) are quite similar, indicating that the populations of tRNA molecules have been conserved during evolution (Ikemura 1981, 1985; Ikemura and Ozeki 1983). It should be pointed out that bacterial tRNA populations differ greatly from that of yeast, for instance, Saccharomyces cerevisiae (Ikemura 1982).
The isoaccepting tRNAs present in a typical E. coli cell can be grouped into two main categories: major (those present in >2% of total tRNAs) and minor (<2% of total tRNAs). With the exception of Arg I and II, all major tRNAs were detected by the signature digestion peak approach. Arg I and II share a common RNase T1 signature peak, and their RNase A signature peaks were not detected in the MALDI-MS data. Among the 21 minor tRNAs, 86% were detected by at least one of the RNase digestions, if not both. No bias can be detected with this method toward only the most abundant tRNAs within the sample.
While not reported here, the signature digestion product approach can be combined with RNase-mediated labeling for the relative and absolute quantification of tRNAs from a cell lysate (Berhane and Limbach 2003b; Meng and Limbach 2005). The approach as developed cannot be used for the de novo identification of RNAs. Moreover, some signature digestion products arise from the presence of post-transcriptional modifications. For example, among the detected E. coli RNase T1 signature digestion products (Table 3), the signature products for Asn, Cys, Gln I, Gln II, Ini I/II, Leu II/III, Phe, Ser I/IV, Trp, Tyr I/II, and Val III contain post-transcriptionally modified nucleosides. Reviewing the data in Supplemental Table S1, slightly more than half (54%) of the RNase T1 signature products contain modified nucleosides. However, only tRNA isoacceptors Arg IV, Arg V, Val II, Val II, and Sec6 contain modified nucleosides in each of their Type I signature products. In general, therefore, it appears that undermodification of tRNAs or the lack of modification status would not preclude the use of this approach. It is clear that additional applications of this approach will be enabled by more comprehensive RNA sequence databases, which incorporate the modification status of the RNAs.
MATERIALS AND METHODS
Materials
Escherichia coli strain MRE 600 was purchased from American Type Culture Collection (ATCC). E. coli tRNAVal III, tRNATyr I, tRNATyr II, tRNAGlu II, tRNAPhe, diammonium hydrogen citrate (DAHC), and 2,4,6-trihydroxyacetophenone (THAP) were purchased from Sigma-Aldrich and used as received. RNase T1 and A were obtained from Roche Molecular Biochemicals. Sep-Pak C18 cartridges were obtained from Waters. MOPS minimal media was purchased from Teknova. Synthetic oligonucleotides (dT3, dT5, dT15, and dT20) were obtained from the University of Cincinnati DNA Core Facility. Nanopure water (18 MΩ), from a Barnstead (Dubuque, IA) nanaopure system, was autoclaved before use.
Bacterial cultures
E. coli strain MRE 600 was grown in MOPS minimal media, which is a modification of Neidhardt supplemented MOPS minimal media (Neidhardt et al. 1974). E. coli cells were grown aerobically at 37°C with vigorous shaking (300 rpm) in an incubator shaker (Innova 4000, New Brunswick Scientific). Cells were harvested at a cell density corresponding to an A540 of 0.50.
Isolation of small RNAs
Total tRNA from E. coli was isolated using the mirVana miRNA isolation kit from Ambion. Briefly, E. coli cells with culture media were centrifuged at 10,000 rpm for 10 min in a Sorvell RC 5C centrifuge. After centrifugation, the media solution was discarded and pellets were collected. After washing with phosphate-buffered saline at pH 7.2 several times, lysis/binding buffer solution was added to the disrupted cells.
For immediate analysis, one-tenth volume of the mirVana homogenate solution was added to the lysis/binding buffer-added disrupted microbial cells and the mixture was incubated for 10 min on ice. A volume of acid-phenol:chloroform equal to the initial lysate volume was added. The aqueous phase was carefully recovered and was transferred to a fresh tube. One-third volume of 100% ethanol was added and mixed thoroughly. The lysate/ethanol mixture was passed through a filter cartridge and the filtrate was collected. A two-thirds volume of 100% ethanol was added to the filtrate. The filtrate/ethanol was passed through a second filter cartridge and the flow-through was discarded. The filter was washed with mirVana wash solution I, and the flow-through was discarded. The filter cartridge was transferred into a fresh collection tube and nuclease-free water was added to the center of the filter. The solution was spun for 20–30 sec at 10,000 rpm to recover the small RNA. The eluent, which contained the RNA, was collected and stored at −20°C prior to further analysis. The purity and concentration of the isolated RNA were determined from the A260/A280 absorbance ratio (Cherayil 1990). If the RNA isolation processes were done later, then the disrupted cells were submerged in an RNAlater solution and stored at −20°C.
Enzyme purification and digestion
Ribonuclease T1 (E.C. 3.1.27.3) was precipitated from its original suspension by the use of acetone. The precipitate was resuspended and eluted in 1 mL of 75% aqueous acetonitrile from a Sep-pak C18 cartridge. The solution was taken to dryness and resuspended in sterile water. Approximately 10 μg of RNA was added to 500 units of RNase T1 and 5 μL of 220 mM ammonium acetate buffer. The reaction mixtures were incubated for an hour at 37°C. The minimum enzyme-to-substrate ratio was estimated to be ∼50 units per μg of RNA. For RNase A (E.C. 3.1.27.5) digestions, ∼10 μg of RNA was added to 0.1 units of RNase A in ammonium acetate buffer, followed by incubation for 2 h at 37°C.
Mass spectrometry
All mass spectrometry experiments were performed on a Bruker Reflex IV MALDI-TOF from Bruker Daltonics having a 3-m effective flight path, a two-stage gridless ion reflector, pulsed ion extraction, and a nitrogen laser (λ=337 nm). All MALDI spectra were acquired in negative polarity and in reflectron mode.
A two-layer sample spotting approach was used. The matrix components were 250 mM THAP in acetonitrile and 300 mM DAHC in water, with each being prepared fresh before use. Approximately 0.5 μL of the THAP matrix was first spotted onto the MALDI sample target plate and allowed to dry. Equal volumes of THAP and DAHC were combined and then mixed with an equal volume of the sample solution. Approximately 1 μL of this sample/matrix solution was spotted on top of the previously dried THAP.
Vendor-supplied Flex control and X-mass software were used for data acquisition and processing, respectively. Typically, 200 laser shots were co-added per spectrum. Each spectrum was smoothed using a five-point Savitsky–Golay algorithm and background subtracted. The instrument was calibrated externally with synthetic oligonucleotides that bracketed the m/z range of interest.
Signature digestion products
tRNA sequences were obtained from the tRNA sequence database (Sprinzl and Vassilenko 2005). Published sequences were digested in silico using the Mongo Oligo Mass Calculator v2.06 (Rozenski 2006).
SUPPLEMENTAL DATA
Supplemental material including a complete listing of RNase signature digestion products from a larger number of organisms is available for download in Excel file format at http://bearcatms.uc.edu/signature/.
ACKNOWLEDGMENTS
We thank Professor Ruxandra Dima (University of Cincinnati) for helpful discussions and assistance with the data analysis and presentation. Financial support for this work was provided by the National Institutes of Health (GM 58843), the National Science Foundation (CHE 0602413 cofunded by the MPS/CHE and BIO/IDBR Divisions, and by the MPS Office of Multidisciplinary Activities), and the University of Cincinnati.
Footnotes
Article published online ahead of print. Article and publication date are at http://www.rnajournal.org/cgi/doi/10.1261/rna.272507.
REFERENCES
- Berhane, B.T., Limbach, P.A. Functional microfabricated sample targets for matrix-assisted laser desorption/ionization mass spectrometry analysis of ribonucleic acids. Anal. Chem. 2003a;75:1997–2003. doi: 10.1021/ac020710i. [DOI] [PubMed] [Google Scholar]
- Berhane, B.T., Limbach, P.A. Stable isotope labeling for matrix-assisted laser desorption/ionization mass spectrometry and post-source decay analysis of ribonucleic acids. J. Mass Spectrom. 2003b;38:872–878. doi: 10.1002/jms.504. [DOI] [PubMed] [Google Scholar]
- Bjork, G.R., Jacobsson, K., Nilsson, K., Johansson, M.J.O., Bystrom, A.S., Persson, O.P. A primordial tRNA modification required for the evolution of life? EMBO J. 2001;20:231–239. doi: 10.1093/emboj/20.1.231. [DOI] [PMC free article] [PubMed] [Google Scholar]
- Cayama, E., Yepez, A., Rotondo, F., Bandeira, E., Ferreras, A.C., Triana-Alonso, J.F. New chromatographic and biochemical strategies for quick preparative isolation of tRNA. Nucleic Acids Res. 2000;28:e64. doi: 10.1093/nar/28.12.e64. [DOI] [PMC free article] [PubMed] [Google Scholar]
- Cherayil, J.D. Transfer RNAs and other soluble RNAs. CRC Press; Boca Raton, FL: 1990. [Google Scholar]
- Cherayil, J.D., Bock, R.M. A column chromatographic procedure for the fractionation of s-RNA. Biochemistry. 1965;4:1174–1183. doi: 10.1021/bi00882a028. [DOI] [PubMed] [Google Scholar]
- Chinali, G. Isolation of tRNA isoacceptors by affinity chromatography with immobilized elongation factor Tu from Escherichia coli . J. Biochem. Biophys. Methods. 1997;34:1–10. doi: 10.1016/s0165-022x(96)00028-0. [DOI] [PubMed] [Google Scholar]
- Conrads, T., Anderson, G., Veenstra, T., Pasa-Tolic, L., Smith, R. Utility of accurate mass tags for proteome-wide protein identification. Anal. Chem. 2000;72:3349–3354. doi: 10.1021/ac0002386. [DOI] [PubMed] [Google Scholar]
- Dong, H., Nilsson, L., Kurland, C.G. Co-variation of tRNA abundance and codon usage in Escherichia coli at different growth rates. J. Mol. Biol. 1996;260:649–663. doi: 10.1006/jmbi.1996.0428. [DOI] [PubMed] [Google Scholar]
- Garel, J., Garber, R.L., Siddiqui, M.A. Transfer RNA in posterior silk gland of Bombyx mori: Polyacrylamide gel mapping of mature transfer RNA, identification and partial structural characterization of major isoacceptors species. Biochemistry. 1977;16:3618–3624. doi: 10.1021/bi00635a018. [DOI] [PubMed] [Google Scholar]
- Hartmer, R., Strom, N., Boecker, S., Rodi, C.P., Hillenkamp, F., Jurinke, C., Boom, D.V. RNase T1 mediated base-specific cleavage and MALDI-TOF MS for high-throughput comparative sequence analysis. Nucleic Acids Res. 2003;31:e47. doi: 10.1093/nar/gng047. [DOI] [PMC free article] [PubMed] [Google Scholar]
- Holley, R.W., Merrill, S.H. Countercurrent distribution of an active ribonucleic acid. J. Am. Chem. Soc. 1959;81:753. [Google Scholar]
- Holmes, W.M., Hurd, R.E., Reid, B.R., Rimerman, R.A., Hatfield, G.W. Separation of transfer ribonucleic acids by sepharose chromatography using reverse salt gradients. Proc. Natl. Acad. Sci. 1975;72:1068–1071. doi: 10.1073/pnas.72.3.1068. [DOI] [PMC free article] [PubMed] [Google Scholar]
- Ikemura, T. Correlation between the abundance of Escherichia coli transfer RNAs and the occurance of the respective codons in its protein genes. J. Mol. Biol. 1981;146:1–21. doi: 10.1016/0022-2836(81)90363-6. [DOI] [PubMed] [Google Scholar]
- Ikemura, T. Correlation between codon usage and tRNA content in microorganisms. In: Dolph L., et al., editors. Transfer RNA in protein synthesis. CRC Press; Boca Raton, FL: 1982. [Google Scholar]
- Ikemura, T. Codon usage, tRNA content, and rate of synonymous substitution. In: Ohta T., Aoki K., editors. Population genetics and molecular evolution. Springer-Verlag; Berlin: 1985. pp. 385–406. [Google Scholar]
- Ikemura, T., Ozeki, H. Codon usage and transfer RNA contents: Organism-specific codon-choice patterns in reference to the isoacceptor contents. Cold Spring Harb. Symp. Quant. Biol. 1983;47:1087–1097. doi: 10.1101/sqb.1983.047.01.123. [DOI] [PubMed] [Google Scholar]
- Kanduc, D. Fractionation of rat liver tRNA by reversed-phase high performance liquid chromqtography: Isolation of iso-tRNAs. Prep. Biochem. 1994;24:167–174. doi: 10.1080/10826069408010090. [DOI] [PubMed] [Google Scholar]
- Kirpekar, F., Douthwaite, S., Rosepstorff, P. Mapping posttranscriptional modifications in 5S ribosomal RNA by MALDI mass spectrometry. RNA. 2000;6:296–306. doi: 10.1017/s1355838200992148. [DOI] [PMC free article] [PubMed] [Google Scholar]
- Knochenmuss, R. A quantitative model of ultraviolet matrix-assisted laser desorption/ionization including analyte ion generation. Anal. Chem. 2003;75:2199–2207. doi: 10.1021/ac034032r. [DOI] [PubMed] [Google Scholar]
- Kowalak, J., Bruenger, E., Crain, P.F., McCloskey, J.A. Identities and phylogenic comparisons of posttranscriptional modifications in 16S ribosomal RNA from Haloferax volcanii . J. Biol. Chem. 2000;275:24484–24489. doi: 10.1074/jbc.M002153200. [DOI] [PubMed] [Google Scholar]
- Kowalak, J., Pomerantz, S., Crain, P.F., McCloskey, J.A. A novel method for the determination of posttranscriptional modification in RNA by mass spectrometry. Nucleic Acids Res. 1993;21:4577–4583. doi: 10.1093/nar/21.19.4577. [DOI] [PMC free article] [PubMed] [Google Scholar]
- Limbach, P.A. Indirect mass spectrometric methods for the characterization and sequencing of oligoncleotides. Mass Spectrom. Rev. 1996;15:297–336. doi: 10.1002/(SICI)1098-2787(1996)15:5<297::AID-MAS2>3.0.CO;2-D. [DOI] [PubMed] [Google Scholar]
- McCloskey, J.A., Graham, D.A., Zhou, S.L., Crain, P.F., Ibba, M., Konisky, J., Söll, D., Olsen, G.J. Posttranscriptional modification in archaeal tRNAs: Identities and phylogenetic relations of nucleotides from mesophilic and hyperthermophilic methanococcales. Nucleic Acids Res. 2001;29:4699–4706. doi: 10.1093/nar/29.22.4699. [DOI] [PMC free article] [PubMed] [Google Scholar]
- Meng, Z., Limbach, P.A. RNase mapping of intact nucleic acids by electrospray ionization fourier transform ion cyclotron resonance mass spectrometry (ESI-FTICRMS) and 18O labeling. Int. J. Mass Spectrom. 2004;234:37–44. [Google Scholar]
- Meng, Z., Limbach, P.A. Quantitation of ribonucleic acids using 18O labeling and mass spectrometry. Anal. Chem. 2005;77:1891–1895. doi: 10.1021/ac048801y. [DOI] [PubMed] [Google Scholar]
- Meng, Z., Limbach, P.A. Mass spectrometry of RNA: Linking the genome to the proteome. Brief. Funct. Genomic. Proteomic. 2006;5:87–95. doi: 10.1093/bfgp/ell012. [DOI] [PMC free article] [PubMed] [Google Scholar]
- Neidhardt, F.C., Bloch, P.L., Smith, D.F. Culture medium for enterobacteria. J. Bacteriol. 1974;119:736–747. doi: 10.1128/jb.119.3.736-747.1974. [DOI] [PMC free article] [PubMed] [Google Scholar]
- Nordhoff, E., Kirpekar, F., Roepstroff, P. Mass spectrometry of nucleic acids. Mass Spectrom. Rev. 1996;15:69–138. doi: 10.1002/(SICI)1098-2787(1996)15:2<67::AID-MAS1>3.0.CO;2-8. [DOI] [PubMed] [Google Scholar]
- Polo, L.M., Limbach, P.A. Matrix-assisted laser desorption/ionization time-of-flight mass spectrometry for the analysis of RNase H cleavage products. J. Mass Spectrom. 1998;33:1226–1231. doi: 10.1002/(SICI)1096-9888(199812)33:12<1226::AID-JMS739>3.0.CO;2-#. [DOI] [PubMed] [Google Scholar]
- Rajbhandary, U.L., Ghosh, H.P. Studies on polynucleotides; XCI. Yeast methionine transfer ribonucleic acid: Purification, properties, and terminal nucleotides sequences. J. Biol. Chem. 1969;244:1104–1113. [PubMed] [Google Scholar]
- Ribeiro, S., Nock, S., Sprinzl, M. Purification of amino-acyl tRNA by affinity chromatography on immobilized Thermus thermophilus EF-TU-GTP. Anal. Biochem. 1995;228:330–335. doi: 10.1006/abio.1995.1359. [DOI] [PubMed] [Google Scholar]
- Rozenski, J. Nucleic acids toolbox. 2006 http://library.med.utah.edu/masspec/
- Sprinzl, M., Vassilenko, K.S. Compilation of tRNA sequences and sequences of tRNA genes. Nucleic Acids Res. 2005;33:D139–D140. doi: 10.1093/nar/gki012. [DOI] [PMC free article] [PubMed] [Google Scholar]
- Söll, D., Rajbhandary, U.L. tRNA: Structure, biosynthesis and function. ASM Press; Washington, DC: 1995. [Google Scholar]
- Weiss, J.F., Pearson, R.L., Kelmers, A.D. Two additional reversed-phase chromatographic systems for the separations of transfer ribonucleic acids and their application to the preparation of two formylmethionine and a valine transfer ribonucleic acid from Escherichia coli B. Biochemistry. 1968;7:3479–3487. doi: 10.1021/bi00850a024. [DOI] [PubMed] [Google Scholar]


